An early magma ocean on Mars?

The division of the lunar surface into two petrological domains – ancient anorthositic highlands and younger basaltic maria – spurred the idea, as long ago as the early 1970s, that the early Moon had a deep ocean of magma at the surface, whose cooling caused fractional crystallization. Low density plagioclase feldspar, dominated by high-calcium anorthite and bytownite, floated to the surface to form the lunar anorthosites leaving a more mafic mantle from which the mare basalts formed by partial melting. The key evidence in support of this hypothesis lies in the rare-earth elements of the two terrains. Because plagioclase feldspar has a much stronger affinity to incorporate the element europium (Eu) than the other REEs, the lunar anorthosites are enriched in Eu compared with its related elements. If the highland anorthosites did form by fractional crystallisation the remaining magma that formed the lunar mantle would be depleted in Eu yet enriched in the remaining REE. Although there are no samples of the Moon’s mantle there are plenty of the mare basalts that formed when it partially melted, probably as a result of huge impacts around 3.8 billion years ago. They should have inherited dominant features of mantle geochemistry, and indeed they do show characteristic depletion of Eu.

Lunar Highlands, near Descartes Crater. Collec...
Lunar Highland anorthosite, collected by the crew of Apollo 16. (credit: Wikipedia)

The giant-impact hypothesis for the Earth-Moon system presupposes that such a cataclysm would have left much of the outer Earth in much the same molten condition and destined to fractionate in the same manner. There are geochemical hints from terrestrial rocks that do support such an idea. An important target for exploration of Mars has been to check if a magma ocean also existed early in its history. Of the various missions in recent years only two have the capacity to shed useful light on the issue: the US Mars Reconnaissance Orbiter and Mars Odyssey. Both orbiters carry more sophisticated remote sensing instruments than any circling the Earth. The first has the hyperspectral Compact Reconnaissance Imaging Spectrometer for Mars (CRISM) that senses visible to short-wave infrared (VNIR) radiation, the other deploys  the Thermal Emission Imaging System (THEMIS) that captures different parts of the longer wavelength thermal infrared (TIR) spectrum emitted by surface materials. Both allow spectra of surface materials to be reconstructed and compared with the features of known minerals from the Earth and Moon.

Feldspars are highly reflective for the most part of  the VNIR range but show a shallow, broad absorption feature centred on a wavelength of 1.26 micrometres. Such spectra have been detected using CRISM from parts of the Martian surface in the highlands of its southern hemisphere (Carter, J. & Poulet, F. 2013. Ancient plutonic processes on Mars inferred from the detection of possible anorthositic terrains. Nature Geoscience, v. 6, p. 1008-1012). The authors, from Chile and France, acknowledge that the plagioclase-rich rocks occur only in small patches, unlike the vast tracts on the Moon, and also that on Earth anorthosites are known to have formed by a variety of processes from far smaller magma systems than a veritable ocean of molten rock. Feldspars also show spectral features in the TIR, though not so distinctive, both plagioclase and alkali feldspars being very similar. Moreover, THEMIS deploys sensor for only 10 thermal wavebands, compared with 544 on CRISM.  A team of US remote sensers (Wray, J.J. and 8 others 2013. Prolonged magmatic activity on Mars inferred from the detection of felsic rocks. Nature Geoscience, v. 6, p. 1013-1017) used both CRISM and THEMIS data. While noting resemblances to lunar anorthosites, they adopt a more cautious approach to the spectra and prefer the broad, ‘sack’ term ‘felsic rocks’. It seemed possible from their work that feldspar-rich magmas may have formed by partial melting of common andesitic crust noted from the Martian surface: high spatial resolution images of the occurrences bear some resemblance to outcrops of granitic rocks in arid environments on Earth. That is, there may be highly evolved rocks akin to terrestrial continental crust.

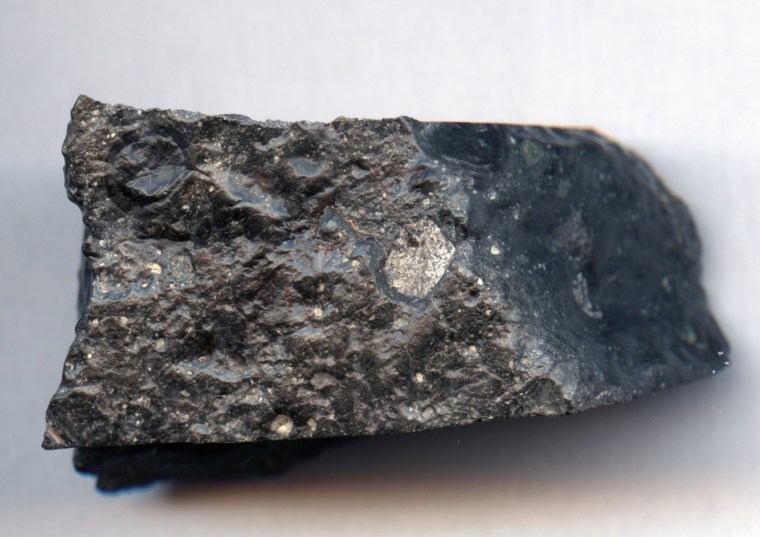
The interesting spectral observations on Mars can only be validated by actual rock samples. While rovers still operating on the Martian surface are well able to produce geochemical data that would petrologically characterise most rocks that they encounter, none of them is in a terrain suitable for resolving this particular issue. Yet, coincidentally, a meteorite found in West Africa shows hallmarks of having been blasted from the surface of Mars and sheds useful light on various hypotheses about the Martian crust http://earth-pages.co.uk/2013/11/21/a-glimpse-of-early-martian-crust/. It is a breccia that may represent the soil or regolith that accumulated from early impacts that shattered and melted surface materials, and it is extremely old: zircons yielded an age of 4428 Ma. The clasts set in a fine matrix consist of a variety of igneous rocks, none of which are anorthosites. Some are coarse grained, plutonic rocks containing both alkali feldspars and plagioclase, which match terrestrial monzonites; broadly speaking members of the granite family. Having formed from the ejecta of large impacts, such regolith materials represent the breadth of compositions across the planet and extending deep into its crust. This one suggests that anorthosites may have been rare on early Mars.

Fresh offshore groundwater resources

There are paradoxes with groundwater: while over-use of coastal aquifers may draw in seawater to become undrinkable, on reef islands with no surface water adequate supplies may be had from fresh groundwater ‘floating’ on deeper, denser salt water. Seemingly even more odd, there are places several kilometres off some coastlines where freshwater rises in large volumes to the surface from springs on the sea floor.

Despite this and the fact that onshore aquifers extend far out to sea on continental shelves, hydrogeologists have paid scant attention to the potential water supplies that they might offer. Indeed, around the Persian Gulf where many submarine fresh springs are known petrodollars have poured into desalination rather than cheaper drilling and pipelines to the aquifers feeding the springs.

Reviewing the known potential of offshore groundwater, which occurs seawards of most continental shores, Vincent Post of Flinders University, Australia and colleagues from Holland, the US and Britain, consider that the global potential might be as high as half a million cubic kilometres (Post, V.E.A. et al. 2013. Offshore fresh groundwater reserves as a global phenomenon. Nature , v. 504, p. 71-78), around one tenth that of shallow (<750 m deep) groundwater onshore . It should be noted that the maximum safe level of salts dissolved in drinking water is about 1 gram per litre, and double that for irrigation water. The best prospects are where aquifers are trapped beneath impermeable sedimentary layers that prevent downward contamination by salt water.

The key to explaining such huge reserves is dating the water. In those places where that has been done the water is older than the Holocene (i.e. > 11 ka), which suggests infiltration when sea level was as much as 130 m lower than in interglacial periods, due to storage of evaporated seawater in major ice sheets. That would have exposed vast areas of what is now the sea floor to recharge. Modelling downward diffusion of seawater as sea level rose suggests that interglacials have too short to fully flush fresh water from the now submarine aquifers. Nevertheless, recharge is not continual, so that exploiting the resource is akin to ‘mining’ water. Yet the potential may prove essential in some coastal regions, and the authors caution against contamination by human activities offshore, such as exploration drilling for petroleum and carbon dioxide sequestration.

The review points out that submarine hydrogeology is one of the last great challenges in analysis of sedimentary basins.

Mitochondrial DNA from 400 thousand year old humans

The Sima de los Huesos (‘pit of bones’) site in the cave complex of Atapuerca in northern Spain has yielded one of the greatest assemblages of hominin bones. Well-preserved remains of at least 28 individuals date to the Middle Pleistocene (>300 ka). Anatomically the individuals have many Neanderthal-like features but also show affinities with earlier Homo heidelbergensis, who is widely considered to be the common ancestor for anatomically modern humans and Neanderthals, and perhaps also for the mysterious Denisovans. Most palaeoanthropologists have previously considered this Atapuerca group to be early Neanderthals, divergent from African lineages because they migrated to and became isolated in Europe.

English: Cranium 5 is one of the most importan...
Human cranium from the Sima de los Huesos, Atapuerca mountains (Spain). (credit: Wikipedia)

The riches of the Sima de los Huesos ossuary made it inevitable that attempts would be made to extract DNA that survived in the bones, especially as bear bones from the area had shown that mtDNA can survive more than 4300 ka. There has been an air of expectancy in hominin-evolution circles, and indeed among the wider public, since rumours emerged that the famous Max Planck Institute for Evolutionary Anthropology in Leipzig, Germany had initiated genetic sequencing under the direction of Svante Pääbo: perhaps another ‘scoop’ to add to their reconstructing the first Neanderthal and Denisovan genomes. The news came out in the 5 December 2013 issue of Nature, albeit published on-line (Meyer, M. and 10 others 2013. A mitochondrial genome sequence of a hominin from Sima de los Huesos, Nature, v. 504; doi:10.1038/nature12788) with a discussion by Ewan Callaway (Callaway, E. 2013. Hominin DNA baffles experts Nature, v. 504, p. 16-17).

The bafflement is because the mtDNA from a femur of a 400 ka  individual does not match existing Neanderthal data as well as it does that of the Denisovan from Siberia by such a degree that the individual is an early Denisovan not a Neanderthal. Northern Spain being thousands of kilometres further west than the Denisova cave heightens the surprise.  Indeed, it may be on a lineage from an earlier hominin that did not give rise to Neanderthals. The full Neanderthal and Denisovan genomes suggest that they shared a common ancestor up to 700 ka ago. So the Sima de los Huesos individual presents several possibilities. It could be a member of an original population of migrants from Africa that occupied wide tracts of Eurasia, eventually to give rise to both Neanderthals and Denisovans. That genetic split may have arisen by the female line carrying it not surviving into populations that became Neanderthals – mtDNA is only present in the eggs of mothers. Mind you, that begs the question of who the Neanderthal females were. Another view is that the Sima de los Huesos individual may be descended from even earlier H. antecessor, whose 800 ka remains occur in a nearby cave. Pääbo’s team have even suggested that Denisovans interbred with a mysterious group: perhaps relics of the earlier H. antecessor colonists.

Established ideas of how humans emerged, based on bones alone and very few individuals to boot, are set to totter and collapse like a house of cards. Interbreeding has been cited three times from DNA data: modern human-Neanderthal; modern human-Denisovan and Denisovan with an unknown population. Will opinion converge on what seems to be obvious, that one repeatedly errant species, albeit with distinct variants, has been involved from far back in the human evolutionary journey?  There seems only one avenue to follow for an answer, which is to look for well preserved H. heidelbergensis. H. antecessor and H. erectus remains and apply ever improving techniques of genetic retrieval. Yet there is a chance that stretches of ancient DNA can be teased out of younger fossils.

Greening the Earth, Devonian forest fires and a mass extinction

Land plants begin to appear in the fossil record as early as the late Ordovician (~450 Ma), show signs of diversification during the Silurian and by the end of the Devonian Period most of the basic features of plants are apparent. During the Carboniferous Period terrestrial biomass became so high as to cause a fall in atmospheric carbon dioxide, triggering the longest period of glaciation of the Phanerozoic, and such a boost to oxygen in the air (to over 30%) that insects, huge by modern standards, were able to thrive and the risk of conflagration was perhaps at its highest in Earth’s history. Yet surprisingly, the first signs of massive forest fires appear in the Devonian when vegetation was nowhere near so widespread and luxuriant as it became in the Carboniferous (Kaiho, K. et al. 2013. A forest fire and soil erosion event during the Late Devonian mass extinction. Palaeogeography, Palaeoclimatology, Palaeoecology, v. 392, p. 272-280). Moreover, Devonian oxygen levels were well below those of the present atmosphere and CO2 was more than 10 times even the post-industrial concentration (387 parts per million in 2013). Such atmospheric chemistry would probably have suppressed burning.

Kunio Kaiho of Tohoku University in Japan and colleagues from Japan, the US and Belgium analysed organic molecules in Belgian marine sediments from the time of the late-Devonian mass extinction (around the Frasnian-Famennian boundary at 372 Ma). A range of compounds produced by hydrocarbon combustion show marked ‘spikes’ at the F-F boundary. The thin bed that marks the extinction boundary also shows sudden increase then decrease in δ13C and total organic carbon, indicative of increase burial of organic material and a likely increase in atmospheric oxygen levels. Another biomarker that is a proxy for soil erosion follows the other biogeochemical markers, perhaps signifying less of a binding effect on soil by plant colonisation: a likely consequence of large widlfires. Unlike the biomarkers, magnetic susceptibility of the boundary sediments is lower than in earlier and later sediments. This is ascribed to a decreased supply of detrital sediment to the Belgian marine Devonian basin, probably as a result of markedly decreased rainfall around the time of the late-Devonian mass extinction. But the magnetic data from 3 metres either side of the boundary also reveal the influence of the 20, 40, 100 and 405 ka Milankovich cycles.

Juan Ricardo Cortes , a placoderm from the Dev...
Dunkleosteus, a giant (10 m long) placoderm fish from the Devonian, which became extinct in the late Devonian along with all other placoderms (credit: Wikipedia)

This set of environmentally-related data encourages the authors to suggest a novel, if not entirely plausible, mechanism for mass extinction related to astronomically modulated dry-moist climate changes that repeatedly killed off vegetation so that dry woody matter could accumulate en masse during the Frasnian while atmospheric oxygen levels were too low for combustion. A mass burial of organic carbon at the end of that Age then boosted oxygen levels above the burning threshold to create widespread conflagration once the wood pile was set ablaze. Makes a change from continental flood basalts and extraterrestrial impacts… Yet it was about this time that vertebrates took it upon themselves to avail themselves of the new ecological niche provided by vegetation to haul themselves onto land.

Earth’s first major glacial epochs

The global glaciations of the Neoproterozoic that reached low latitudes – the so-called ‘Snowball Earth’ events have dominated accounts of ancient glaciations since the start of the 21st century. Yet they are not the oldest examples of large-scale effects of continental ice sheets. Distinctive tillites or diamictites that contain large clasts of diverse, exotic rocks occur in sedimentary sequences of Archaean and Palaeoproterozoic age.

Diamictite from the Palaoproterozoic Gowganda Formation in Ontario Canada (credit: Candian Sedimentology Research Group)
Diamictite from the Palaeoproterozoic Gowganda Formation in Ontario Canada (credit: Canadian Sedimentology Research Group)

This item can be read in full at Earth-logs in the Palaeoclimatology archive for 2013

The origins of the first Americans

Whatever controversies still linger about when they arrived in the Americas, there can be little doubt that humans crossed what are now the Bering Straits from NE Asia using the landmass of Beringia exposed by sea-level fall during the last ice age. Of course, there have been controversies too about who they were; probably of East Asian origin but the waters muddied by the celebrated case of 9300 year-old Kennewick Man whose skull bears close resemblance to those of modern Europeans but also to those of the Ainu of northern Japan. Genetic studies of Y-chromosome DNA suggested that all early Americans stemmed from 4 separate colonising populations who may have entered via Beringia by different routes (coastal and across the interior of North America) and at different times. Now, perhaps unsurprisingly, a new kind of data seems set to stir things up immeasurably.

Sitting Bull, Red Cloud, Swift Bear, and Spott...
Famous Lacotans of the Dakotas (credit: Wikipedia)

After the triumphs of reconstruction of the Neanderthal and Denisovan genomes and the corollary that both interbred with anatomically modern humans, it was only a matter of time before the palaeogenetics of humans would be pushed back in time. The oldest remains to yield DNA are those of a boy from near Lake Baikal in Siberia excavated by Soviet archaeologists along with a rich trove of cultural remains, including female effigies. Such figurines are rare in Siberia, most being known from western Eurasia. Radiocarbon dating of the bones gave an age of around 24 ka, just before the last glacial maximum. The genetic information, specifically mtDNA and Y-chromosome DNA are potentially revolutionary (Raghavaan and 30 others 2013. Upper Palaeolithic Siberian genome reveals dual ancestry of Native Americans. Nature online doi:10.1038/nature12736).

The mtDNA (passed down the female line) places the individual in haplogroup U, but with little relation to living members with that ‘signature’. Modern haplogroup U is mainly confined to people now living in North Africa, the Middle East, south and central Asia, Europe and western Siberia up to the area where the skeleton was found but rare further to the northeast. The male-specific Y-chromosome DNA is related to haplogroup R widely spread today among men living in western Eurasia, south Asian and in the vicinity of the find. When the data were subject to statistical tests routinely used in distinguishing existing p[populations and lineages within them (principal component analysis) a surprise emerged. The boy plots separately from all living populations but halfway between modern Europeans and the genetic trend of native Americans: i.e. descendants from the population to which he belonged could have evolved towards both extant groups but certainly not to East Asians. Plotted on a map, the degree of shared genetic history of the ice-age south Siberian boy to modern humans shows links westward to Europeans and eastwards to northeastern Siberians and hence to native Americans.  Up to 38% of native American ancestry may have originated by gene flow from the population to which the boy belonged, similarly for Europeans as a whole.

The research helps explain traces of European genetic ‘signatures’ in native Americans rather than the commonly held view that this resulted from post-Columbian admixture with European invaders. It also links with the European-looking skulls of a number of early Americans which do not resemble those of East Asians once thought to be their forebears.

A glimpse of early Martian crust

That planetary scientists are eager for chemical information about the rocks of planet Mars is probably unnecessary information, a vast amount of money having been spend to get three spindly vehicles equipped with miniaturized petrographic instruments onto the Martian surface. Meteoriticists might say, ‘Well, we already have some Mars rock in our lab, and we can collect some more from deserts or ablated blue ice in Antarctica’. Four classes of meteorites are alleged to have been flung from Mars by impacts: the allegation is supported by the materials having oxygen isotope proportions that are different from those in rocks from the Earth or Moon.

Another class of meteorite has joined the Martian family, and it it’s a doozy. Found in the northwestern Sahara Desert the rock is a breccia containing a variety of rocks in the form of clasts (Humayun, M. and 10 others 2013. Origin and age of the earliest Martian crust from meteorite NWA7533. Nature  online doi:10.1038/nature12764). In fact four other meteorites looking much the same were found near NWA7533. The bulk of the material is impact melt rock, now devitrified. Some of the clasts are also melt fragments and spherules, while others are fine-grained basalts, broken crystals and, most exciting, coarser igneous rocks rich in alkali and plagioclase feldspar. Their rare-earth element contents, like those of the Earth’s average continental crust, show evidence of fractional crystallization, particularly the removal of plagioclase to produce a marked depletion in the element europium. Slowly cooled and evolved monzonites of this kind are candidates for Martian crustal material. Overall, the texture of the breccia meteorites closely resembles the material that coats the lunar surface – regolith – but it has been lithified rather than remaining a dust.

Meteorite NWA7533 showing a variety of clasts, including light-coloured monzonite (credit: Humayun et al. 2013; doi:10.1038/nature12764)

Highly evolved igneous rocks, broadly speaking those of granitic composition, are the most likely to contain the mineral zircon, and the monzonite clasts yielded five that the US-Australian-French team subjected to U-Pb dating. The results are astonishing. These zircons formed around 4425 Ma ago, in the first hundred million years of the planet’s evolution, at the same time – within statistical error – as did the earliest materials from Earth and the Moon. Other putative Martian meteorites have yielded evidence from their neodymium isotopes that the earliest event there was the formation of a magma ocean, much as postulated for the Earth-Moon system. The latter is widely regarded as having resulted from a mega impact of the proto-Earth with an object roughly the size of Mars. The Martian monzonites may well be products of fractionation from that magma, subsequently excavated and shattered by a series of later, lesser impacts. If it did come from Mars, NWA7533 probably represents part of the early, heavily cratered highlands of the southern hemisphere of that planet.

The four hemispheric views shown above have be...
Full-color global map showing the regions of Mars imaged by the Hubble telescope (credit: Wikipedia)

It will be a long time before rocks can be lifted from the actual surface of Mars and transported back to Earth, and meteorites with a Martian provenance are so rare, that one can foresee a lot of very frustrated planetary petrogeneticists in the near term and a great deal of field work on desert and ice-cap surfaces looking for similar lumps of far-flung regolith.

Evidence for comet impact in the Sahara Desert

The desert surface of the remote Sahara of SW Egypt and adjacent Libya is strewn with silica-rich glass over an area of up to 6500 km2.  Pale yellow in colour and translucent, the glass clearly attracted Pleistocene hunter gatherers who manufactured edged tools  from it. Pieces cut en cabouchon are also found in pharaonic jewellery, including an item found in the tomb of Tutankhamun. Evidence for its formation at very high temperature is the melting temperature of pure silica around 2000°C and the presence of baddeleyite, a breakdown product of zircon. The glass fragments are undoubtedly the product of shock heating of desert sand or the local Nubian Sandstone of Cretaceous age by some kind of extraterrestrial impact. Fission-track dating suggests the glass formed around 29 Ma ago. A possible source is a 30 km wide crater on the Gilf Kebir Plateau made famous by Michael Ondaatje’s novel The English Patient that was centered on Pleistocene rock art discovered at the Cave of Swimmers in the Nubian Sandstone.

Tutanhkamun pendant with Wadjet
Scarab cut from Libyan Desert Glass in a pendant from the tomb of Tutanhkamun (credit: Wikipedia)

Neither the crater nor the glass strewn field yields meteoritic material despite several expeditions but the platinum-group metal content of the glass indicates an impact origin. Some specimens include enigmatic, graphite-rich banding. However, recently a South African-French team studied a strange, irregular 30 g fragment picked up in 1996 by an Egyptian postgraduate student collecting samples from the strewn field. He discovered that the dark fragment contained diamond by using X-ray diffraction. The dominant element in the fragment is carbon with less than 5% silicates and the new study used a battery of geochemical tests that confirmed the presence of abundant tiny diamonds (Kramers, J.D. and 13 others 2013. Unique chemistry of a diamond bearing pebble from the Libyan Desert Glass strewn field, SW Egypt: Evidence for a shocked comet fragment. Earth and Planetary Science Letters, v. 382, p. 21-31).

Conceivably, the diamonds could have formed by shock metamorphism of a coal seam or other carbonaceous sediments at the site of an impact – the K-T boundary layer formed by the huge Chicxulub impact contains nano-diamonds. However none of the chemical characteristics, including noble gas isotopic proportions and those of carbon, match terrestrial organic matter. Nor do they match carbonaceous chondrite meteorites that could have been another potential source, in its case an impactor of that composition. Instead, much evidence suggests the fragment is chemically akin to interplanetary dust and dust from the coma of comet 81P/Wild2 captured by NASDA’s Stardust mission in 2004. A plausible explanation, therefore, for the glass strewn field is an airburst explosion of a comet nucleus above the Sahara, the particle being a shocked fragment of the comet itself.

Could volcanism have spread organisms?

Recently there have been worrying accounts about pathogens, for instance the viruses that cause foot and mouth disease in livestock, flu in humans and other animals and the sheep disease bluetongue carried by tiny midges, being transported for thousands of kilometres in dust storms.  They raise the question of whether or not in the past organisms small enough to be carried by winds in aerosol suspension might have helped colonise regions distant from where they evolved.

The Taupo eruption's three main vents ran para...
The 600 square kilometre caldera lake of Taupo on New Zealand’s North Island. (Photo credit: Wikipedia)

Studies of volcanic ash thought to have been transported at high latitudes in the Southern Hemisphere from a 25 thousand-year old major volcanic eruption on the North Island of New Zealand add volcanic activity to violent meteorological phenomena as a possible means of transport (Van Eaton, A.R. et al. 2013. High-flying diatoms: Widespread dispersal of microorganisms in an explosive volcanic eruption. Geology, v. 41, p. 1187-1190). Ash from as far as 850 km from the volcano turns out to incorporate abundant remains of diatoms – species of algae that secrete distinctively intricate skeletons made from silica. The volcano, Taupo, erupted from beneath a lake bed, explaining the diatoms’ origin from lake muds and the water column itself. Even details of the organisms’ soft parts and pigmentation are preserved in the ash, suggesting that at least some of them might have been transported alive. Astonishingly, the New Zealand authors’ counts of organic material in the ash suggest that as much as 0.6 km3 of diatom remains were dispersed during the eruption.

English: Circle of diatoms on a slide
Assorted species of diatoms on a microscope slide (credit: Wikipedia)

Violent sub-aqueous eruptions can entrain liquid water as spray as well as water vapour and glassy magma shards, carrying the mixture into the stratosphere, far above wind belts in the lower atmosphere. At such altitudes transport can spread fine aerosols through an entire hemisphere because they remain in suspension for long periods.

Different species of diatom live in subtly different environments, so that their relative proportions and presence or absence in ash provide a ‘fingerprint’ for the volcano responsible. So the discovery by the team from the Victoria University of Wellington (a ‘first’) presents a new tool for identifying the source of ash layers in the volcanic record that came from  other volcanoes associated with caldera lakes – common for those capable of launching huge volumes of material aloft, such as Toba that erupted in Sumatra at around 74 ka and may have influenced the first modern human migrants from Africa. But could minute organisms survive both the volcanic heat and blast and a traverse through the dry stratosphere to result in colonisation? If that were possible it would have significant implications for the spread of early life forms during the far more volcanically active Hadean and Archaean Eons of Earth’s history.

Commenting on the article, Jennifer Pike of Cardiff University, UK (Pike, J. 2013. Of volcanoes and diatoms. Geology, v. 41, p. 1199-2000) surmises that diatoms might survive drying out in the stratosphere, provided they were in the form of spores encased in silica. Such spores were not found in the Taupo ash, but who is to say that they will not be discovered in other ancient volcanic ash layers? Spores are extremely durable and other micro-organisms than diatoms produce them and have done in the past.

An iconic early human skull

The earliest known human fossils outside of Africa were found at a site near Dmanisi in Georgia, between 1991 and 2005, following the discovery there in 1984 of primitive stone tools together with early Pleistocene animal bones. The Dmanisi finds occur with those of sabre-toothed cats and giant cheetahs, and so are probably not interments or in some kind of dwelling but were probably dragged into an underground carnivore den.

The five Dmanisi skulls of Homo erectus georgicus (credits; M.S. Ponce de Leon & P.E. Zollkofer, University of Zurich)

Initially the remains were assigned to a new species – Homo georgicus – but are now believed to be a subspecies of H. erectus. The finds are anatomically rich, with fossils of at least 5 individuals, both male and female, including 5 well-preserved skulls.  Analysing them has been a long process. Details of the best preserved, indeed the most complete early Homo skull ever found, have taken 8 years since its discovery in 2005 to reach publication (Lordkipanidze, D.  et al. 2013. A complete skull from Dmanisi, Georgia, and the evolutionary biology of early Homo. Science, v. 342, p. 326-331, DOI: 10.1126/science.1238484).

To the surprise of palaeoanthropologists, this specimen of Homo erectus georgicus has some ape-like features, including a protruding upper jaw in a relatively large face that most resembles the oldest African H. habilis, from Ethiopia, dated at 2.3 Ma. With a braincase of 546 cm3, the skull is on the small side of H. habilis and in the range of late australopithecines. Yet, like the much younger Homo floresiensis – dubbed ‘the Hobbit’ – the association with tools, of the most basic Oldowan type,  places it a cut above non-human hominins. The rest of the skeletal fossils show individuals with modern human proportions, albeit somewhat diminutive.

Surprises multiplied when comparative studies of all 5 skulls were complete. They are so different that, if found in widely separated specimens, would be placed in different species by most anatomists. Ruling out the chance association of several human species far from their Africa origins – few would suggest that up to 5 species left Africa at the same time and stuck together – a suggested explanation is that they represent a population of a human lineage in the process of evolving to a new species. The strength of this hypothesis contradicts the other recent view that several human species may have cohabited environments at different times. It also seems to throw into question the adoption of the name H. erectus for later human populations in both Africa and Eurasia: unless, as the authors tentatively suggest, there was genetic continuity and connectivity over large distances between both evolving populations

An early oxygenated atmosphere

The Earth’s earliest atmosphere undoubtedly had a chemistry dominated by carbon dioxide and nitrogen, together with transient water vapour, outgassed from volcanoes giving pervasive reducing conditions at the surface and in the oceans. Until the last couple of decades the only clear evidence of a switch to oxidising conditions and presumably significant atmospheric oxygen was direct, mineralogical evidence. The most obvious signs are ancient, reddened soils formed when soluble Fe2+ lost electrons to molecular oxygen to form the distinct red, orange and brown oxides and hydroxides of insoluble Fe3+ that impart a deep staining in even small quantities. Others include the disappearance from river-transported sediments of clearly transported grains of metal sulfides and uranium oxide that remain stable under reducing conditions but quickly break down in the presence of oxygen.

Widespread observations in Precambrian sediments, eventually linked with reliable radiometric ages, strongly suggested a fundamental environmental change at around 2.3 billion years ago: the Great Oxidation Event. A few such signs emerge from somewhat older rocks back to 2.7 Ga, but only the 2.3 Ga event created a permanent feature of our home world; at first toxic to many of the prokaryote life forms of earlier times but eventually a prime condition for the rise of the Eukarya and eventually metazoan animals. Isotopic analysis of sulfur from Precambrian sediments also gave hints of a more complex but much debated transition because of the way S-isotopes fractionate under different environmental conditions. Now other  indirect, isotopic approaches to redox conditions have become feasible, with a surprising result: powerful evidence that about 3 billion years ago there was appreciable atmospheric oxygen (Crowe, S.A. et al. 2013. Atmospheric oxygenation three billion years ago. Nature, v. 501, p. 535-538).

The Danish-South African-German-Canadian group relied on a fractionation process among the isotopes of chromium, which can exist in several oxidation states. When minerals that contain Cr3+  are weathered under oxidising conditions to release soluble Cr6+ the loss in solution preferentially removes the 53Cr isotope from residual soil. If the isotope enters groundwater with reducing conditions to precipitate some Cr3+ -rich material yet more 53Cr remains in solution. Eventually such enriched water may enter the oceans, where along with iron and other transition-group metal ions chromium can end up in banded iron formations (BIFs) to preserve isotopic evidence for oxidising conditions along it route from land to sea.

This image shows a 2.1 billion years old rock ...
Banded iron formation (BIF) from the Precambrian of North America belonging to the National Museum of Mineralogy and Geology in Dresden, Germany. (credit: Wikipedia)

The team analysed both a palaeosol and a BIF unit from a stratigraphic sequence in the Achaean of NE South Africa that is between 2980 and 2924 Ma old. A substantial proportion of the palaeosol is depleted in 53Cr whereas the lower part of the slightly younger BIF is significantly enriched. Changes in the concentration of redox sensitive elements, such as chromium itself, uranium and iron, in the two lithologies helps confirm the isotopic evidence for a major ~3 Ga oxidation event. It is possible to use the data to estimate what the atmospheric oxygen content might have been at that time: not enough to breathe, but significant at between 6 x 10­-5 to 3 x 10⁻³ the atmospheric level at present. Oxygen can be produced abiogenically through irradiation of water vapour in the atmosphere as well as by organic photosynthesis. However, the first route seems incapable of yield more than a billionth of present atmospheric concentrations, so the spotlight inevitably falls on a ‘much deep history’ of the action of blue-green bacteria (cyanobacteria) than hitherto suspected.

Tectonics of the early Earth

Tectonics on any rocky planet is an expression of the way heat is transferred from its deep interior to the surface to be lost by radiation to outer space. Radiative heat loss is vastly more efficient than either conduction or convection since the power emitted by a body is proportion to the fourth power of its absolute temperature. Unless it is superheated from outside by its star, a planet cannot stay molten at its surface for long because cooling by radiation releases all of the heat that makes its way to the surface.  Any football supporter who has rushed to get a microwaved pie at half time will have learned this quickly: a cool crust can hide a damagingly hot centre.

Thermal power is delivered to a planet’s surface by convection deep down and conduction nearer the surface because rocks, both solid and molten, are almost opaque to radiation. The vigour of the outward flow of heat might seem to be related mainly to the amount of internal heat but it is also governed by limits imposed by temperature on the form of convection. Of the Inner Planets only Earth shows surface signs of deep convection in the form of plate tectonics driven mainly by the pull exerted by steep subduction of cool, dense slabs of old oceanic lithosphere. Only Jupiter’s moon Io shows comparable surface signs of inner dynamics, but in the form of immense volcanoes rather than lateral movements of slabs. Io has about 40 times the surface heat flow of Earth, thanks largely to huge tidal forces imposed by Jupiter. So it seems that a different mode of convection is needed to shift the tidal heat production; similar in many ways to Earth’s relatively puny and isolated hot spots and mantle plumes.

Most of the yellow and orange hues of Io are d...
An analogy for the early Earth, Jupiter’s moon Io is speckled with large active volcanoes; signs of vigorous internal heat transport but not of plate tectonics. Its colour is dominated by various forms of sulfur rather than mafic igneous rocks. (credit: Wikipedia)

Shortly after Earth’s accretion it would have contained far more heat than now: gravitational energy of accretion itself; greater tidal heating from a close Moon and up to five times more from internal radioactive decay. The time at which plate tectonics can be deduced from evidence in ancient rocks has been disputed since the 1970s, but now an approach inspired by Io’s behaviour approaches the issue from the opposite direction: what might have been the mode of Earth’s heat transport shortly after accretion (Moore, W.B. & Webb, A.A.G. 2013. Heat-pipe Earth. Nature, v.  501, p. 501-505). The two American geophysicists modelled Rayleigh-Bénard convection – multicelled convection akin to that of the ‘heat pipes’ inside Io – for a range of possible thermal conditions in the Hadean. The modelled planet, dominated by volcanic centres turned out to have some surprising properties.

The sheer efficiency of heat-pipe dominated heat transfer and radiative heat lost results in development of a thick cold lithosphere between the pipes, that advects surface material downwards. Decreasing the heat sources results in a ‘flip’ to convection very like plate tectonics. In itself, this notion of sudden shift from Rayleigh-Bénard convection to plate tectonics is not new – several Archaean specialists, including me, debated this in the late 1970s – but the convincing modelling is. The authors also assemble a plausible list of evidence for it from the Archaean geological record: the presence in pre- 3.2 Ga greenstone belts of abundant ultramafic lavas marking high fractions of mantle melting; the dome-trough structure of granite-greenstone terrains; granitic magmas formed by melting of wet mafic rocks at around 45 km depth, extending back to second-hand evidence from Hadean zircons preserved in much younger rocks. They dwell on the oldest sizeable terranes in West Greenland (the Itsaq gneiss complex), South Africa and Western Australia (Barberton and the Pilbara) as a plausible and tangible products of ‘heat-pipe’ tectonics. They suggest that the transition to plate-tectonic dominance was around 3.2 Ga, yet ‘heat pipes’ remain to the present in the form of plumes so nicely defined in the preceding item Mantle structures beneath the central Pacific.

Mantle structures beneath the central Pacific

Since it first figured in Earth Pages 13 years ago seismic tomography has advanced steadily as regards the detail that can be shown and the level of confidence in its accuracy: in the early days some geoscientists considered the results to be verging on the imaginary. There were indeed deficiencies, one being that a mantle plume which everyone believed to be present beneath Hawaii didn’t show up on the first tomographic section through the central Pacific. Plumes are one of the forms likely to be taken by mantle heat convection, and many now believe that some of them emerge from great depths in the mantle, perhaps at its interface with the outer core.

The improvements in imaging deep structure stem mainly from increasingly sophisticated software and faster computers, the data being fed in being historic seismograph records from around the globe. The approach seeks out deviations in the speed of seismic waves from the mean at different depths beneath the Earth’s surface. Decreases suggest lower strength and therefore hotter rocks while abnormally high speeds signify strong, cool parts of the mantle. The hotter mantle rock is the lower its density and the more likely it is to be rising, and vice versa.

Using state-of-the-art tomography to probe beneath the central Pacific is a natural strategy as the region contains a greater concentration of hot-spot related volcanic island chains than anywhere else and that is the focus of a US-French group of collaborators (French, S. et al. 2013. Waveform tomography reveals channeled flow at the base of the oceanic lithosphere. Science, v. 342, 227-230;  doi 10.1126/science.1241514). The authors first note the appearance on 2-D global maps for a depth of 250 km of elongate zones of low shear-strength mantle that approximately parallel the known directions of local absolute plate movement. The most clear of these occur beneath the Pacific hemisphere, strongly suggesting some kind of channelling of hot material by convection away from the East Pacific Rise.

Seismic tomograhic model of the mantle beneath the central Pacific. Yellow to red colours represent increasing low shear strength. (credit: Global Seismology Group / Berkeley Seismological Laboratory
Seismic tomographic model of the mantle beneath the central Pacific. Yellow to red colours represent increasingly low shear strength. (credit: Global Seismology Group / Berkeley Seismological Laboratory)

Visually it is the three-dimensional models of the Pacific hot-spot ‘swarm’ that grab attention. These show the low velocity zone of the asthenosphere at depths of around 50 to 100 km, as predicted but with odd convolutions. Down to 1000 km is a zone of complexity with limb-like lobes of warm, low-strength mantle concentrated beneath the main island chains. That beneath the Hawaiian hot spot definitely has a plume-like shape but one curiously bent at depth, turning to the NW as it emerges from even deeper mantle then taking a knee-like bend to the east . Those beneath the hot spots of the west Pacific are more irregular but almost vertical. Just what kind of process the peculiarities represent in detail is not known, but it is almost certainly a reflection of complex forms taken by convection in a highly viscous medium.

Pushing back DNA sequencing: a Spanish cave bear

At the time, only 3 years ago, publication of the first full Neanderthal genome  seemed miraculous. Yet the apparent magic proved repeatable, including for an obscure but distinct group of extinct humans – the  Denisovans – known only from their DNA in a single pinkie bone. These advances astonished the world by showing that anatomically modern humans were capable of interbreeding with both groups; and did so that many people now living outside of Africa carry the genetic evidence. But the samples analysed for DNA were little more than 40 thousand years old. Older fossils of extinct animals have given up their genetic features, such as the wooly mammoth and a horse about 700 ka old, but only from samples frozen into permafrost at high northern latitudes.

The degradation of DNA over time seemed destined to limit palaeo-genetics, even when slowed down by natural freezing. The degradation breaks down any surviving genetic material into shorter and shorter fragments of the DNA molecule, ultimately to its atoms being recombined in new molecules of totally unrelated compounds through the chemical processes of fossilisation. Reassembling the fragments correctly becomes increasingly difficult the smaller they are. Few outside of a highly skilled specialists were optimistic of breaking the 100 ka barrier, even using frozen fossils. Unsurprisingly, having had such dramatic successes, the specialists continue to ride their luck and their ingenuity.

Excavations at the site of Gran Dolina, in Ata...
Excavations at Gran Dolina, in Atapuerca, Spain. (Photo credit: Wikipedia)

The cave complex of the Atapuerca Mountains  in northern Spain, whose sediments range in age from almost a million years ago to recent times, contain rich accumulations of human remains, including the pre-Neanderthal Homo heidelbergensis and H. antecessor dating back to more than 800 ka. If ever there was a magnet for archaeo-geneticists Atapuerca is definitely one. Moreover, physical anthropologists seem never to stop disputing their interpretations. Jesse Dabney of the now famous Max Planck Institute for Evolutionary Anthropology in Leipzig, Germany, and co-workers from Britain, New Zealand, Spain and Australia are now beginning to report results. The first are from a cave bear (probably Ursos deningeri) known to be older than 300 ka (Dabney, J. and 10 others 2013. Complete mitochondrial genome sequence of a Middle Pleistocene cave bear reconstructed from ultrashort DNA fragments in one of its foreleg bones. Proceedings of the National Academy of Sciences, v. 110, doi/10.1073/pnas.1314445110). The bear’s mitochondrial DNA was pieced together from fragments as small as 50 base pairs, and shows its ancestry to bears (U. spelaeus) from the later Pleistocene that became extinct at about 28 ka.

reconstruction of a European cave bear (Ursus ...
Reconstruction of a European cave bear (Ursus spelaeus) (credit: Wikipedia)

It may be only a matter of time before human DNA emerges from the rich Atapuerca fossil hoard; indeed the authors strongly hint that they are working on that now.

The East African Orogen: Neoproterozoic tectonics on display

Over a period of about 300 Ma the fragmentation of a supercontinent, Rodinia, drove a round of sea-floor spreading and continental drift that culminated in reassembly of the older continental pieces and entirely new crust in a new supercontinent, Gondwana. The largest source of evidence for this remarkable tectonic turnaround is a belt stretching N-S for over 3000 km from southern Israel through East Africa to Mozambique. At its widest the belt exposes Neoproterozoic  rocks and structures for some 1700 km E-W from west of the Nile in northern Sudan almost to Riyadh in Saudi Arabia.  This Arabian-Nubian Shield tapers southwards to thin out completely in northern Tanzania between far older cratons and in a state of high-grade metamorphism.

This East African Orogen has long been considered the best exposed bowels of former mountain building that there are: results of continent-continent collision and the bulldozing together of many oceanic arcs and remnants of oceanic lithosphere that once separated the cratons. This was much more complex than a case of head-on tectonics, the northward-swelling Arabian-Nubian Shield showing all the signs of being like a gigantic ‘pip’ squeezed out northwards from two cratonic jaws during the last stages of what is often called the Pan African Orogeny. Interestingly, the line of the orogen is roughly followed by East Africa’s other giant feature, the Rift Valley; actually two of them following Pan African terranes. A continental scale anisotropy has been reactivated and subject to extensional tectonics, and maybe in future a new round of sea-floor spreading as has begun in the Red Sea, some half a billion years after it formed.

Simplified geological map of the East African Orogen courtesy of the authors of Fritz et al 2013

Now there is an opportunity for anyone to download and read a digest of East African orogenic processes compiled by researchers from several countries along the belt and their colleagues from North America, Europe and Australia who have been privileged to work in this vast area (Fritz, H and 13 others 2013. Orogen styles in the East African orogen: A review of the Neoproterozoic to Cambrian tectonic evolution. Journal of African Earth Sciences, v. 86, p. 65-106 Click on the link, scroll to the Open Access article to download the 12 Mb PDF version). The authors present superb simplified geological maps of each major part of the orogen, a vast array of references and well-written accounts of its sector-by-sector tectonic and metamorphic evolution, variations in style and broad tectonic setting.

Explosive erosion in the Himalaya

As the Yalung-Tsangpo River on the northern flank of the Himalaya approaches  a bend the rotates its flow by almost 180 degrees to become the Brahmaputra it enters one of the world’s largest canyons. Over the 200 km length of the Tsangpo Gorge the river descends two kilometres between peaks that tower 7 km above sea level. Since the area is rising tectonically and as a result of the unloading that attends erosion, for the Tsangpo to have maintained its eastward flow it has been suggested that an average erosion rate of 3 to 5 km per million years was maintained continuously over the last 3 to 5 Ma. However, new information from the sediments downstream of the gorge suggests that much of the gorge’s depth was cut during a series of sudden episodes (Lang, K.A. et al. 2013. Erosion of the Tsangpo Gorge by megafloods, Eastern Himalaya. Geology, v. 41, p. 1003-1006).

English: Map of the Yarlung Tsangpo River wate...
The Yarlung Tsangpo River watershed which drains the north slope of the Himalayas. (credit: Wikipedia)

It has become clear from a series of mountainside terraces that during the Pleistocene glaciers and debris from them often blocked the narrow valleys through which the river flowed along the northern flank of the Himalaya. Each blockage would have impounded enormous lakes upstream of the Tsangpo Gorge, containing up to 800 km3 of water. Failure of the natural dams would have unleashed equally spectacular floods. The researchers from the University of Washington in Seattle examined the valley downstream of the gorge, to find unconsolidated sediments as much as 150 m above the present channel. They have similar grain size distributions to flood deposits laid down some 30 m above the channel by a flood unleashed in 2000 by the failure of a temporary dam caused by a landslide. The difference is that the higher level deposits are densely vegetated and have well-developed soils: they are almost certainly relics of far larger floods in the distant past from the lakes betrayed by the terraces above the Tsangpo Gorge.

By measuring the age of zircons found in the megaflood deposits using the U/Pb methods the team  have been able to show that the sediments were derived mainly from 500 Ma crystalline basement in the Tsangpo Gorge itself rather than from the younger terranes in Tibet. There are four such deposits at separate elevations above the modern river below the gorge. Like the 2000 AD flood deposit, each terrace is capped by landslide debris suggesting that flooding and associated erosion destabilised the steep slopes so characteristic of the region. Because the valleys are so narrow (<200 m at the bottom), each flood would have been extremely deep, flows being of the order of a million cubic metres per second. The huge power would have been capable of moving blocks up to 18 m across with 1 m boulders being carried in suspension. It has been estimated that each of the floods would have been capable of removing material that would otherwise have taken up to 4000 years to erode at present rates of flow.

Electricity from ‘black smokers’

English: Black smoker at a mid-ocean ridge hyd...
Hydrothermal vent at the mid-Atlantic Ridge (credit: Wikipedia)

Occasionally, journals not usually associated with mainstream geosciences publish something startling, but easily missed. Nature of 12 September 2013 alerted me to just such an oddity. It seems that the chemistry of sea-floor hydrothermal vents potentially can generate electrical power (Yamamoto, M. et al. 2013. Generation of electricity and illumination by an environmental fuel cell in deep-sea hydrothermal vents. Angewandte Chemie, online DOI: 10.1002/ange.201302704).

The team from the Japan Agency for Marine-Earth Science and Technology, the Riken Centre for Sustainable Resource Science and the University of Tokyo used a submersible ROV to suspend a fuel cell based on a platinum cathode and iridium anode in hydrothermal vents that emerge from the Okinawa Trough off southern Japan at a depth of over 1 km. It recorded a tiny, but significant power generation of a few milliwatts.

The fluids issuing from the vents are at over 300°C while seawater is around 4°C, creating a very high thermal gradient. More importantly, the fluid-seawater interface is also a boundary between geochemically very different conditions. The fluids are highly acidic (pH 4.8) compared with the slight alkalinity of seawater, and contain high concentrations of hydrogen and hydrogen sulfide but undetectable oxygen (sea water is slightly oxygenated).

The fuel cell was designed so that iridium in the anode speeds up the oxidation of H2S at the geochemical interface which yields the electrons necessary in electrical currents. The experiment neatly signified its success by lighting up three light-emitting diodes.

Does this herald entirely new means of renewable power generation? Perhaps, if the fuel cell is scaled-up enormously. Yet, the very basis of oxidation and reduction is expressed by the mnemonic OILRIG (Oxidation Is Loss Reduction Is Gain – of electrons) and any potential redox reaction in nature has potential, even plants can be electricity producers. In fact all fuel cells exploit oxidation reactions of one kind or another.

Estimating arsenic risks in China

Two weeks after Earth pages featured arsenic in groundwater below the Mekong Delta another important paper has emerged about modelling risk of arsenic contamination throughout the People’s Republic of China (Rodriguez-Lado, L. et al. 2013. Groundwater arsenic contamination throughout China. Science, v. 341, p. 866-868). Scientists based in the Swiss Federal Institute of Aquatic Science and technology and the China Medical University follow up the results of geochemical testing of groundwater from almost 450 thousand wells in 12% of China’s counties; part of a nationwide aim to test millions of wells. That is a programme likely to last for decades, and their work seeks to develop a predictive model that might better focus such an enormous effort and help in other large regions where well sampling is not so advanced.

As well as the well-known release of arsenic-containing ions through the dissolution of iron oxy-hydroxides in aquifers that exhibit reducing conditions, aridity that causes surface evaporation can create alkaline conditions in groundwater that also desorbs arsenic from similar minerals. The early results from China suggested 16 environmental  factors available in digital map form, mainly geological, topographic and hydrogeochemical, that possibly encourage contamination; a clear indication of the sheer complexity of the problem.  Using GIS techniques these possible proxies were narrowed down to 8 that show significant correlation with arsenic levels above the WHO suggested maximum tolerable concentration of 10 micrograms per litre (10 parts per billion by volume). Geology (Holocene sediments are most likely sources), the texture of soils and their salinity, the potential wetness of soils predicted from topography and the density of surface streams carrying arsenic correlate positively with high well-water contamination, whereas slope, distance from streams and gravity (a measure of depth of sedimentary basins) show a negative correlation. These parameters form the basis for the predictive model and more than 2500 new arsenic measurements were used to validate the results of the analysis.

Estimated probability of arsenic in Chinese groundwater above the WHO acceptable maximum concentration (Credit:Rodriguez-Lado, et al. 2013)

The results graphically highlight possible high risk areas, mainly in the northern Chinese provinces that are partly confirmed by the validation. Using estimated variations in population density across the country the team discovered that as many as 19.6 million people may be affected by consumption of arsenic contaminated water. In fact if groundwater is used for irrigation, arsenic may also be ingested with locally grown food. It seems that the vast majority of Chinese people live outside the areas of risk, so that mitigating risk is likely to be more manageable that it is in Bangladesh and West Bengal.

As well as being an important input to environmental health management in the PRC the approach is appropriate for other large areas where direct water monitoring is less organised, such as Mongolia, Kazakhstan and Kyrgyzstan in central Asia, and in the arid regions of South America.

The Grand Greenland Canyon

One of the properties of radar is that it can pass through hundreds of metres of ice to be scattered by the bedrock beneath and return to the surface with sufficient remaining power to allow measurement of ice depth from the time between transmission of a pulse and that when the scattered energy returns to the antenna. Liquid water simply absorbs the radar energy preventing any return from the subsurface. As far as rocks and soils are concerned, any water in them and the structure of minerals from which they are composed limit penetration and energy return to at most only a few metres. While radar images that result from scattering by the Earth’s solid surface are highly informative about landforms and variations in the surface’s small-scale texture, outside of seismic reflection profiling, only ice-penetrating radar (IPR) approaches the ‘holy grail’ of mapping what lies beneath the surface in 3-D. Unlike seismic surveys it can be achieved from aircraft and is far cheaper to conduct.

English: Topographic map of Greenland bedrock,...
Greenland’s topography without the ice sheet. (Photo credit: Wikipedia)

It was IPR that revealed the scattering of large lakes at the base of the Antarctic ice cap, but a survey of Greenland has revealed something even more astonishing: major drainage systems. These include a vast canyon that meanders beneath the thickest part of the ice towards the island’s north coast (Bamber, J.L. et al. 2013. Palaeofluvial mega-canyon beneath the central Greenland ice sheet. Science, v. 341, p. 997-999). At 750 km long and a maximum depth of 800 m it is comparable with active canyon systems along the Colorado and Nile rivers in the western US and Ethiopia respectively. A less-well publicised feature is ancient leaf-shaped system of buried valleys further south that emerges in a great embayment on West Greenland’s coast near Uummannaq, which may be the catchment of another former river system. In fact much of the data that revealed what appears to be pre-glacial topography dates back to the 1970s, though most was acquired since 2000. The coverage by flight lines varies a great deal, and as more flights are conducted, yet more detail will emerge.

The British, Canadian and Italian discoverers consider that glacial meltwater sinking to the base of the ice cap continues to follow the canyon, perhaps lubricating ice movement. The flatter topography beneath the Antarctic ice cap is not so easy to drain, which probably accounts for the many sub-glacial lakes there whereas none of any significance have been detected in Greenland. The earliest time when Greenland became ice-bound was about 5 Ma ago, so that is the minimum age for the river erosion that carved the canyon

New approach to the Milankovitch mystery

Melting pond on the ice sheet
Melting pond on the Greenland ice sheet (credit: Photo by Leif Taurer)

Milutin Milankovitch’s astronomical theory to account for glacial – interglacial cycles is based on 3 gravitational influences on the Earth that change the way it spins and orbits the Sun. Each is cyclic but with different periods: the angle of axial tilt every 41 ka; precession of its rotation axis on a 23 ka pacing; the change in shape of the orbit around the Sun over 100 ka. Each subtly affects the amount of solar energy, their influences combining to produce a seemingly complex, but predictable variation through time of solar heating for any point on the Earth’s surface. Milankovitch’s work was triumphantly confirmed when analysis of oxygen-isotope time series from sea-floor sediments revealed precisely these periods in the record of continental ice cover. Specifically, astronomical pacing of midsummer insolation at 65°N matches the real climatic pattern through time.

Yet the periods between glacial maxima have not stayed constant over the last 2 Ma or so (Figure showing Phanerozoic climate changes). About 0.8 to 1 Ma ago a sequence with roughly 41 ka spacing was replaced by another about every 100 ka, i.e. both overall climate periods matched one of the astronomical forcings. What is a puzzle is that the current periodicity seems to follow the very weakest influence in energy terms; that from orbital eccentricity. The energy shifts from changes in orbit shape are, in fact, far too weak to drive the accumulation and eventual melting of ice sheets on land. Climatologists have suggested a variety of processes that might be paced by eccentricity but which act to amplify is climatic ‘signal’. None have been especially convincing.

In an attempt to resolve the mystery Ayako Abe-Ouchi of the University of Tokyo and Japanese, US and Swiss colleagues linked a climate model driven by Milankovitch insolation and variations in CO2 recorded in an Antarctic ice core with a model of how land-ice forms and interacts with the underlying lithosphere (Abe-Ouchi, A. et  al. 2013. Insolation-driven 100,000-year glacial cycles and hysteresis of ice-sheet volume. Nature, v. 500, p. 190-193).

CLIMAP map of ice sheets, sea temperature chan...
Map of ice sheets, sea temperature changes, and changes in the outline of coastal regions during the last glacial maximum. (credit: Wikipedia)

Their key discovery is that the ice-sheets that repeatedly formed on the Canadian Shield and extended further south than Chicago had such a huge mass that they changed the shape of the land surface beneath them so much it had an effect on climate as a whole. The reason for this is that glacial loading forces the lithosphere down by displacing the more ductile asthenosphere sideways. But when melting begins rebound of the rock surface lags a long time behind the shrinking ice volume – well displayed today in Britain and Scandinavia by continued rise of the land to form raised beaches. In the case of the North American ice sheet, what had become an enormous ice bulge at glacial maxima developed into a huge basin up to 1 km deep as the ice began to melt. Simply by virtue of its low elevation this sub-continental basin would have warmed up more and more rapidly as the ice-surface fell because of this ‘isostatic’ lag.

Another feature to emerge from the model was the interaction between the 100 ka eccentricity ‘signal’ and that of precession at 23 ka. For long periods that kept summer temperature low enough for snow to pile up and become glacial ice, but on a roughly 100 ka time scale both acted together to increase summer temperatures at high northern latitudes. Melting that instantaneously removed some ice load each summer brought into play the sluggish isostatic  response that helped even more warming the following year. As well as convincingly accounting for the 100 ka mystery, the model explains the far more rapid deglaciations in that mode than in the preceding 41 ka cycles, which were almost symmetrical compared with the more recent slow accumulation of continental ice sheets over ~90 ka followed by almost complete melting in a mere 10 ka.

If true, the model seems to imply that before 800 ka the positions, thicknesses and extents of continental ice sheets were different from those in later times. Or perhaps it reflects a steady increase in the overall volume of ice being produced over northern North America, or that glacial erosion thinned the crust until changing isostatic influences could ‘trip’ sufficient additional warming.

Yet another risk of arsenic exposure

The most widely feared risk of poisoning through natural causes, which grossly disfigures and kills through a range of cancers, is from chronic exposure to arsenic in drinking water. Tragically, the risk is highest from what has traditionally been considered safest source, groundwater. That was the gruesome lesson of a massive transfer in Bangladesh from drinking surface water containing organic pathogens to reliance on well waters. The greatest mass poisoning in history was eventually traced to shallow aquifers in the Ganges-Brahmaputra plains that were rich in organic matter. Their reducing chemistry broke down iron hydroxide coatings on sedimentary grains. Since these minerals are among the most accommodating adsorbers of ions from the environment, including a variety of arsenic-bearing ions, their dissolution releases potential poisons from otherwise safe storage. In Bangladesh and neighbouring West Bengal in India it was found that deeper aquifers have oxidising chemistry and so the iron minerals not only hold ionic pollutants fast by adsorption but help to extract them from groundwater. Deep wells together with various kinds of treatment of shallow groundwater, some using the very iron minerals whose breakdown caused the pollution, are helping to mitigate the perilous situation for people of South Asia.

Skin lesions from arsenic poisoning in Bangladesh
Skin lesions (keratoses) from arsenic poisoning in Bangladesh (Photo credit: waterdotorg)

Much the same kind of arsenic pollution has subsequently been revealed in groundwaters of lowland Vietnam and Cambodia. Yet the turn there to deep groundwater has revealed a new twist. That too is yielding increasingly high arsenic concentrations, but for a different reason (Erband, L.E. et al. 2013. Release of arsenic to deep groundwater in the Mekong Delta, Vietnam, linked to pumping-induced land subsidence. Proceedings of the National Academy of Science, doi/10.1073/pnas.1300503110). Scientists from Stanford University, California analysed waters from around 900 wells in the Lower Mekong Delta and found several tracts with arsenic contents well above levels deemed safe by the WHO. Some, as could be anticipated from South Asian studies, were from shallow wells along the present course of the Mekong. However, in the delta area to the southwest of Ho Chi Minh City (formerly Saigon) is a large cluster from wells 150 to 450 m deep, totally unlike the situation in other areas of thick Pliocene to Recent river sedimentation.

Comparing the distribution of affected wells with precise estimates of the subsidence rates of the land surface from orbital interferometric radar surveys shows a close correlation of arsenic contamination with rates of subsidence. This suggests that groundwater pumping from deep aquifers is causing compaction at depth, in much the same way as in the environs of Venice. But is this somehow drawing in arsenic polluted water from higher levels? It seems not. So the pollution seems most likely to be an effect of pumping itself. The authors suggest that most of the subsidence is due to compaction of clay-rich sediments rather than the sandy aquifers, well known by engineers to resist compression. They explain the increasing arsenic concentrations by the introduction into the aquifers of water expelled from the clays, either containing arsenic ions in solution or carrying organic compounds that create the reducing conditions to break down iron hydroxide grain coatings and release ions adsorbed on their surfaces.

This presents another grim prospect for South Asian people forced to make the choice between drinking polluted surface water and enteric disease and increasingly exploited deep groundwaters that seem to be safe as well as in very high volumes. Let’s hope that arsenic monitoring can be maintained in the Ganges-Brahmaputra plains in the long term.

Last common paternal and maternal ancestors closer in time

One of the oddities of using human genetic material passed down the male (from Y chromosomes) and female lines (from mitochondria) to assess when fully modern humans originated is that they have hitherto given widely different dates: 50 to 115 ka and 150 to 240 ka respectively. Twice to three-times the age for a putative ancestral ‘mother’ compared with such a ‘father’ for humanity raised all kinds of problematic issues for palaeoanthropology, such as a possibly greater ‘turnover’ of lines of descent among males perhaps due to riskier lifestyles. Y-chromosome data  limited speculation on the timing of human colonisation outside of Africa to a maximum of 60 ka, even though there is fossil and archaeological evidence for a much earlier presence in the Levant and India.  The difference also questions the validity of molecular-clock approaches to evolutionary matters. Two new studies have lessened the phylogenetic  strains.

One examines Y chromosomes in 69 males from nine diverse populations from Africa, Eurasia and Central America (Poznik, G.D.  and 10 others 2013. Sequencing Y chromosomes resolves discrepancy in time to common ancestors of males versus females. Science, v. 341, p. 562-565). The US-French team applied sophisticated statistics as well as the elements of a molecular clock approach to both Y-chromosome and mitochondrial DNA, discovering in the process a hitherto unresolved feature in the African part of the male ‘tree’. The outcome is a significant revision of both male and female paths of descent: 120 to 156 ka and 99 to 148 ka to the last common ancestor in both lines. The upper limit is somewhat lower than the age of fossil evidence for the earliest anatomically modern humans.

The second study zeros-in on the European story, by examining the Y-chromosome data of 1200 men from Sardinia (Francalacci, P. and 38 others. Low-pass DNA sequencing of 1200 Sardinians reconstructs European Y-chromosome phylogeny. Science, v. 341, p. 565-569) calibrated to some extent by the date when Sardinia was first colonised (7.7 ka). It too revealed new detail that enabled the Italian-US-Spanish team to refine the time when features of Sardinian Y-chromosome DNA would coalesce with those from the rest of the world. In this case the date for a last common paternal ancestor goes back to between 180 to 200 ka, more similar to the old dates for ‘African Eve’ and the earliest modern human fossils than to either that for male or female lines arrived at by Posnik et al. (2013), which are significantly younger.

Map of early migrations of modern humans
Map of early migrations of modern humans based on Y chromsome data (credit: Wikipedia)

Equally interesting are the comments on both papers in the Perspectives section of the issue of science in which they appear (Cann, R.L. 2013. Y weigh in again on modern humans. Science, v. 341, p. 465-7).Rebecca Cann of the University of Hawaii Manoa considers the two sets of results from Y-chromosomes potentially capable of refining models for the migration times of modern humans out of Africa and their interactions with the archaic populations that they eventually displaced from Europe and central and southern Asia (Neanderthals, Denisovans and Homo erectus respectively). She believes that will include signs of earlier excursions that the generally accepted diaspora between roughly 60 and 50 ka seemingly constrained by the previous 50 to 115 ka estimate for the last common paternal ancestor. That would help explain the presence of modern humans in India at the time of the Toba eruption (71 ka).

Assessing submarine great-earthquake statistics fails

Geologists who study turbidites assume that the distinctive graded beds from which they are constructed and a range of other textures represent flows of slurry down unstable steep slopes when submarine sediment deposits are displaced. Such turbidity currents were famously recorded by the severing of 12 transatlantic telecommunication cables off Newfoundland in 1929. This happened soon after an earthquake triggered 100 km hr-1 flows down the continental slope, which swept some 600 km eastwards.

Load structures on turbidite sandstones, Crook...
Typical structures in Upper Carboniferous turbidites near Bude, Cornwall, UK (credit: Flickr, Earthwatcher)

Sea beds at destructive margins provide the right conditions for repeated turbidity currents and it is reasonable to suppose that patterns should emerge from the resulting turbidite beds that in some way record the seismic history of the area. British and Indonesian geoscientists set out to test that hypothesis at the now infamous plate margin off Sumatra that hosted the great Acheh Earthquake and tsunamis of 26 December 2004 to kill 250 thousand people around the rim of the Indian Ocean (Sumner, E.J. et al. 2013. Can turbidites be used to reconstruct a paleoearthquake record for the central Sumatra margin? Geology, v. 41, p.763-766).

Animation of 2004 Indonesia tsunami
Animation of Indonesian tsunami of 26 December 2004 (credit: Wikipedia)

Cores through turbidite sequences along a 500 km stretch of the margin formed the basis for this important attempt to test the possibility of recording long-term seismic statistics. To avoid false signals from turbidity currents stirred up by storms, floods and slope failure from rapid sediment build-up 17 sites were cored in deep water away from major terrestrial sediment supplies, which only flows triggered by major earthquakes would be likely to reach. To calibrate core depth to time involved a variety of radiometric  and stratigraphic methods

Disappointingly, few of the sites on the submarine slopes recorded turbidites that match events during the 150-year period of seismic records in the area, none being correlatable with the 2004 and 2005 great earthquakes. Indeed very little correlation of distinctive textures from site to site emerged from the study. Some sites on slopes revealed no turbidites at all from the last 150 years, whereas turbidites in others that could be accurately dated occurred when there were no large earthquakes. Only cores from the deep submarine trench consistently preserved near-surface turbidites that might record the 2004 and 2005 great earthquakes.

These are surprising as well as depressing results, but perhaps further coring will discover what kind of bathymetric features might yield useful and consistent seismic records from sediments.

Not-so-light, but essential reading

In its 125th year the Geological Society of America is publishing invited reviews of central geoscience topics in its Bulletin. They seem potentially useful for both undergraduate students and researchers as accounts of the ‘state-of-the-art’ and compendia of references. The latest focuses on major controls on past sea-level changes by processes that operate in the solid Earth (Conrad, C.P. 2013. The solid Earth’s influence on sea level. Geological Society of America Bulletin, v. 125, p. 1027-1052), a retrospective look at how geoscientists have understood large igneous provinces (Bryan, S. E. & Ferrari, L. 2013. Large igneous provinces and silicic large igneous provinces: Progress in our understanding over the last 25 years. Geological Society of America Bulletin, v. 125, p. 1053-1078) and the perennial topic of how granites form and end up in intrusions (Brown, M. 2013. Granite: From genesis to emplacement Geological Society of America Bulletin, v. 125, p. 1079-1113).

Sea level change

Conrad covers sea-level changes on the short- (1 to 100 years), medium- (1 to 100 ka) and long term (1 to 100 Ma). The first two mainly result from local deformation of different kinds associated with glacial loading and unloading. These result in changes in the land surface, the sea surface nearby and on thousand year to 100 ka timescales to ups and downs of the sea-bed. Global sea-level changes due to melting of continental glaciers at the present day amount to about half the estimated 2 to 3 mm of rise each year. But increasingly sensitive measures show it is more complex as the rapid shifts of mass involved in melting ice also result in effects on the solid Earth. At present solid mass is being transferred polewards, but at rates that differ in Northern and Southern hemispheres and which are changing with anthropogenic influences on glacial melting. Viscous movement of the solid Earth is so slow that effects from previous glacial-interglacial episodes continue today. As a result rapid elastic movements are tending to produce relative sea-level falls in polar regions of up to 20 mm per year with rising sea level focusing on areas between 30°N and 30°S. The influence of the slower viscous mass transfer has an opposite sense: sea-level rise at high latitudes. Understanding the short- and medium-term controls is vital in predicting issues arising in the near future from natural and anthropogenic change.

Comparison of two sea level reconstructions du...
Comparison of two sea level reconstructions during the last 500 Ma. (credit: Wikipedia)

 Most geologists are concerned in practice with explanations for major sea-level changes in the distant past, which have a great deal to do with changes in the volumes of the ocean basins. If the global sea-floor rises on average water is displaced onto former land to produce transgressions, and subsidence of the sea floor draws water down from the land. Conrad gives a detailed account of what has been going on since the start of the Cretaceous Period, based on the rate of sea-floor spreading, marine volcanism and sedimentation, changes in the area of the ocean basins and the effects of thermally-induced uplift and subsidence of the continents, showing how each contribution acted cumulatively to give the vast transgressions and regressions that affected the late Phanerozoic. On the even longer timescale of opening and closing of oceans and the building and disintegration of supercontinents the entire mantle becomes involved in controls on sea level and a significant amount of water is chemically exchanged with the mantle.

Large igneous provinces

Cathedral Peak, 3004m above sea level in the K...

The Web of Science database marks the first appearance in print of “large igneous province” in 1993, so here is a topic that is indeed new, although the single-most important attribute of LIPs, ‘flood basalt’ pops up three decades earlier and the term ‘trap’ that describes their stepped topography is more than a century old. Bryan and Ferrari are therefore charting progress in an exciting new field, yet one that no human – or hominin for that matter – has ever witnessed in action. One develops, on average, every 20 Ma and since they are of geologically short duration long periods pass with little sign of one of the worst things that our planet can do to the biosphere. In the last quarter century it has emerged that they blurt out the products of energy and matter transported as rising plumes from the depths of the mantle; they, but not all, have played roles in mass extinctions; unsuspected reserves of precious metals occur in them; they play some role in the formation of sedimentary basins and maturation of petroleum and it seems other planets have them – a recipe for attention in the early 21st century. Whatever, Bryan and Ferrari provide a mine of geological entertainment.


Granites

In comparison, granites have always been part of the geologist’s canon, a perennial source of controversy and celebrated by major works every decade, or so it seems, with twenty thousand ‘hits’ on Web of Science since 1900 (WoS only goes back that far). Since the resolution of the plutonist-neptunist wrangling over granite’s origin one topic that has been returned to again and again is how and where did the melting to form granitic magma take place? If indeed granites did form by melting and not as a result of ‘granitisation. Lions of the science worried at these issues up to the mid  20th century: Bowen, Tuttle, Read, Buddington, Barth and many others are largely forgotten actors, except for the credit in such works as that of Michael Brown. Experimental melting under changing pressure and temperature, partial pressures of water, CO2 and oxygen still go on, using different parent rocks. One long-considered possibility has more or less disappeared: fractional crystallisation from more mafic magma might apply to other silicic plutonic rocks helpfully described as ‘granitic’ or called ‘granitoids’, but granite  (sensu stricto) has a specific geochemical and mineralogical niche to which Brown largely adheres. For a while in the last 40 years classification got somewhat out of hand, moving from a mineralogical base to one oriented geochemically: what Brown refers to as the period of ‘Alphabet Granites’ with I-, S- A- and other-type granites. Evidence for the dominance of partial melting of pre-existing continental crust has won-out, and branched into the style, conditions and heat-source of melting.

English: Kit-Mikayi, a rock formation near Kis...
Typical granite tor near Kisumu, Kenya (credit: Wikipedia)

All agree that magmas of granitic composition are extremely sticky. The chemical underpinnings for that and basalt magma’s relatively high fluidity were established by physical chemist Bernhardt Patrick John O’Mara Bockris (1923-2013) but barely referred to, even by Michael Brown. Yet that high viscosity has always posed a problem for the coalescence of small percentages of melt into the vast blobs of low density liquid able to rise from the deep crust to the upper crust. Here are four revealing pages and ten more on how substantial granite bodies are able to ascend, signs that the puzzle is steadily being resolved. Partial melting implies changes in the ability of the continental crust to deform when stressed, and this is one of the topics on which Brown closes his discussion, ending, of course, on a ‘work in progress’ note that has been there since the days of Hutton and Playfair.

Rope and dope in lake sediments

Sediments built up on lake beds are a fruitful source of proxy data for all kinds of time series –  mainly climatic and ecological. Pollen, other organic remains, various stable isotopes, and a range of organic geochemical data calibrated to time using magnetostratigraphy, C-14 dating and astronomical ‘pacemakers’. Suddenly there is another proxy: cannabinol, the metabolite of tetrahydrocannibinol the principal psychoactive component of marijuana (Lavrieux, M. et al. 2013. Sedimentary cannabinol tracks the history of hemp retting. Geology, v. 41, p. 751-754). The compound is detectable at the parts per billion level thanks to advances in monitoring the use of drugs, particularly in sports persons – it ends up in the urine of users. So the paper by a team of French Earth scientists has a somewhat irresistible draw, the more so from the opening sentence of its abstract, ‘Hemp (Cannabis sp.) has been a fundamental plant for the development of human societies’. Indeed it has, for the earliest records date back to the Neolithic in China, perhaps back to 12 ka ago.

English: Cultivation of industrial hemp for fi...
Cultivation of hemp for fibre and grain in France. (credit: Wikipedia)

But then all becomes clear: they speak of hemp fibres used in rope and some textiles, and the climatic adaptability of the plant that has ensured its spread from Equator to north of the Arctic Circle and lesser southern latitudes. But there is an element of tongue-in-cheek, or at least so it seemed to me, as the objective of their research is to chart to emergence and rise of rope making in Central France. Freeing the useful fibres from Cannabis stems requires the plant to be soaked and subject to microbial action that breaks down soft tissue, know as retting that is also used in flax and coir production. The resin breaks down to cannabinol, which is therefore a perfect proxy for Hemp retting.

Lac d’Aydat is geologically famous as it formed when a lava flow from one of the puys of the Massif Central blocked a valley and became a dam. It figured in the pioneering volcanological research of English geologist George Julius Poulett Scrope.  Its new place in science rests on Lavrieux  et al.’s chronologically calibrated time series for retting from the lake’s muds. Hemp pollen in the section betrays the start of Cannabis cultivation in the Auvergne between 500-650 AD, but hemp retting in the lake is marked by a cannabinol spike in the 13th century and increases in pollen. It fell-off sharply in the late 19th century, probably as a result of being outcompeted by more easily processed cotton.

Almost 7 centuries of Cannabis processing in central France actually took a toll as cannabinol is toxic to fish and cattle. Despite a 1669 Royal Ordinance against hemp retting in French rivers it continued unchecked in Lac d’Aydat, but more likely than secret retting tucked away in a remote corner of France it stemmed from the ordinance being widely flouted. That it ended with the rise of cotton is not so convincing as hemp is still a staple in rope manufacture, and when the US entered World War II large tracts of land were placed under Cannabis to produce naval  cordage; the reason why it still grows wild in abundance across many States. There is plenty of evidence, including this, that use of Cannabis for cordage came rather late, and plenty in support of  its cultivation and wide spread before the Iron Age for ‘relaxation’.