
Seismic tomography provides no evidence that slabs of oceanic lithosphere descend intact through the whole mantle to the core-mantle boundary. It might once have happened when they were capped by abundant high-density rocks, such as Precambrian banded-iron formations. A great many actively descending slabs have been shown to cease sinking, slide sideways and accumulate at depths around 660 and 1000 km. Until recently these discontinuities were been generally ascribed to transitions in the structure of the dominant mafic mineral olivine (Mg2SiO4) in mantle peridotite induced by increasing pressure and temperature. The resulting increases in mantle density supposedly form barriers to further slab descent. Pressure-induced mineral transitions in the slabs themselves that increase their density, such as pyroxene to garnet, may somehow be inhibited thereby leading to stagnation in slab descent. That may be true for the 660 km discontinuity, but for stagnation at 1000 km deep no such density-changing mineral transitions have shown up in high-P high-T mineralogical experiments. Some other process must therefore be responsible for slab descent to that depth. Recent work by geoscientists at several universities in China gives insights into what may be going on (Li, J., Li, K., Li, J. et al 2026. Dual slab stagnation depths controlled by grain-size-induced sporadic low-viscosity zones at around 1000 km depth. Nature Communications DOI: 10.1038/s41467-026-69987-9).
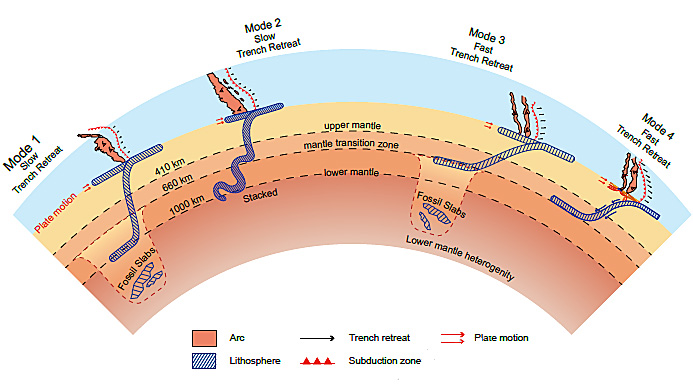
Jing Li and colleagues have focussed on the possibility that changes in the bulk viscosity of the mantle may play an important role. Their approach is twofold: experimental mineral physics and geodynamic modelling. Results suggest that recrystallization in the mantle when deeply penetrating slabs pass through it may patchily reduce the mantle’s grain size and thus its viscosity; the more so with larger volumes of subducted slab material. In turn, the resulting physical heterogeneity probably disrupts the steady downward passage of the slabs; fine-grained, less viscous zones ‘lubricating’ slab penetration, unchanged zones hindering it. The authors link such hypothetical micro-structural processes to modes of subduction that are currently active. They consider four modes of active subduction beneath island arcs with either a slow or a fast rate of trench retreat (see Figure). A slowly retreating trench system combined with low-viscosity patches at depth (Mode 1) results in penetration below 660 km and slab stagnation at 1000 km. Slow trench retreat with a homogenous lower mantle (Mode 2) gives rise to penetration and buckling of the descending slab between 660 and 1000 km. Fast trench retreat with a deeper low-viscosity zone (Mode 3), or with a homogeneous lower mantle (Mode 4) both result in slab stagnation at 660 km.
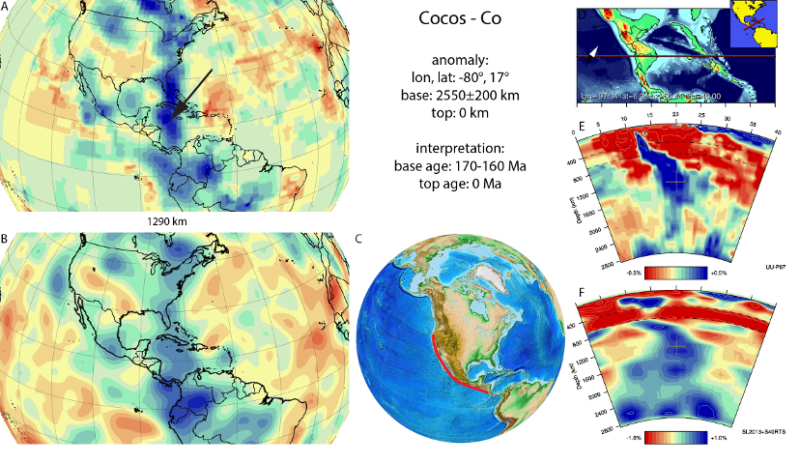
The models developed by Jing Li et al convincingly simulate various results of seismic tomography beneath island arcs. Interestingly, they suggest that the eventual assimilation of older slab materials into the deeper mantle (‘fossil’ slabs) may play a major role in mineral comminution and reduced mantle strength. That may leave behind low viscosity zones that later subduction may exploit. In fact, there are signs of possible fossil slabs in seismic tomograms more than 1000 km below the present Pacific Ocean floor in the form of zones of high P-wave velocity.
This work shows that plate tectonics is far from ‘done-and-dusted’, the mantle being far from uniform in its properties. Li et al’s results potentially open up new insights into whole-mantle convection, in which older tectonic events influence plate motions that are currently operating and the triggering of plumes rising from the deepest mantle. It also hints that such complex physical mixing of subducted material into the mantle may have resulted in the geochemical heterogeneities that increasingly emerge from analysis of magmas with ultimate origins in the mantle.
See also:Grain Size Creates Dual Slab Stagnation Zones at 1000 km. Scienmag 3 March 2026


