

Every ancient craton seen from space shows patterns that are unique to Archaean continental crust: elongated, ‘canoe-shaped’ greenstone belts enveloped by granitic gneisses, both of which are punctured by domes of younger, less deformed granites. The Yilgarn Craton of Western Australia is a typical granite-greenstone terrain. Greenstone belts contain lavas of ultramafic, basaltic and andesitic compositions, which in undeformed settings show the typical pillow structures formed by submarine volcanic extrusion. There are also layered mafic to ultramafic complexes, formed by fractional crystallisation, minor sedimentary sequences and occasionally more felsic lavas and ashes. The enveloping grey gneisses are dominantly highly deformed tonalite-trondhjemite-granodiorite (TTG) composition that suggest that they formed from large volumes of sodium-rich, silicic magmas, probably generated at depth by partial melting of hydrated basaltic rocks.
The heat producing radioactive isotopes of potassium, uranium and thorium in both the Archaean mantle and crust would have been more abundant before 2.5 Ga ago, because they decay over time. Consequently the Earth’s interior would have then generated more heat than now, gradually to escape by thermal conduction towards the cooler surface. The presence of pillow lavas and detrital sediments in greenstone belts indicate that surface temperatures during the Archaean Eon were below the boiling point of water; in fact probably much the same as in the tropics at present. Indeed there is evidence that Earth was then a water world. It may even have been so during the Hadean, as revealed by the oxygen-isotope data in 4.4 Ga zircon grains. The broad conclusion from such findings is that the Archaean geothermal gradient was much steeper; there would have been a greater temperature increase with depth than now and new crust would have cooled more slowly. Subduction of cool lithosphere would have been less likely than in later times, especially as higher mantle heat production would have generated new crust more quickly. Another likely possibility is that far more heat would have been moved by convection: there would have been more mantle-penetrating plumes and they would have been larger. Large mantle plumes of the Phanerozoic have generated vast ocean floor plateaus, such as the Kerguelen and Ontong Java Plateau.
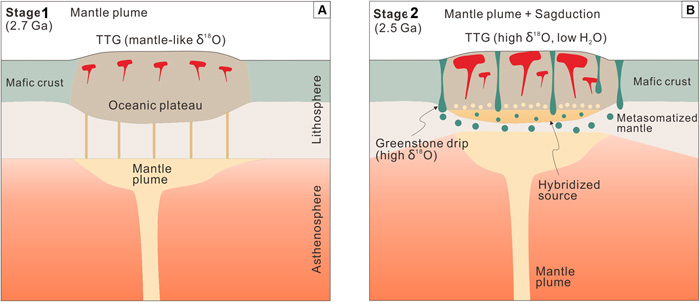
A group of geoscience researchers at The University of Hong Kong and international colleagues recently completed a geological and geochemical study of the North China Craton, analysing their data in the light of recently emerging views on Archaean processes (Dingyi Zhao et al, A two-stage mantle plume-sagduction origin of Archean continental crust revealed by water and oxygen isotopes of TTGs, Science Advances, v. 11, article eadr9513 ; DOI: 10.1126/sciadv.adr9513).They found compelling evidence that ~2.5 Ga-old Neoarchaean TTG gneisses in the North China granite-greenstone terrain formed by partial melting of an earlier mafic-ultramafic greenstone crust with high water content. They consider this to support a two-stage model for the generation of the North China Craton’s crust above a vast mantle plume. The first stage at around 2.7 Ga was the arrival of the plume at the base of the lithosphere, which partially melted as a result of the decompression of the rising ultramafic plume. The resulting mafic magma created an oceanic plateau partly by underplating the older lithosphere, intruding it and erupting onto the older ocean floor. This created the precursors of the craton’s greenstones, the upper part of which interacted directly with seawater to become hydrothermally altered. They underwent minor partial melting to produce small TTG intrusions. A second plume arriving at ~2.5 Ga resulted in sinking of the greenstones under their own weight to mix or ‘hybridise’ with the re-heated lower crust. This caused the greenstones substantially to partially melt and so generate voluminous TTG magmas that rose as the greenstones subsided. . It seems likely that this dynamic, hot environment deformed the TTGs as they rose to create the grey gneisses so typical of Archaean granite-greenstone terranes. [Note: The key evidence for Dingyi Zhao et al.’s conclusions is that the two TTG pulses yielded the 2.7 and 2.5 Ga ages, and show significantly different oxygen isotope data (δ18O)].
Such a petrogenetic scenario, termed sagduction by Dingyi Zhao and colleagues, also helps explain the unique keel-like nature of greenstone belts, and abundant evidence of vertical tectonics in many Archaean terrains (see: Vertical tectonics and formation of Archaean crust; January 2002), Their model is not entirely new, but is better supported by data than earlier, more speculative ideas. That such processes have been recognised in the Neoarchaean – the North China Craton is one of the youngest granite-greenstone terrains – may well apply to far older Archaean continental crust generation. It is perhaps the last of a series of such events that began in the Hadean, as summarised in the previous Earth-logs post.


