One of the properties of radar is that it can pass through hundreds of metres of ice to be scattered by the bedrock beneath and return to the surface with sufficient remaining power to allow measurement of ice depth from the time between transmission of a pulse and that when the scattered energy returns to the antenna. Liquid water simply absorbs the radar energy preventing any return from the subsurface. As far as rocks and soils are concerned, any water in them and the structure of minerals from which they are composed limit penetration and energy return to at most only a few metres. While radar images that result from scattering by the Earth’s solid surface are highly informative about landforms and variations in the surface’s small-scale texture, outside of seismic reflection profiling, only ice-penetrating radar (IPR) approaches the ‘holy grail’ of mapping what lies beneath the surface in 3-D. Unlike seismic surveys it can be achieved from aircraft and is far cheaper to conduct.
Greenland’s topography without the ice sheet. (Photo credit: Wikipedia)
It was IPR that revealed the scattering of large lakes at the base of the Antarctic ice cap, but a survey of Greenland has revealed something even more astonishing: major drainage systems. These include a vast canyon that meanders beneath the thickest part of the ice towards the island’s north coast (Bamber, J.L. et al. 2013. Palaeofluvial mega-canyon beneath the central Greenland ice sheet. Science, v. 341, p. 997-999). At 750 km long and a maximum depth of 800 m it is comparable with active canyon systems along the Colorado and Nile rivers in the western US and Ethiopia respectively. A less-well publicised feature is ancient leaf-shaped system of buried valleys further south that emerges in a great embayment on West Greenland’s coast near Uummannaq, which may be the catchment of another former river system. In fact much of the data that revealed what appears to be pre-glacial topography dates back to the 1970s, though most was acquired since 2000. The coverage by flight lines varies a great deal, and as more flights are conducted, yet more detail will emerge.
The British, Canadian and Italian discoverers consider that glacial meltwater sinking to the base of the ice cap continues to follow the canyon, perhaps lubricating ice movement. The flatter topography beneath the Antarctic ice cap is not so easy to drain, which probably accounts for the many sub-glacial lakes there whereas none of any significance have been detected in Greenland. The earliest time when Greenland became ice-bound was about 5 Ma ago, so that is the minimum age for the river erosion that carved the canyon
Melting pond on the Greenland ice sheet (credit: Photo by Leif Taurer)
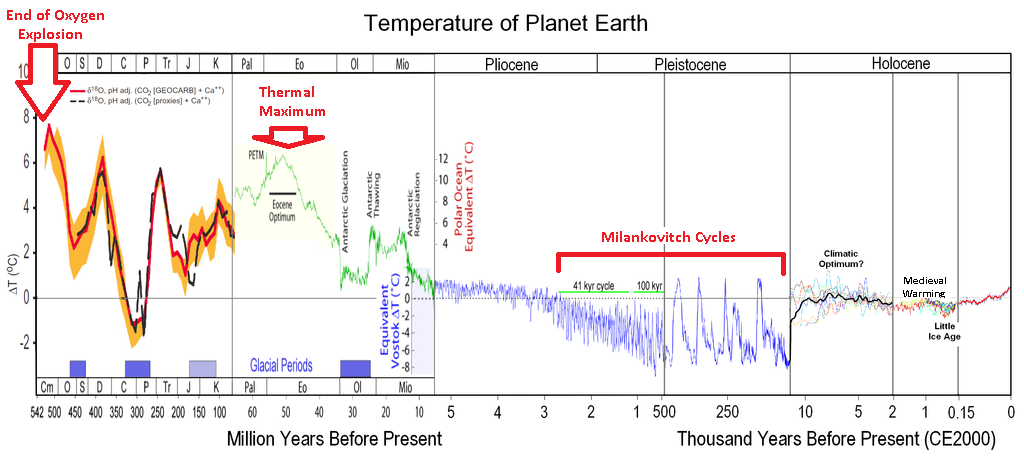
Milutin Milankovitch’s astronomical theory to account for glacial – interglacial cycles is based on 3 gravitational influences on the Earth that change the way it spins and orbits the Sun. Each is cyclic but with different periods: the angle of axial tilt every 41 ka; precession of its rotation axis on a 23 ka pacing; the change in shape of the orbit around the Sun over 100 ka. Each subtly affects the amount of solar energy, their influences combining to produce a seemingly complex, but predictable variation through time of solar heating for any point on the Earth’s surface. Milankovitch’s work was triumphantly confirmed when analysis of oxygen-isotope time series from sea-floor sediments revealed precisely these periods in the record of continental ice cover. Specifically, astronomical pacing of midsummer insolation at 65°N matches the real climatic pattern through time.
Yet the periods between glacial maxima have not stayed constant over the last 2 Ma or so (Figure showing Phanerozoic climate changes). About 0.8 to 1 Ma ago a sequence with roughly 41 ka spacing was replaced by another about every 100 ka, i.e. both overall climate periods matched one of the astronomical forcings. What is a puzzle is that the current periodicity seems to follow the very weakest influence in energy terms; that from orbital eccentricity. The energy shifts from changes in orbit shape are, in fact, far too weak to drive the accumulation and eventual melting of ice sheets on land. Climatologists have suggested a variety of processes that might be paced by eccentricity but which act to amplify is climatic ‘signal’. None have been especially convincing.
In an attempt to resolve the mystery Ayako Abe-Ouchi of the University of Tokyo and Japanese, US and Swiss colleagues linked a climate model driven by Milankovitch insolation and variations in CO2 recorded in an Antarctic ice core with a model of how land-ice forms and interacts with the underlying lithosphere (Abe-Ouchi, A. et al. 2013. Insolation-driven 100,000-year glacial cycles and hysteresis of ice-sheet volume. Nature, v. 500, p. 190-193).
Map of ice sheets, sea temperature changes, and changes in the outline of coastal regions during the last glacial maximum. (credit: Wikipedia)
Their key discovery is that the ice-sheets that repeatedly formed on the Canadian Shield and extended further south than Chicago had such a huge mass that they changed the shape of the land surface beneath them so much it had an effect on climate as a whole. The reason for this is that glacial loading forces the lithosphere down by displacing the more ductile asthenosphere sideways. But when melting begins rebound of the rock surface lags a long time behind the shrinking ice volume – well displayed today in Britain and Scandinavia by continued rise of the land to form raised beaches. In the case of the North American ice sheet, what had become an enormous ice bulge at glacial maxima developed into a huge basin up to 1 km deep as the ice began to melt. Simply by virtue of its low elevation this sub-continental basin would have warmed up more and more rapidly as the ice-surface fell because of this ‘isostatic’ lag.
Another feature to emerge from the model was the interaction between the 100 ka eccentricity ‘signal’ and that of precession at 23 ka. For long periods that kept summer temperature low enough for snow to pile up and become glacial ice, but on a roughly 100 ka time scale both acted together to increase summer temperatures at high northern latitudes. Melting that instantaneously removed some ice load each summer brought into play the sluggish isostatic response that helped even more warming the following year. As well as convincingly accounting for the 100 ka mystery, the model explains the far more rapid deglaciations in that mode than in the preceding 41 ka cycles, which were almost symmetrical compared with the more recent slow accumulation of continental ice sheets over ~90 ka followed by almost complete melting in a mere 10 ka.
If true, the model seems to imply that before 800 ka the positions, thicknesses and extents of continental ice sheets were different from those in later times. Or perhaps it reflects a steady increase in the overall volume of ice being produced over northern North America, or that glacial erosion thinned the crust until changing isostatic influences could ‘trip’ sufficient additional warming.
The most widely fearedrisk of poisoning through natural causes, which grossly disfigures and kills through a range of cancers, is from chronic exposure to arsenic in drinking water. Tragically, the risk is highest from what has traditionally been considered safest source, groundwater. That was the gruesome lesson of a massive transfer in Bangladesh from drinking surface water containing organic pathogens to reliance on well waters. The greatest mass poisoning in history was eventually traced to shallow aquifers in the Ganges-Brahmaputra plains that were rich in organic matter. Their reducing chemistry broke down iron hydroxide coatings on sedimentary grains. Since these minerals are among the most accommodating adsorbers of ions from the environment, including a variety of arsenic-bearing ions, their dissolution releases potential poisons from otherwise safe storage. In Bangladesh and neighbouring West Bengal in India it was found that deeper aquifers have oxidising chemistry and so the iron minerals not only hold ionic pollutants fast by adsorption but help to extract them from groundwater. Deep wells together with various kinds of treatment of shallow groundwater, some using the very iron minerals whose breakdown caused the pollution, are helping to mitigate the perilous situation for people of South Asia.
Skin lesions (keratoses) from arsenic poisoning in Bangladesh (Photo credit: waterdotorg)
Much the same kind of arsenic pollution has subsequently been revealed in groundwaters of lowland Vietnam and Cambodia. Yet the turn there to deep groundwater has revealed a new twist. That too is yielding increasingly high arsenic concentrations, but for a different reason (Erband, L.E. et al. 2013. Release of arsenic to deep groundwater in the Mekong Delta, Vietnam, linked to pumping-induced land subsidence. Proceedings of the National Academy of Science, doi/10.1073/pnas.1300503110). Scientists from Stanford University, California analysed waters from around 900 wells in the Lower Mekong Delta and found several tracts with arsenic contents well above levels deemed safe by the WHO. Some, as could be anticipated from South Asian studies, were from shallow wells along the present course of the Mekong. However, in the delta area to the southwest of Ho Chi Minh City (formerly Saigon) is a large cluster from wells 150 to 450 m deep, totally unlike the situation in other areas of thick Pliocene to Recent river sedimentation.
Comparing the distribution of affected wells with precise estimates of the subsidence rates of the land surface from orbital interferometric radar surveys shows a close correlation of arsenic contamination with rates of subsidence. This suggests that groundwater pumping from deep aquifers is causing compaction at depth, in much the same way as in the environs of Venice. But is this somehow drawing in arsenic polluted water from higher levels? It seems not. So the pollution seems most likely to be an effect of pumping itself. The authors suggest that most of the subsidence is due to compaction of clay-rich sediments rather than the sandy aquifers, well known by engineers to resist compression. They explain the increasing arsenic concentrations by the introduction into the aquifers of water expelled from the clays, either containing arsenic ions in solution or carrying organic compounds that create the reducing conditions to break down iron hydroxide grain coatings and release ions adsorbed on their surfaces.
This presents another grim prospect for South Asian people forced to make the choice between drinking polluted surface water and enteric disease and increasingly exploited deep groundwaters that seem to be safe as well as in very high volumes. Let’s hope that arsenic monitoring can be maintained in the Ganges-Brahmaputra plains in the long term.
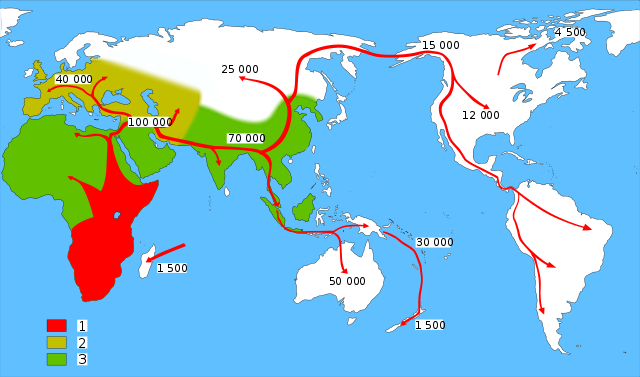
One of the oddities of using human genetic material passed down the male (from Y chromosomes) and female lines (from mitochondria) to assess when fully modern humans originated is that they have hitherto given widely different dates: 50 to 115 ka and 150 to 240 ka respectively. Twice to three-times the age for a putative ancestral ‘mother’ compared with such a ‘father’ for humanity raised all kinds of problematic issues for palaeoanthropology, such as a possibly greater ‘turnover’ of lines of descent among males perhaps due to riskier lifestyles. Y-chromosome data limited speculation on the timing of human colonisation outside of Africa to a maximum of 60 ka, even though there is fossil and archaeological evidence for a much earlier presence in the Levant and India. The difference also questions the validity of molecular-clock approaches to evolutionary matters. Two new studies have lessened the phylogenetic strains.
One examines Y chromosomes in 69 males from nine diverse populations from Africa, Eurasia and Central America (Poznik, G.D. and 10 others 2013. Sequencing Y chromosomes resolves discrepancy in time to common ancestors of males versus females. Science, v. 341, p. 562-565). The US-French team applied sophisticated statistics as well as the elements of a molecular clock approach to both Y-chromosome and mitochondrial DNA, discovering in the process a hitherto unresolved feature in the African part of the male ‘tree’. The outcome is a significant revision of both male and female paths of descent: 120 to 156 ka and 99 to 148 ka to the last common ancestor in both lines. The upper limit is somewhat lower than the age of fossil evidence for the earliest anatomically modern humans.
The second study zeros-in on the European story, by examining the Y-chromosome data of 1200 men from Sardinia (Francalacci, P. and 38 others. Low-pass DNA sequencing of 1200 Sardinians reconstructs European Y-chromosome phylogeny. Science, v. 341, p. 565-569) calibrated to some extent by the date when Sardinia was first colonised (7.7 ka). It too revealed new detail that enabled the Italian-US-Spanish team to refine the time when features of Sardinian Y-chromosome DNA would coalesce with those from the rest of the world. In this case the date for a last common paternal ancestor goes back to between 180 to 200 ka, more similar to the old dates for ‘African Eve’ and the earliest modern human fossils than to either that for male or female lines arrived at by Posnik et al. (2013), which are significantly younger.
Map of early migrations of modern humans based on Y chromsome data (credit: Wikipedia)
Equally interesting are the comments on both papers in the Perspectives section of the issue of science in which they appear (Cann, R.L. 2013. Y weigh in again on modern humans. Science, v. 341, p. 465-7).Rebecca Cann of the University of Hawaii Manoa considers the two sets of results from Y-chromosomes potentially capable of refining models for the migration times of modern humans out of Africa and their interactions with the archaic populations that they eventually displaced from Europe and central and southern Asia (Neanderthals, Denisovans and Homo erectusrespectively). She believes that will include signs of earlier excursions that the generally accepted diaspora between roughly 60 and 50 ka seemingly constrained by the previous 50 to 115 ka estimate for the last common paternal ancestor. That would help explain the presence of modern humans in India at the time of the Toba eruption (71 ka).
Geologists who study turbidites assume that the distinctive graded beds from which they are constructed and a range of other textures represent flows of slurry down unstable steep slopes when submarine sediment deposits are displaced. Such turbidity currents were famously recorded by the severing of 12 transatlantic telecommunication cables off Newfoundland in 1929. This happened soon after an earthquake triggered 100 km hr-1 flows down the continental slope, which swept some 600 km eastwards.
Typical structures in Upper Carboniferous turbidites near Bude, Cornwall, UK (credit: Flickr, Earthwatcher)
Sea beds at destructive margins provide the right conditions for repeated turbidity currents and it is reasonable to suppose that patterns should emerge from the resulting turbidite beds that in some way record the seismic history of the area. British and Indonesian geoscientists set out to test that hypothesis at the now infamous plate margin off Sumatra that hosted the great Acheh Earthquake and tsunamis of 26 December 2004 to kill 250 thousand people around the rim of the Indian Ocean (Sumner, E.J. et al. 2013. Can turbidites be used to reconstruct a paleoearthquake record for the central Sumatra margin? Geology, v. 41, p.763-766).
Animation of Indonesian tsunami of 26 December 2004 (credit: Wikipedia)
Cores through turbidite sequences along a 500 km stretch of the margin formed the basis for this important attempt to test the possibility of recording long-term seismic statistics. To avoid false signals from turbidity currents stirred up by storms, floods and slope failure from rapid sediment build-up 17 sites were cored in deep water away from major terrestrial sediment supplies, which only flows triggered by major earthquakes would be likely to reach. To calibrate core depth to time involved a variety of radiometric and stratigraphic methods
Disappointingly, few of the sites on the submarine slopes recorded turbidites that match events during the 150-year period of seismic records in the area, none being correlatable with the 2004 and 2005 great earthquakes. Indeed very little correlation of distinctive textures from site to site emerged from the study. Some sites on slopes revealed no turbidites at all from the last 150 years, whereas turbidites in others that could be accurately dated occurred when there were no large earthquakes. Only cores from the deep submarine trench consistently preserved near-surface turbidites that might record the 2004 and 2005 great earthquakes.
These are surprising as well as depressing results, but perhaps further coring will discover what kind of bathymetric features might yield useful and consistent seismic records from sediments.
In its 125th year the Geological Society of America is publishing invited reviews of central geoscience topics in its Bulletin. They seem potentially useful for both undergraduate students and researchers as accounts of the ‘state-of-the-art’ and compendia of references. The latest focuses on major controls on past sea-level changes by processes that operate in the solid Earth (Conrad, C.P. 2013. The solid Earth’s influence on sea level. Geological Society of America Bulletin, v. 125, p. 1027-1052), a retrospective look at how geoscientists have understood large igneous provinces (Bryan, S. E. & Ferrari, L. 2013. Large igneous provinces and silicic large igneous provinces: Progress in our understanding over the last 25 years. Geological Society of America Bulletin, v. 125, p. 1053-1078) and the perennial topic of how granites form and end up in intrusions (Brown, M. 2013. Granite: From genesis to emplacement Geological Society of America Bulletin, v. 125, p. 1079-1113).
Sea level change
Conrad covers sea-level changes on the short- (1 to 100 years), medium- (1 to 100 ka) and long term (1 to 100 Ma). The first two mainly result from local deformation of different kinds associated with glacial loading and unloading. These result in changes in the land surface, the sea surface nearby and on thousand year to 100 ka timescales to ups and downs of the sea-bed. Global sea-level changes due to melting of continental glaciers at the present day amount to about half the estimated 2 to 3 mm of rise each year. But increasingly sensitive measures show it is more complex as the rapid shifts of mass involved in melting ice also result in effects on the solid Earth. At present solid mass is being transferred polewards, but at rates that differ in Northern and Southern hemispheres and which are changing with anthropogenic influences on glacial melting. Viscous movement of the solid Earth is so slow that effects from previous glacial-interglacial episodes continue today. As a result rapid elastic movements are tending to produce relative sea-level falls in polar regions of up to 20 mm per year with rising sea level focusing on areas between 30°N and 30°S. The influence of the slower viscous mass transfer has an opposite sense: sea-level rise at high latitudes. Understanding the short- and medium-term controls is vital in predicting issues arising in the near future from natural and anthropogenic change.
Comparison of two sea level reconstructions during the last 500 Ma. (credit: Wikipedia)
Most geologists are concerned in practice with explanations for major sea-level changes in the distant past, which have a great deal to do with changes in the volumes of the ocean basins. If the global sea-floor rises on average water is displaced onto former land to produce transgressions, and subsidence of the sea floor draws water down from the land. Conrad gives a detailed account of what has been going on since the start of the Cretaceous Period, based on the rate of sea-floor spreading, marine volcanism and sedimentation, changes in the area of the ocean basins and the effects of thermally-induced uplift and subsidence of the continents, showing how each contribution acted cumulatively to give the vast transgressions and regressions that affected the late Phanerozoic. On the even longer timescale of opening and closing of oceans and the building and disintegration of supercontinents the entire mantle becomes involved in controls on sea level and a significant amount of water is chemically exchanged with the mantle.
Large igneous provinces
The Web of Science database marks the first appearance in print of “large igneous province” in 1993, so here is a topic that is indeed new, although the single-most important attribute of LIPs, ‘flood basalt’ pops up three decades earlier and the term ‘trap’ that describes their stepped topography is more than a century old. Bryan and Ferrari are therefore charting progress in an exciting new field, yet one that no human – or hominin for that matter – has ever witnessed in action. One develops, on average, every 20 Ma and since they are of geologically short duration long periods pass with little sign of one of the worst things that our planet can do to the biosphere. In the last quarter century it has emerged that they blurt out the products of energy and matter transported as rising plumes from the depths of the mantle; they, but not all, have played roles in mass extinctions; unsuspected reserves of precious metals occur in them; they play some role in the formation of sedimentary basins and maturation of petroleum and it seems other planets have them – a recipe for attention in the early 21st century. Whatever, Bryan and Ferrari provide a mine of geological entertainment.
In comparison, granites have always been part of the geologist’s canon, a perennial source of controversy and celebrated by major works every decade, or so it seems, with twenty thousand ‘hits’ on Web of Science since 1900 (WoS only goes back that far). Since the resolution of the plutonist-neptunist wrangling over granite’s origin one topic that has been returned to again and again is how and where did the melting to form granitic magma take place? If indeed granites did form by melting and not as a result of ‘granitisation. Lions of the science worried at these issues up to the mid 20th century: Bowen, Tuttle, Read, Buddington, Barth and many others are largely forgotten actors, except for the credit in such works as that of Michael Brown. Experimental melting under changing pressure and temperature, partial pressures of water, CO2 and oxygen still go on, using different parent rocks. One long-considered possibility has more or less disappeared: fractional crystallisation from more mafic magma might apply to other silicic plutonic rocks helpfully described as ‘granitic’ or called ‘granitoids’, but granite (sensu stricto) has a specific geochemical and mineralogical niche to which Brown largely adheres. For a while in the last 40 years classification got somewhat out of hand, moving from a mineralogical base to one oriented geochemically: what Brown refers to as the period of ‘Alphabet Granites’ with I-, S- A- and other-type granites. Evidence for the dominance of partial melting of pre-existing continental crust has won-out, and branched into the style, conditions and heat-source of melting.
Typical granite tor near Kisumu, Kenya (credit: Wikipedia)
All agree that magmas of granitic composition are extremely sticky. The chemical underpinnings for that and basalt magma’s relatively high fluidity were established by physical chemist Bernhardt Patrick John O’Mara Bockris (1923-2013) but barely referred to, even by Michael Brown. Yet that high viscosity has always posed a problem for the coalescence of small percentages of melt into the vast blobs of low density liquid able to rise from the deep crust to the upper crust. Here are four revealing pages and ten more on how substantial granite bodies are able to ascend, signs that the puzzle is steadily being resolved. Partial melting implies changes in the ability of the continental crust to deform when stressed, and this is one of the topics on which Brown closes his discussion, ending, of course, on a ‘work in progress’ note that has been there since the days of Hutton and Playfair.
Sediments built up on lake beds are a fruitful source of proxy data for all kinds of time series – mainly climatic and ecological. Pollen, other organic remains, various stable isotopes, and a range of organic geochemical data calibrated to time using magnetostratigraphy, C-14 dating and astronomical ‘pacemakers’. Suddenly there is another proxy: cannabinol, the metabolite of tetrahydrocannibinol the principal psychoactive component of marijuana (Lavrieux, M. et al. 2013. Sedimentary cannabinol tracks the history of hemp retting. Geology, v. 41, p. 751-754). The compound is detectable at the parts per billion level thanks to advances in monitoring the use of drugs, particularly in sports persons – it ends up in the urine of users. So the paper by a team of French Earth scientists has a somewhat irresistible draw, the more so from the opening sentence of its abstract, ‘Hemp (Cannabis sp.) has been a fundamental plant for the development of human societies’. Indeed it has, for the earliest records date back to the Neolithic in China, perhaps back to 12 ka ago.
Cultivation of hemp for fibre and grain in France. (credit: Wikipedia)
But then all becomes clear: they speak of hemp fibres used in rope and some textiles, and the climatic adaptability of the plant that has ensured its spread from Equator to north of the Arctic Circle and lesser southern latitudes. But there is an element of tongue-in-cheek, or at least so it seemed to me, as the objective of their research is to chart to emergence and rise of rope making in Central France. Freeing the useful fibres from Cannabis stems requires the plant to be soaked and subject to microbial action that breaks down soft tissue, know as retting that is also used in flax and coir production. The resin breaks down to cannabinol, which is therefore a perfect proxy for Hemp retting.
Lac d’Aydat is geologically famous as it formed when a lava flow from one of the puys of the Massif Central blocked a valley and became a dam. It figured in the pioneering volcanological research of English geologist George Julius Poulett Scrope. Its new place in science rests on Lavrieux et al.’s chronologically calibrated time series for retting from the lake’s muds. Hemp pollen in the section betrays the start of Cannabis cultivation in the Auvergne between 500-650 AD, but hemp retting in the lake is marked by a cannabinol spike in the 13th century and increases in pollen. It fell-off sharply in the late 19th century, probably as a result of being outcompeted by more easily processed cotton.
Almost 7 centuries of Cannabis processing in central France actually took a toll as cannabinol is toxic to fish and cattle. Despite a 1669 Royal Ordinance against hemp retting in French rivers it continued unchecked in Lac d’Aydat, but more likely than secret retting tucked away in a remote corner of France it stemmed from the ordinance being widely flouted. That it ended with the rise of cotton is not so convincing as hemp is still a staple in rope manufacture, and when the US entered World War II large tracts of land were placed under Cannabis to produce naval cordage; the reason why it still grows wild in abundance across many States. There is plenty of evidence, including this, that use of Cannabis for cordage came rather late, and plenty in support of its cultivation and wide spread before the Iron Age for ‘relaxation’.
Review of Fracking Issues posted on 31 May 2013 briefly commented on a major academic study of the impact of shale gas exploitation on groundwater. The 12 July 2013 issue of Science follows this up with a similar online, extensive treatment of how underground disposal of fracking fluids might influence seismicity in new gas fields (Ellsworth, W.J. 2013. Injection-induced earthquakes. Science, v. 341, p. 142 and doi: 10.1126/science.1225942) plus a separate paper on the same topic (van der Elst, N.J. et al. 2013. Enhanced remote earthquake triggering at fluid-injection sites in the Midwestern United States. Science, v. 341, p.164-167).
Major shale gas basins (credit: Wikipedia)
It was alarm caused by two minor earthquakes (<3 local magnitude) that alerted communities on the Fylde peninsula and in the seaside town of Blackpool to worrisome issues connected to Cuadrilla Resources’ drilling of exploratory fracking wells. These events were put down to the actual hydraulic fracturing taking place at depth. Such low-magnitude seismic events pose little hazard but nuisance. The two reports in Science look at longer-term implications associated with regional shale-gas development. All acknowledge that the fluids used for hydraulic fracturing need careful disposal because of their toxic hazards. The common practice in the ‘mature’ shale-gas fields in the US is eventually to dispose of the fluids by injecting them into deep aquifers, which Vidic et al. suggested that ‘due diligence’ in such injection of waste water should ensure limited leakage into shallow domestic groundwater.
The studies, such as that by William Ellsworth, of connection between deep waste-water injection and seismicity are somewhat less reassuring. From 1967 to 2001 the central US experienced a steady rate of earthquakes with magnitudes greater than 3.0, which can be put down to the natural background of seismicity in the stable lithosphere of mid North America. In the last 12 years activity at this energy level increased significantly, notably in areas underlain by targets for shale-gas fracking such as the Marcellus Shale of the north-eastern US. The increase coincides closely with the history of shale-gas development in the US. The largest such event (5.6 local magnitude) destroyed 14 homes in Oklahoma near to such a waste-injection site. Raising the fluid pressure weakens faults in the vicinity thereby triggering them to fail, even if their tectonic activity ceased millions of years ago: many retain large elastic strains dependent on rock strength.
Apart from the mid-continent New Madrid seismic zone associated with a major fault system parallel to the Mississippi, much of the central US is geologically simple with vast areas of flat-bedded sediments with few large faults. The same cannot be said for British geology which is riven with major faults formed during the Caledonian and Variscan orogenies, some of which in southern Britain were re-activated by tectonics associated with the Alpine events far off in southern Europe. Detailed geological maps show surface-breaking faults everywhere, whereas deep coal mining records and onshore seismic reflection surveys reveal many more at depth. A greater population density living on more ‘fragile’ geology may expect considerably more risk from industrially induced earthquakes, should Britain’s recently announced ‘dash’ for shale gas materialise to the extent that its sponsors hope for.
Nicholas van der Elst and colleagues’ paper indicates further cause for alarm. They demonstrate that large remote earthquakes. In the 10 days following the 11 March 2011 Magnitude 9.0 Sendai earthquake a swarm of low-energy events took place around waste injection wells in central Texas, to be followed 6 months later by a larger one (4.5 local magnitude). Similar patterns of injection-related seismicity followed other distant great earthquakes between 2010 and 2012. Other major events seem not to have triggered local responses. The authors claim that the pattern of earth movements produced by such global triggering might be an indicator of whether or not fluid injection has brought affected fault systems to a critical state. That may be so, but it seems little comfort to know that one’s home, business or community is potentially to be shattered by intrinsically avoidable seismic risk.
The extremely hazardous seaway through the Straits of Gibraltar and the waterless deserts of the Levant presented considerable barriers to natural exchange of animal groups between Africa and Eurasia throughout the period of hominin evolution known from the African Pliocene and Pleistocene record. These barriers were breached by hominins only occasionally. Through most of the Miocene and back to the Mesozoic Era Iberia and what is now Morocco were separated by a wide seaway preventing faunal exchange. That Betic Seaway eventually closed with the tectonic collision of the two sides to form the modern Betic Cordillera in southern Spain towards the end of the Miocene. This left parts of the Mediterranean to evaporate during what is known as the Messinian Salinity Crisis, which reached completion at 5.59 Ma. Yet this Europe-Africa connection was short-lived, being breached by what is regarded as one of the most dramatic events in Cenozoic history: the Zanclean Flood. At 5.33 Ma the Atlantic burst through what is now the Straits of Gibraltar to refill the Mediterranean Basin within a period between a few months and two years. The flooding began as a vast system of rapids some 1 km high with an estimated flow a thousand times that of the modern Amazon.
Strait of Gibraltar from space, with Spain on the left and Morocco on the right.) (credit: Wikipedia)
During the existence of the Europe-Africa land bridge it was possible for animals to move between north-west Africa and western Europe. Evidence that such an exchange did take place comes from a number of Late Miocene localities in southern Spain and North Africa. The first recorded migrants into Spain were African gerbils, then evidence mounted for larger animals, including hippos and early camels moving into Europe and a reverse migration of rabbits and mice. One of the Spanish sites (Gibert, L. et al. 2013. Evidence for an African-Iberian mammal dispersal during the pre-evaporitic Messinian. Geology, v. 41, p. 691-694) has allowed precise magnetostratigraphic dates to be put on the migrations. The Spanish-US team suggests conditions ripe for migration were in three distinct phases: around 6.3 Ma when hippos managed to swim to Europe; around 6.2 Ma which saw European small mammals making the journey south and camels moving to Europe; in a 300 ka window of opportunity from 5.6 to 5.3 Ma for African mice to make the journey into Europe. Several distinct episodes probably reflect some ups and downs of sea level related to glacial retreats and advances in Antarctica.
One implication of the short-lived Messinian land bridge is that it may have been followed by primates, though evidence has yet to be found. A particularly interesting genus, suggested by some as a possible common ancestor for hominins and chimpanzees, is Oreopithecus a bipedal ape recorded from the Miocene of Italy
The Afar Depression of Ethiopia and Eritrea is a feature of tectonic serendipity. It is unique in showing on land the extensional processes and related volcanism that presage sea-floor spreading. Indeed it hosts three rift systems and a triple junction between the existing Red Sea and Gulf of Aden spreading centres and the East African Rift System that shows signs of future spalling of Somalia from Africa. Afar has been a focus of geoscientific attention since the earliest days of plate theory but practical interest has grown rapidly over the last decade or so when the area has become significantly more secure and safe to visit. Two recent studies seem to have overturned one of the most enduring assumptions about what drives this epitome of continental break-up.
Simulated perspective view of the Afar depression from the south (credit: Wikipedia)
From the obvious thermal activity deep below Afar, linked with volcanism and high heat flow, a mantle host spot and rising plume of deep mantle has been central to ideas on the tectonics of the area. A means of testing this hypothesis is the use of seismic data to assess the ductility and temperature structure of deep mantle through a form of tomography. The closer the spacing of seismic recording stations and the more sensitive the seismometers are the better the resolution of mantle structure. Afar now boasts one of the densest seismometer networks, rivalling the Earthscope USArray. http://earth-pages.co.uk/2009/11/01/the-march-of-the-seismometers/ and it is paying dividends (Hammond, J.O.S. and 10 others 2013. Mantle upwelling and initiation of rift segmentation beneath the Afar Depression. Geology, v. 41, p.635-638). The study brought together geoscientists from Britain, the US, Ethiopia, Eritrea and Botswana, who used data from 244 seismic stations in the Horn of Africa to probe depths down to 400 km with a resolution of about 50 km.
The tomographic images show no clear sign of the kind of narrow plume generally aasociated with the notion of a ‘hot spot’. Instead they pick out shallow (~75 km depth) P- and S-wave low-velocity features that follow the axes of the three active rift systems. The features coalesce at depth; in some respects the opposite of a classic plume that has a narrow ‘stem’ that swells upwards to form a broad ‘head’. If there ever was an Afar Plume it no longer functions. Instead, the rifts and associated lithospheric thinning are associated with a mantle upwelling that is being emplaced passively in the space made available by extensional tectonics. This is closely similar to what goes on beneath active and well-established mid-ocean spreading centres where de-pressuring of the rising mantle results in partial melting and basaltic magmatism along the rift system. Perhaps this is a sign that full sea-floor spreading in Afar is imminent, at least on geological timescales.
Simplified geologic map of the Afar Depression. (credit: Wikipedia after Beyene and Abdelsalam (2005))
For once, mantle geochemists and geophysicists have data that support a common hypothesis (Ferguson, D.J. and 8 others 2013. Melting during late-stage rifting in Afar is hot and deep. Nature, v. 499, p. 70-73). This US-British-Ethiopian team compares the trace element geochemistry of Recent basaltic lavas erupted along the axis of the Afar rift that links with the Red Sea spreading centre with equally young lavas from volcanoes some 20 km from the axis. Both sets of lavas are a great deal more enriched in incompatible trace elements that are generally enriched in melt compare with source than are ocean-floor basalts sampled from the mid-Red Sea rift. Modelling rare-earth element patterns in particular suggests that partial melting is going on at depths where garnet is stable in the mantle instead of spinel. This suggests that a strong layer, about 85 km down in the upper mantle is beginning to melt – magmas formed by small degrees of partial melting generally contain higher amounts of incompatible trace elements than do the products of more extensive melting. Estimates of the temperature of melting from lavas extruded at the rift axis than off-axis are significantly higher than expected at this depth suggesting that deeper mantle is rising faster than it can lose heat.
The depth of melting tallies with the thermal feature picked out by seismic tomography. The two teams converge on passively induced upwelling of hot asthenosphere while the Afar lithosphere is slowly being extended. The degree of melting beneath Afar is low at present, so that to become like mid-ocean ridge basalts a surge in the fraction of melting is needed. That would happen if the strong mantle layer fails plastically so that more asthenosphere can rise higher by passive means. The geochemists persist in an appeal to an Afar Plume for the 30 Ma old flood basalts that plaster much of the continental crust outside Afar. Those plateau-forming lavas, however, are little different in their trace element geochemistry from off-axis Afar basalts. Yet they are not obviously associated with an earlier episode of lithospheric extension and passive mantle upwelling. Most geologists who have studied the flood basalts would agree that they preceded the onset of rifting but have little idea of the actual processes that went on during that mid-Oligocene volcanic cataclysm.
It is always refreshing when physical anthropologists perform experiments as well as pondering on bones. It turns out that examining the bio-mechanics of college baseball players can provide useful clues about where in fossil anatomy to look for signs of potential big-game hunters. Anyone who can hurl a baseball, or one of the smaller but much harder red ones preferred by non-Americans, at speeds exceeding 100 kph could in all likelihood bring down a substantial prey animal with a rock and even more so with a spear. At the heart of an important examination of what our forebears might have done to get a meaty meal (Roach, N.T. et al. 2013. Elastic energy storage in the shoulder and the evolution of high-speed throwing in Homo. Nature, v. 498, p. 483-486) is a US-Indian team’s sophisticated study of college baseball players’ throwing action using high-speed video, radar and precise timing techniques.
Matt Kata throwing for the Houston Astros (Photo credit: Wikipedia)
It seems that there are several physiological phases in demon ball throwing: rotation of the torso; rotation flexion and extension of the shoulder; flexion and extension of the elbow; and wrist extension. All of these contribute to acceleration of the ball before release. While the thrower steps forward the arm is cocked so that ligaments, tendons and muscles crossing the shoulder become stretched, thereby storing energy. During the acceleration phase the bend in the elbow is snapped straight adding yet more power. Readers should note the difference between this action and that of a bowler in cricket, where the elbow snap is banned on pain of severe penalty and public humiliation of the bowler who ‘chucks’. Since a fast bowler also adds energy by running into the crease, this is a humanitarian aspect of the Rules of cricket, although several legal West Indian bowlers of the past 40 years are still remembered with terror by their batsmen contemporaries. No such stricture is placed on the baseball pitcher who has no run-up.
These observations focus attention on the structure of shoulder and elbow, yielding a robust means of predicting how fast throwers with different configurations may have thrown objects. Chimpanzees make poor players of ball games, although they will throw the odd stick, but just for aggressive show. The same goes for the earliest hominins for which we have suitable fossil material: australopithecines may occasionally have eaten carrion but they couldn’t throw rocks or spears with enough force to bring down anything and their throwing range would have been pathetic. Not so Homo erectus! They were well equipped in the hurling department and could, were they so inclined, have hunted equally as well as modern humans. Interestingly, earlier hominins had some of the physiological necessities of decent throwing, but not all of them. So it seems that the full combination emerged in the evolution of our own genus around 2 Ma ago,
This is in contrast to a view held by some anthropologists, such as Christopher Boehm of the University of Southern California, that big game hunting using projectile weapons emerged only with anatomically modern humans after 250 ka, and most likely only reached its acme 45 ka ago. That assumption, at least by Boehm, is central to notions of how social activities centred on meat sharing may have helped evolve morals, such as altruism and shame (see Boehm, C. 2012. Moral Origins: The Evolution of Virtue, Altruism and Shame. Basic Books, New York). That H.erectus would have been able to harness sufficient energy to kill at a distance casts doubt on such assertions. Mere foraging does not require throwing-capable physiology, so how it evolved in early humans with neither the inclination nor bodies to at least begin throwing projectiles at potential prey is something that school might consider.
Around 3.6 Ma ago a large extraterrestrial projectile slammed into the far north-east of Siberia forming crater 16 km across. The depression soon filled with water to form Lake El’gygytgyn, on whose bed sediments have accumulated up to the present. A major impact close to the supposed start of Northern Hemisphere glacial conditions was a tempting target for coring: possibly two birds with one stone as the lowest sediments would probably be impact debris and boreal lake sediments of this age are as rare as hens’ teeth. The sedimentary record of Lake El’gygytgyn has proved to be a climate-change treasure trove (Brigham-Grette, J and 15 others 2013. Pliocene warmth, polar amplification, and stepped Pleistocene cooling recorded in NE Arctic Russia. Science, v. 340, p. 1421-1426).
Lake El’gygytgyn impact crater. (credit: Wikipedia)
The team of US, Russian, German and Swedish scientists discovered that the sedimentary record was complete over a depth of 318 m and so promised a high resolution climate record. The striking feature of the sediments is that they show cyclical variation between five different facies, four of which are laminated and so preserve intricate records of varying weathering and sediment delivery to the lake. The sediments also contain pollens and diatom fossils, and yield good magnetic polarity data. The last show up periods of reversed geomagnetic polarity, which provide age calibration independent of relative correlation with marine isotope records.
A host of climate-related proxies, including pollen from diverse tree and shrub genera, variations in silica due to changes in diatom populations and organic carbon content in the cyclically changing sedimentary facies are correlated with global climate records based on marine-sediment stable isotope. These records reveal intricate oscillations between cool mixed forest, cool coniferous forest, taiga and cold deciduous forest, with occasional frigid tundra conditions through the mid- to late Pliocene. Compared with modern conditions NE Siberia was much warmer and wetter at the start of the record. Around the start of the Pleistocene sudden declines to cooler and drier conditions appear, although until 2.2 Ma ago average summer conditions seem to have been higher that at present, despite evidence from marine proxies of the onset of glacial-interglacial cycles in the Northern Hemisphere.
In detail, Lake El’gygytgyn revealed some surprises including rapid onset of a lengthy cold-dry spell of tundra conditions between 3.31 to 3.28 Ma. The first signs that the lake was perennially frozen appear around 2.6 Ma, well before evidence for the first continental glaciation in North America, presaged by signs around 2.7 Ma that winters consistently became colder than present ones. Overall the lake record presents a picture of a stepped shift in climate in the run-up to the Great Ice Age. Lake El’gygytgyn seems set to become the standard against which other, more patchy records around the Arctic Ocean are matched and correlated. Indeed it is the longest and most detailed record of climate for the Earth’s land surface, compared with 120 and 800 ka for the Greenland and Antarctic ice-caps.
Modelling their findings against likely atmospheric CO2 levels the authors provide grist to the media mill which focuses on how the late Pliocene may be a model for a future warm Earth if emissions are not curtailed, with visions of dense polar forests
For half a century the Earth’s planetary dynamism – plate movements, mantle convection and so on – has been ascribed to its abundance of water. Experiments on the ductility of quartz seemed to show that it became much weaker under hydrous conditions, and that was assumed to hold for all common silicates, a view backed up by experiments that deformed minerals under varying conditions. It was widely believed that even a few parts per million in a rock at depth would weaken it by orders of magnitude, a view that increasingly dominated theoretical tectonics on scales up to the whole lithosphere and at different mantle depths. Strangely, the founding assertion was not followed up with more detailed and sophisticated work until the last year or so. Though rarely seen in bulk, the dominant mineral in the mantle is olivine and that is likely to be a major control over ductility at depth, in plumes and other kinds of convection.
Peridotite xenoliths —olivines are light green crystals, pyroxenes are darker. (credit: Wikipedia)
Experimental work at the temperatures and pressures of the mantle has never been easy, and that becomes worse the more realistic the mineral composition of the materials being investigated. High-T, high-P research tends to focus on as few variables as possible: one mineral and one variable other than P and T is the norm. This applies to the latest research (Fei, H. et al. 2013. Small effect of water on upper mantle rheology based on silicon self-diffusion coefficients. Nature, v. 498, p. 213-215) but the measurements are of the rate at which silicon atoms diffuse through olivine molecules rather than direct measurements of strain. The justification for this approach is that one of the dominant processes involved in plastic deformation is a form of structural creep in which atoms diffuse through molecules in response to stress – the other is ‘dislocation creep’ achieved by the migration of structural defects in the atomic lattice.
Contrary to all expectations, changing the availability of water by 4 to 5 orders of magnitude changed silicon diffusion by no more than one order. If confirmed this presents major puzzles concerning Earth’s mantle and lithosphere dynamics. For instance, the weak zone of the asthenosphere cannot be a response to water and nor can the relative immobility of hotspots. Confirmation is absolutely central, in the sense of repeating Fei et al.’s experiments and also extending the methods to other olivine compositions – magnesium-rich forsterite was used, whereas natural olivines are solid solutions of Mg- and Fe-rich end members – and to materials more representative of the mantle, e.g. olivine plus pyroxene as a minimum (Brodholt, J. 2013. Water may be a damp squib. Nature, v. 498, p. 18-182)
For those of us living in what was the heart of Pangaea – Europe and North America – more than 250 Ma ago this item’s title might seem like the ultimate truism. However, despite our vision of desert dune sands and evaporating inland seas, glaciation blanketed much of the Gondwana part of the supercontinent until the Middle Permian then lying athwart the South Pole. That would go a long way to accounting for extreme dryness at low to mid-latitudes, especially in the deep interior of Pangaea, but just how hot might tropical climates have been? The deglaciation of Gondwana was abrupt and has been touted as an analogue for a possible anthropogenic closure to the Cenozoic glacial epoch that began around 34 Ma in Antarctica and has periodically gripped land at northern latitudes as low as 40°N for the last 2.5 Ma. Since the present distribution of continents is totally different from the unique pole-to-pole shape of Pangaea, that is probably a view that is not widely held by palaeoclimatologists. Nonetheless, getting hard data on Permian conditions has an intrinsic interest for most geoscientists.
Playa lake in Death Valley, USA (credit: Wikipedia)
One of the best ways of measuring past temperatures, whether surficial or deep within the crust, almost directly is based on fluids trapped within minerals formed at the time of interest. In Permian strata there is no shortage of suitable material in the form of evaporite minerals, especially common salt or halite. A distinctive chevron-like texture develops in halite that forms at the water-atmosphere interface in playa lakes that dry out every year. When thin sections of samples that contain fluid inclusions are slowly heated the air bubbles trapped in salt during crystallisation gradually homogenise with the other trapped fluids. Based on samples that have formed at the present day under a range of air temperatures, the temperature of homogenisation indicates the prevailing air temperature accurately. So well, in fact, that it is possible to assess diurnal temperature variations in suitable halite crystals.
Results have been obtained from Middle Permian halites in Kansas, USA (Zambito, J.J. & Benison, K.C. 2013. Extremely high temperatures and paleoclimate trends recorded in Permian ephemeral lake halite. Geology, v. 41, p. 587-590). In part of the section studied air temperatures reached 73°C, compared with a modern maximum of 57°C recorded in halites from the playas of Death Valley. Moreover, they exhibit changes of more than 30°C during daily cycles. But that kind of weather is common in other hot dry areas today, such as the Dasht-e Lut in eastern Iran. Also, the full data show crystallisation at lower temperatures (maxima of 30-40°C) in part of the sequence. What is noteworthy is that these data are the first quantitative indicators of weather before the last 2.5 Ma. Since evaporites extend back into the Precambrian, the method will undoubtedly extend accuracy and precision to paleoclimate where only proxies and a modicum of guesswork were previously available.
Mass extinctions and smaller but significant die-offs in the marine and terrestrial domains have been linked in the geoscientific imagination with many things: asteroid impacts; gamma-ray bursts from distant supernovae; belches of methane from the sea floor; emissions of hydrogen sulfide gas from seawater itself during ocean anoxia events; sea-level changes and more. The most intriguing, since it suggests a causal link between the core-mantle boundary and the biosphere, is the influence of flood basalt events and the gases, both greenhouse and toxic, that they undoubtedly released.
The famous K-T extinction (now K-Pg since the Palaeogene became the Period following the Cretaceous rather than the Tertiary) has swayed back and forth between the Chicxulub impact in Mexico’s Yucatán Peninsula and the flood basalts of the Deccan Traps in western India as likely mechanisms, Chicxulub currently being in pole position. The equally devastating event at the close of the Triassic (at 201 Ma) that presaged the rise of the dinosaurs has had a similar external versus internal causality controversy, both the Rochechouarte crater and the Central Atlantic Magmatic Province being candidates.
CAMP flood basalts in Morocco (credit: Wikipedia)
Rochechouarte, however, was nowhere near as energetic an event as the Chicxulub impact. The problem is, as with all events for which the weight of evidence points to very short time scales – of the order of tens to hundreds of thousand years, is the dating of candidate causes. Rochechouarte happened at 201±2 Ma: it may or may not have coincided with faunal change. Yet timing of the CAMP flood basalts has hitherto been even more coarsely tagged. This imprecision is not unconnected with the choice of radiometric dating methods, the 40Ar/39Ar approach being ‘easy’ and hence popular, but limited in its precision and accuracy. The ‘gold standard’ is zircon U-Pb geochronology that depends on the far greater reluctance of the host mineral to lose either parent or daughter isotopes compared with the feldspars, micas and amphiboles used in many other methods. Zircon still in its igneous parent is crucial: it is so durable that vastly older zircons are often found in sediments. Yet basalts contain few zircons.
Zircon crystal under the microsope; length about 250 µm. (Photo credit: Wikipedia)
Zircon geochronology has now emerged from the CAMP flood basalts of eastern Canada, the Atlantic seaboard of the US and that of Morocco, which has a precision of around 30 ka, one to two orders of magnitude better than other methods (Blackburn, T.J. and 8 others 2013. Zircon U-Pb geochronology links the end-Triassic extinction with the Central Atlantic Magmatic Province. Science, v. 340, p. 941-945). The extinction is defined most readily by a sudden change in fossil pollen and spores, possibly within less than 10 ka, as well as extinction of Triassic marine fauna and large numbers of terrestrial reptile and amphibian taxa followed by diversification of early Jurassic dinosaurs. The oldest CAMP basalts are from Morocco immediately above spores of clearly Triassic age; i.e. before the extinction, whereas the basalt flows in Canada and the eastern US (a mere 3 to 13 ka younger)are above the turnover. So, the start of the CAMP flood volcanism brackets the extinction.
But did CAMP cause, indeed could it have caused the extinction? Blackburn and colleagues cannot be certain. A negative carbon-isotope spike associated with the extinction is estimated to have required almost a million km3 of magma to have been erupted almost instantaneously to inject excess CO2 into the atmosphere. The dating suggests four major pulses of eruption in the areas studied spread over around 600 ka, the last three being associated with biological diversification and recovery in the earliest Jurassic. In fact the research seems merely to suggest strongly that flood volcanism accompanied the extinction, but leaves its causing the death toll still an open question.
The CAMP events marked the beginning of Pangaea’s break-up and the formation of Tethys separating Eurasia and North America from the old Gondwana continental mass. That tropical seaway became the site of massive production of marine carbonates, presumably to draw down any carbon dioxide excess in the atmosphere.
The release and exploitation of natural gas from shales using the unconventional means of in situhydraulic fracturing – ‘fracking’ – has had plenty of bad press, including some hammering in Earth Pages. Now, what seems to be a balanced academic review has appeared on-line in Science magazine (Vidic, R.D. et al. 2013. Impact of shale gas development on regional water quality. Science, v. 340, DOI: 10.1126/science.1235009). The review focuses on hazards to groundwater resources from a variety of environmental effects, primarily gas migration, contaminant transport through induced and natural fractures, wastewater discharge, and accidental spills.
Protests against shale gas drilling in Bulgaria (credit: Wikipedia)
Much attention has centred on faulty seals put in place to stop gas escaping from drill targets. Yet fewer than 3% of seals are said to have proved problematic, with some finger-pointing at natural gas leakage from the hydrocarbon-rich shales. After all, there are plenty of natural fractures and completely ‘tight’ stratigraphic sequences are rare. in fact toxic effects of natural gas leakage on surface vegetation have been widely used as exploration indicators for conventional petroleum. The review does point out that there are so few pre-drilling studies of natural leakage that this controversy – including widely publicised blazing household water supplies – can not yet be resolved. Obviously more independent monitoring of areas above prospective shales are essential; but who will fund them? The one well-documented before-and-after study, from 48 water wells in Pennsylvania, USA, showed no change, though it seems that monitoring after fracking was short-lived.
The chemically-charged water used to induce the hydrofracturing obviously leaves an unmistakable mark when leaks occur, and there have been cases of considerable environmental release. The fluids are indeed a wicked brew of acids, organic thickeners, biocides, alkalis and inorganic surfactants, to name but a few infredients. To some extent re-use of such fluids, which are costly, ought to mitigate risks. However, once a shale-gas field is fully developed, large volumes of the fracking fluids remain in the subsurface and may leak into shallow groundwater sources. But what pathways do these fluids follow when they are pumped into shales under very high pressure? The review warns of the lesson of toxic fluid leakage from underground coal mines.
The University of Pittsburgh team who compiled the review usefully outline why shale gas is both profitable and feasible. They deal with what methane does in an environmental chemistry sense. It isn’t a solvent, so carries no other materials such as toxic ions, but its interaction with bacteria creates reducing conditions. A now well-known hazard of subsurface reduction is dissolution of iron hydroxide, naturally an important component of many rocks, that can adsorb a great range of dangerous ions at potentially high concentrations, including those involving arsenic. Reductive dissolution lets such ions loose into natural waters, even at shallow depths. Yet methane is emitted by a host of sources other than hydrocarbon-rich shale: landfill; swamps; other bacterial action; conventional petroleum fields both active and abandoned; and even deep water boreholes themselves. A recent study of groundwater geochemistry in relation to fracking in Arkansas, USA (Warner, N.R. et al. 2013. Geochemical and isotopic variations in shallow groundwater in areas of the Fayetteville shale development, north-central Arkansas. Applied Geochemistry, v. 33, doi/10.1016/j.apgeochem.2013.04.013) does address changes in groundwater chemistry, but not for all the ions cited by the WHO as potential hazards.
Whereas the mechanisms involved in vertical and lateral migration of subsurface fluids are well understood there is little knowledge of natural structural features such as deep jointing, fractures and fault fragmentation that control actual migration from area to area. The use of natural seepage as an exploration guide was largely abandoned when many studies showing apparently high-priority targets proved to be far removed from the actual source of the moving fluids. The most easily investigated route for leakage is the actual ‘plumbing’ that fracking uses. This is held together by cement that high pressures can disrupt before it sets, resulting in leaks. A lot depends on ‘due diligence’ deployed by the contractors, whose regulation can leave a lot to be desired. Vidic and colleagues devote most space to the matter of wastewater and deep formation water, yet make little if any case for routine geochemical monitoring of domestic groundwater supplies in shale-gas fields. Much is directed at the industry itself rather than independent surveys.
People have a keen eye for unusual objects and an even keener one for the aesthetic. Fossil echinoderms with their five-fold starry shape have been enduringly popular as trinkets since the Palaeolithic. Astonishingly, the gravel terrace at Swanscombe that yielded skull fragments of 400 ka Homo erectus plus many Acheulean tools also contained a flint bi-face ‘hand axe’ with a near perfect echinoid in its blunt grip. It cannot be proven, but the object seems to refute the idea that an artistic sense only arose with anatomically modern humans in the last 100 ka. Our immediate ancestors of the Neolithic sometimes took collecting to extremes in graves half full of fossil sea urchins (McNamara, K.J. 2007. Shepherds’ crowns, fairy loaves and thunderstones: the mythology of fossil echinoids in England. In: Piccardi, L. & Masse, W.B. Myth and Geology. Geological Society, London, Special Publication 273, 279–294).
Before the invention of metal smelting native gold, iron and copper appear in the archaeological record, undoubtedly because they look and indeed feel so different from the usual pebbles on the beach or just lying around. It is just that element of the odd that continues to draw people, including scientists, into a perpetually stooped posture when the walk across surfaces scattered with pebbles and boulders. The habit is especially hard to shake off for the meteoriticist whose hunting grounds are desert plains and ice caps where oddities are easy to spot, even when rare. So it is interesting when such dogged searchers encounter evidence of long-dead people having done much the same.
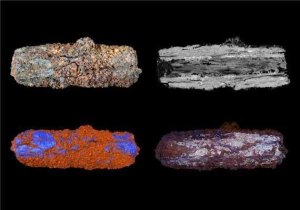
By 5300 years ago people had settled in small farming communities in the Nile Valley eventually to develop on the shores of lake – now represented by several smaller water bodies – what is regarded as the world’s first city near modern Faiyum. These Predynastic people buried their dead nearer to the Nile at Gerzeh, often sending them off with grave goods. The site has been continually excavated by professional archaeologists for more than a century, beginning with Sir Flinders Petrie. Two of the graves contained metallic iron beads, which presented a puzzle as iron smelting is only known from the 6th century BCE onwards. Unsurprisingly, the beads came to be regarded as artefacts wrought from an iron meteorite, though their highly altered nature and intrinsic value thwarted attempts at full analysis. Geochemists from the Open and Manchester Universities, and the Natural History Museum have now resolved the issue (Johnson, D. et al. 2013. Analysis of a prehistoric Egyptian iron bead with implications for the use and perception of meteorite iron in ancient Egypt. Meteoritics and Planetary Science, on-line, DOI: 10.1111/maps.12120). Non-destructive electron microscopy and X-ray tomography reveal, respectively, clear signs of the banded Widmanstätten structures and traces of nickel-rich iron alloy (taenite) that typify iron meteorites but are absent from smelted iron. The beads were clearly beaten and rolled into shape, but this working did not destroy the tell-tale evidence of their origin.
Optical, microprobe and CT-scan images of Predynastic iron bead from the Nile Valley (credit: Open University)
This provenance tallies with the appearance in early New Kingdom hieroglyphs of the term biA-n-pt – literally iron-from-the-sky – which was adopted for smelted iron when first made in the 26 to 27th Dynasties. But pharaonic iron was not a poor relation of gold, regarded as flesh of the gods and hence featuring in the masks of Pharaohs such as Tutankhamen, but supposedly what their bones were made from.
Way back in the mists of time, say around 1970-71, an idea was doing the rounds that because the thermal conductivity of continental crust is lower than that of the ocean floor it should allow thermal energy to build up in the mantle beneath. In turn that might somehow encourage the formation of hot spots and a shallower depth to the asthenosphere: the outcome might be to encourage rifting of weakened lithosphere and ultimately a new round of sea-floor spreading. The case often cited was the Atlantic – North and South – since there are eight hotspots currently on the mid-Atlantic ridge. Africa was another popularised case with a great many broad domes associated with Cenozoic volcanism, and the link between formation of the East African Rift System, hot spots and doming had already been suggested. Africa has barely drifted for around 100 Ma and the domes were supposed to have formed by the build up of heat in the mantle beneath. Geoscience moved on to clearly demonstrate the coincidence of large igneous provinces and flood basalt volcanism with the initiation of Atlantic spreading in the form of the Central Atlantic and Brito-Arctic LIPs during initial opening of the South and North Atlantic at the end of the Triassic and during the Palaeocene respectively. But the role of continental insulation became a bit of backwater compared with notions of mantle plumes emanating at the core-mantle boundary. Well, it’s back.
The Mid-Atlantic Ridge (credit: Wikipedia)
There is now a vast repository of ocean-floor lavas that formed at mid-ocean ridges in the past, thanks to the international Deep Sea and Ocean Drilling Programmes begun in 1968 about when the heyday of plate tectonics really got underway. In the last 45 years there have also been great advances in igneous geochemistry and its interpretation, including relations with mantle melting temperatures. Geochemists at the Friedrich-Alexander-Universiteit in Erlangen, Germany have re-examined the major-element geochemistry of 184 glassy ocean-floor basalts from drill sites of different ages on the floor of the Atlantic Ocean and compared them with 157 from the Pacific. To avoid the possible influence of plume-related heating, the sites were chosen well away from the tracks of existing hot spots. Mantle temperature can be assessed from the sodium and iron content of basalts, Na decreasing with higher temperatures and Fe doing the reverse (Brandl, P.A. et al. 2013. High mantle temperatures following rifting cause by continental insulation. Nature Geoscience, v. 6, p. 391-394). Atlantic samples show increasing Na and decreasing Fe contents in progressively younger basalts, i.e. a trend with time of decreasing mantle temperature such that the oldest (~166 Ma) record 150°C higher mantle temperature than the youngest, with a similar result for the Indian Ocean floor. No such trend is present in samples from the same age range of the Pacific Ocean floor. At around 170 Ma the mid-Atlantic Ridge was close to the continental lithosphere of the Americas and Africa, whereas the East Pacific Rise was at least 2000 km from any continental margin. Younger Atlantic samples formed progressively further from its shores record cooling of the mantle source.
A prediction of the model is that the converse, continental accretion to form supercontinents such as Pangaea, should rapidly have caused considerable warming in the mantle beneath them. This suggests that the formation of supercontinents, or even less substantial continents, should carry the seeds of their re-fragmentation, as Africa is currently demonstrating by the separation of Arabia since the Red Sea began to open some 15 Ma ago, which Somalia and much of eastern Kenya and Tanzania seem destined to follow once the East African Rift System ‘gets steam up’.
Related articles
Langmuir, C. 2013. Older and hotter. Nature Geoscience, v. 6, p. 332-333
Around 73 thousand years ago a supervolcano in Sumatra erupted on a scale unprecedented in the last 2 million years. It left a 100 by 30 km elliptical caldera now occupied by Lake Toba, and explosively ejected 2800 of magma, about 800 km3 falling as ash as far afield as the Greenland ice cap. Although ice-core records show little if any sign of associated climate change in polar regions, the vast amount of ash and sulfate aerosols blasted into the stratosphere must have had some ‘global winter’ effect. Large areas of South Asia were blanketed by thick beds of ash. Human migration from Africa into Eurasia was probably underway at the time, indeed stone tools are found directly beneath and above the Toba ash in southern India and Malaysia. Some palaeoanthropologists have seen the stresses imposed by the Toba eruption as possible means of reducing the entire human population to a mere few thousand: a genetic ‘bottleneck’ that could have led to rapid evolution among surviving generations that may have shaped changes in human behaviour and culture.
Landsat image of Lake Toba, the largest volcanic crater lake in the world. (credit: Wikipedia)
There is a widening range of views on the climate changes that may have followed Toba. It has even been suggested that global mean surface temperature fell by as much as 10°C (Robock, A. et al. 2009. Did the Toba volcanic eruption of ∼74 ka B.P. produce widespread glaciation?Journal of Geophysical Research: Atmospheres, v. 114, DOI: 10.1029/2008JD011652), although not so far as to produce a worldwide glacial surge but sufficient to devastate vegetation. This bleak look back to a critical point in human affairs resulted from modeling of the effects of a global reflective cloud of ash and sulfate. A later modeling study factored in particle and aerosol sizes (Timmreck, C. et al. 2010. Aerosol size confines climate response to volcanic super-eruptions. Geophysical Research Letters, v. 37, doi:10.1029/2010GL045464) to give a less dramatic, but still severe maximum global cooling due to Toba of ~3.5°C.
The focus has now shifted from modelling to a more direct look at the environmental effects of the Toba super-eruption, preserved in sediments beneath Lake Malawi in southern Africa (Lane, C.S. et al. 2013. Ash from the Toba supereruption in Lake Malawi shows no volcanic winter in East Africa at 75 ka. Proceedings of the National Academy of Science, v. 110, doi/10.1073/pnas.1301474110). The sediments contain a thin ash layer that is very different from those produced by East African Rift volcanism but chemically and texturally similar to the Toba ash from the Indian Ocean and India. The sediments, diatom fossils and chemical biomarkers immediately above the ash show little sign of a significant temperature fall. At most it records a 1.5°C fall, and the authors conclude little chance of a human genetic bottleneck among Africans living at the time.
There is clearly a conflict between results of modeling and real-world climatic data, which is interesting in its own right. But the Malawi findings do not rule out ‘bottlenecks’ resulting from severe stress in South Asia where the ash itself would have severely affected game and vegetation for long enough to face migrating human bands with the prospect of starvation. Obviously, some survived to move on and to leave their tools behind on top of the Toba Ash.
Australopithecus sediba 1 (MH1) left, Au. afarensis( AL 288-Lucy) centre and Au. sediba 2 (MH2) right. (credit: L. R. Berger, University of the Witwatersrand, via Wikipedia)
The remarkable find of two well-preserved skeletons of a 2 Ma hominin in a South African cave in 2008 and publication of their preliminary analysis in 2011 seemed set to shake up human origins research. There was a more or less complete hand – indeed an entire arm and shoulder – a lower leg with ankle bones, a near-complete head and lots more besides. Most was from one female individual, but significant bits from two others that allowed a well-supported reconstruction of the new species Au. sediba. The discoverer, Lee Berger of The University of the Witwatersrand, South Africa (well he initiated the dig, but his young son found the first critical material) is so excited 5 years on that he uses hip-hop phraseology, she ‘got swag’, presumably assuming that means pretty cool (Gibbons, A. 2013. A human smile and funny walk for Australopithecus sediba. Science, v. 340, p. 132-133), but on the street there are other meanings and attitudes towards the phrase and unwary use is not advised.
More details now have emerged in a special issue of Science introduced by Berger in less fulsome language (Berger, L.R. 2013. The mosaic nature of Australopithecus sediba. Science, v. 340, p. 163). As the title suggests, the surprise lies in almost every critical part of the species. Although the spine shows curvature (lordosis) needed for an animal evolved from a quadruped to bipedality in order to balance when upright, the ankle bone is unlike the flat-based human one, being pointed as is that of chimpanzees. As a result walking would have involved an unusual and perhaps unsteady gait; the individuals did fall over into a death pit and one commentator thought the gait might have seemed ‘provocative’. An unusual knee bone is thought to be an evolved countermeasure to such exaggerated mincing. Despite the very human-like hand, extremely long arms and shoulders remarkably like those of the favoured jacket of a star of the BBC series The Dragons’Den point to habitual clambering in trees. Authors of a report on dentition suggest a close similarity to that of the Au. africanus, living at the same time and also found in the same system of fossil-rich caves north-west of Johannesburg, South Africa. Controversially, the tooth team suggests a closer similarity of both to early Homo species than to earlier australopithecines in East Africa, which would shift the focus of human origins to southern Africa. Counter to that view is a find of 400 ka-older, putative human remains in Ethiopia. Yet they take the form of a lower jaw that resembles that of Au. sediba.
The emerging, more detailed picture is not tidy, as suspected from early examination of the Malapa hominins. One thing is for sure, the South African caves are being swarmed over, which paid dividends in 2011 just 15 km from the Malapa cave with another embarrassment of riches at Sterkfonein in the form of abundant foot bones of a currently un-named species of roughly the same age. Things are beginning to take on an element of national pride, with ‘The Birthplace’ at stake: Kenya, Tanzania, Ethiopia or South Africa?
Time Lord, possibly outside the offices of the International Commission on Stratigraphy (credit: Sorcyress via Flickr)
Because it is the ultimate historical discipline, the essence of geology centres on time, measuring its passage and establishing correlations in time on a global scale so that an interlinked story of Earth evolution can be told. In fact geology is not just about a record of what happened in the four dimensions of place and time; it is a great deal more multidimensional, involving temperature, strain, chemistry, erosion, deposition, sea-level , the course of life and much more besides. Ever more multifaceted and, sadly, divided into subdisciplines and interfaces with other aspects of natural science that few if any individuals can grasp, an almost legally enforceable set of rules is needed to keep the order orderly. Unlike history and more akin to archaeology geological time is of two kinds, its precisely quantitative measure being a relative newcomer.
Since it emerged in the Enlightenment that began in the late 17th century geology has been dominated by a relative sense of timing: Steno’s Law of Superposition, and those relating to deformation, igneous eructations, erosion and deposition, first addressed systematically by James Hutton, being the most familiar. The notion of an absolute time scale into which events separated relative to one another could be fitted with confidence is a real latecomer. Although first attempted between 1650 and 1654 by Archbishop of Armagh James Ussher – he reckoned from the Old Testament that everything began at dusk on Saturday 22 October 4004 BCE – the only useful and broadly believable approach to absolute time has been based on the decay of radioactive isotopes incorporated into minerals once they had formed within a rock. But that is no panacea for the simple reason that most of them form through igneous or metamorphic processes and only rarely in the course of sedimentation. It also has only become reliable and precise in the last two or three decades.
Tying together global records of all the kinds of process that have made, shaped and changed the Earth has therefore become an increasingly complex blend between local relative dating, burgeoning regional to global means of correlation and the odd point in absolute time. What has arisen is a dual system that, if truth were told, is often used in a cavalier fashion. Equally to the point, the rules have of late become unfit for purpose and are in need of revision, which is a task for the Time Lords, properly known as the International Commission on Stratigraphy (ICS). The trouble is, the rules have themselves evolved somewhat episodically while their subject is appropriately in continual motion and change, if not anarchic. To the outsider things can seem very odd indeed. Most reasonably well-read souls will have heard of the Cambrian and the Jurassic, largely because of the popularity of trilobites that blossomed in the one and dinosaurs that strutted the land in the other. What is less well known is that the two names have different usages as adjectives: one to signify an interval of time called a Period, the other a System of essentially piled-up sedimentary rocks.
There are greater dualisms that group the Period/System divisions: the largest Eon/Eonothem groupings of Archaean, Proterozoic and Phanerozoic; the Era/Erathem signifiers such as Palaeoproterozoic, Mesozoic and Cenozoic. Incidentally, the time between the formation of the Earth and the first palpable rocks, from about 4550 to 4000 Ma, has been called the Hadean but has no designated status, possibly because it has no rock record whatsoever. Divisions of Periods/Systems apply only to the time since fossils became abundant 541 Ma ago, and in order of fineness of division are Epoch/Series and Age/Stage. Example of the first can be Lower, Middle and Upper – to spice things up, Middle maybe omitted from some Periods/Systems – or they might be given names derived from type areas, such as the ever popular Llandovery at the base of the Silurian Period/System. Helpfully, the Cambrian contains Terreneuvian, Series 2, Series 3 and Furongian from early to late/bottom to top. The final global division has always floored undergraduates and shows little sign of relief – there are a great many Ages/Stages, in fact a round 100 (I may have miscounted), 98 with names, 2 currently unnamed and 4 in the Cambrian called Stages 2 to 5: confusing, that… has anyone spoken of the Stage 3 Stage or the Stage 5 Age of the Cambrian?
Worryingly, in my hasty overview of the ICS International Stratigraphic Chart above I have reversed the official designation of chronstratigraphic/geochronological nomenclature: is this likely to have me committed to the geoscientific equivalent of Guantanamo Bay, or merely limbo?
I have by no means exhausted officialise. Readers may not be surprised to learn that the Time Lords have bent Heaven and Earth literally to concretise the double entendres of geology. The base of almost every Age/Stage in the Phanerozoic Eonothem/Eon is defined at a suitably agreed point on the ground by, in a few cases, a real golden spike (I may be mistaken on this, as the only one I tried to visit was at the base of a Welsh cliff suitable only to be visited by – in the timeless phrase – ‘a strong party’). More prosaically there are monuments of various ethically appealing designs that go by the sonorous name Global Boundary Stratotype Section and Point. I have it on reasonably good authority that ICS delegates have, on occasion, needed to be physically restrained from fist fights over which nation shall host a particular GSSP (the ‘B’ in the acronym is aspirated).
This is the point that all readers will have been waiting for: it has been suggested to ICS that the whole edifice is looked at very closely and perhaps revised (Zalasiewicz, J, et al. 2013. Chronostratigraphy and geochronology: A proposed realignment. GSA Today, v. 23 (March 2013), p. 4-8). For professionals this is an obligatory read, for others optional: there is no excuse as it is downloadable for free – click on the title. While you are about it, you can also download from GSA Today the famous proposal for an entirely new series/epoch called the Anthropocene (see also A sign of the times: the ‘Anthropocene’ in EPN issue of May 2011)
A press release from the Max Planck Institute for Evolutionary Anthropology in Leipzig, Germany, announces the completion of the most precise genome from a third Neanderthal individual. For the first time it is possible to distinguish copies of the genes inherited by the individual from both parents. The data release coincided with a review of genetic evidence for interbreeding between early Homo sapiens and other species.
Modern human migration out of and within Africa relative to the domains of coeval archaic humans 1 = modern humans 2 = Neanderthals 3 = other archaic humans (credit: Wikipedia)
One of the key areas for unravelling the range of tectonic processes involved in the assembly of continents lies in the Western Cordillera of North America, made up of dozens of slivers of mutually exotic terranes. Their exposed upper parts remain largely intact and are dateable using fossils or radiometric dating. Through assiduous palaeomagnetic research it is sometimes possible to chart their motions over time to see the manner in which they approached and collided with one another. Geoscientists are now able to link such a complex process with underlying tectonics, not by inference but through direct seismological observation of the remains of subducted slabs in the mantle deep beneath.
The crumpled Farallon Plate beneath North America, colours showing different depths in the mantle (credit: Karin Sigloch)
This item can be read in full at Earth-logs in the Tectonics archive for 2013
Much attention has centred on fracking shales to release otherwise locked-in gas, while production of liquid petroleum by the same kind of process is also increasing with little publicity, especially in the US. From a purely economic standpoint wells that yield oil and gas from fractured shale might seem to be quite a boon. Well, they probably are, if the gas can be sold. One of the biggest shale-oil targets is the Late Devonian to Early Carboniferous Bakken Shale in the Williston Basin that stretches across 360 thousand km2‑ beneath parts of the Dakotas, Wyoming and Montana in the US and Saskatchewan in Canada. This shale is the source rock for most of the conventional oil production from the Williston basin since the 1940s. At the start of the 21st century direct production of oil from the Bakken began in North Dakota, unleashing a major drilling boom and a ten-fold increase in land-leases for production. The state is now the second largest US oil producer after Alaska warranting a major feature National Geographic. Trouble is North Dakota is not well served by pipelines of any kind and oil is shipped by rail, much as it was in the early days of the US oil industry.
Typical natural gas flare with black-carbon plume (credit: Wikipedia)
The natural gas released by fracking is simply wasted, partly by flaring at the wellhead but an unknown volume of pure methane is simply vented to the atmosphere. At rough 25 times the greenhouse warming capacity of CO2 the perverted economics of waste methane is, unsurprisingly, becoming scandalous and increasingly dangerous. Such is the magnitude of shale-gas production in the US the price of natural gas has fallen dramatically so that from the Williston Basin simply carries no profit and therefore has nowhere to go except up in flames or directly to the air. The US Environmental Protection Agency apparently can do little to halt the venting. British onshore source rocks, such as the Upper Jurassic Kimmeridge Shale, which has a hydrocarbon content up to 70% and is regarded as the most important rock in Europe being the source for much of the petroleum beneath the North Sea and other oil provinces, are likely targets for fracking now the UK government has given the go-ahead in a new ‘dash for gas’. Chances are it may become a dash for onshore shale-oil .
Manganese nodules finally tagged for production
Manganese nodules taken from the bottom of the Pacific. (credit: Wikipedia)
Almost 40 years ago my desk was almost buried under tomes of information about dull black nodules looking like blighted potatoes as I worked on the now abandoned Level-2 Open University course on The Earth’s Physical Resources. Made mainly out of manganese and iron minerals they also contain ore-grade amounts of nickel, copper and cobalt together with other metals. Were they beneath the crust they would be mined eagerly, but such manganese nodules litter vast areas at the surface of the oceans’ abyssal plains. Such was their potential that around half a billion dollars was spent on oceanographic and geochemical surveys to map the richest nodule fields. Part of the attraction at a time when the non-renewable nature of conventional metal deposits was touted as a threat to civilisation as we know it, as in The Limits to Growth, was that the nodules were zoned and clearly growing: they appear to be renewable metal resources.
Mining them is likely to be hugely costly: they will have to be dredged or sucked-up from the deep ocean basins; intricate metallurgical methods are needed to separate and smelt the paying metals and the risks of deep-sea pollution are obvious. As with shale gas, the UK Tory premier David Cameron has leapt onto Lockheed Martin UK’s announcement that it is finally profitable to get at the nodules, in the manner of the proverbial ‘rat up a drainpipe’. Cameron believes that the venture to harvest one of the most metalliferous patches on the east Pacific floor off Mexico may rake the UK’s economic potatoes out of the fire to the tune of US$60 billion over the next 30 years. Lockheed Martin is an appropriate leader in this scramble having designed some of the equipment aboard a ship financed by Howard Hughes, the 50 thousand tonne Glomar Explorer. A curious vessel, the Glomar Explorer was widely publicised in the mid-70s as the flagship for a manganese nodule pilot project. In fact it was built to snaffle a Soviet submarine (K-129) and its contents of codebooks, technical equipment and nuclear missiles that sank to the abyssal plains in the Pacific about 2500 km to the north-west of Hawaii. It did grapple the submarine, some cryptographic equipment, a couple of nuclear tipped torpedoes and six of the dead crew members. It is still operational, but as an ultra-deep water drill rig.
We will have to wait to see if nodule mining is a ‘go-er’, and very little information has emerged about methodology. The target metal is probably nickel with its importance in rechargeable batteries, plus rare-earth metals that are in notoriously short supply. Whether or not raking, dredging or sucking-up the nodules will have insupportable environmental impact depends on the amount of on-board processing; the nodules themselves are pretty much insoluble. Extracting and separating the metals will probably involve some kind of solution chemistry rather than the beneficiation common in most on-shore metal mines. Such hydrometallurgy has considerable potential for pollution, unless the raw nodules are shipped to shoreline facilities, at a hefty cost. One thing occurred to me while writing about manganese nodules as a major resource was that their blends of metals would not match the proportions actually required in commerce. On a grand scale their exploitation could well play havoc with currently booming metal prices and drive on-shore mining to the wall. But, to be frank, I think this is a bit of tropical sea-bed bubble fraught with legal tangles connected with the United Nations Convention on the Law of the Sea.
At first reading this item’s title might seem to convey nonsense, yet there is an interesting relationship between these two very different disciplines. It concerns the pillaging of South and Central America by conquistadors who followed Columbus’s pioneering route across the North Atlantic in 1492. Aside from glory their motive was profit, and that was most conveniently concentrated in the form of gold and silver, to be found in abundance among the native people of what came to be known as the Americas. Once such plunder declined silver ores were soon discovered in Peru and Mexico, thereby maintaining the supply. Bullion or plate – so named from the fact that precious metal was most often transported in the form of sheets – was the major cargo of the great treasure ships in the period from 1515 to 1650. It is remembered in such geographic names as the Rio de la Plata separating modern Argentina and Uruguay.
Klaus Kinski, well into his role as an insane conquistador, disputes the script with director Werner Herzog while shooting “Aguirre, The Wrath Of God” (credit: Flickr p373)
It might seem that when such a vast amount of loot entered Europe the buying power of silver in particular would have fallen to result in inflation in the price of basic commodities, much as printing paper money may have that result nowadays. Indeed, over those roughly 150 years prices increased by as much as five times. Another factor was a tendency for silver supply to be augmented simply by debasing newly minted currency with other metals. Yet another is that over the same period China adopted silver as a money commodity increasing demand and so spurring exploration and advances in metallurgical extraction from new ores. Furthermore, the entire fabric of economy in Europe began to shift as feudalism began to be supplanted by capitalism at the close of Medieval times. The sheer complexity of competing factors has made the so-called ‘Price Revolution’ of the 16th and 17th centuries a thorny issue for economic historians. This is where geochemists found that they had a ‘shout’ in what Thomas Carlisle dubbed the ‘dismal science’.
Silver ores also contain lead and copper, which inevitably contaminate silver metal extracted from them. Depending on the processes involved in mineralisation the abundances of both metals vary from mine to mine. More tellingly, so do the relative proportions of the different Pb and Cu isotopes, Pb isotopes reflecting the age of the rocks in which ores are found. Inherited by coinage, the isotopes can be used to assess provenance of coins (Desaulty, A.-M. & Albarede, F. 2013. Copper, lead and silver isotopes solve a major economic conundrum of Tudor and early Stuart Europe. Geology, v. 41, p. 135-138), while the dates embossed on coins at the mint potential chart the course of the bullion trade. Desaulty and Albarede show that silver from the vast Potosí mine in modern Bolivia opened by conquistadors barely shows up in British coinage of the period, which is dominated with Mexican isotopic signatures as well as those from European mines. The latter account almost exclusively for the coinage of the late Medieval period. The conclusion is that the huge potential of Potosí served the needs of Spanish entrepreneurs though a trans-Pacific Spanish trade in which Bolivian silver bought goods from China, including gold. Spanish coins, on the other hand, show little of either Bolivian or Mexican silver, suggesting that Spanish world trade may well have used American bullion directly to purchase goods throughout its sphere of influence centred on the Philippines, while Mexican silver engaged in European trade and also found its way into the British economy by way of the slave trade.
Although Desaulty and Albarede claim to have solved a ‘conundrum’ it seems more likely that their revelations will make historians of post-Medieval economics scratch their heads even more.