Is there a future for coal?

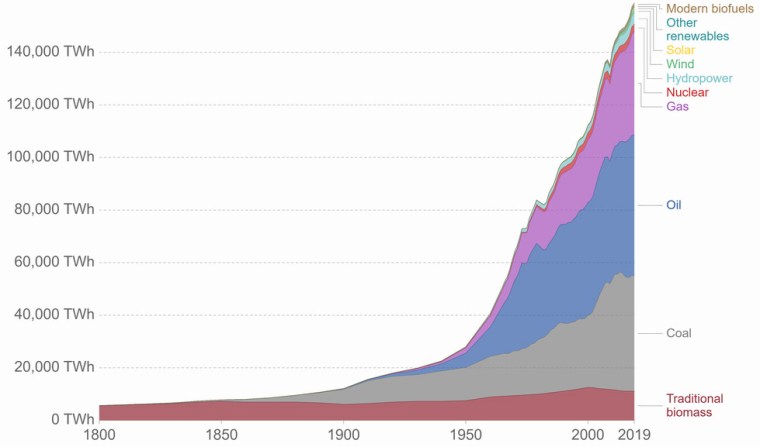
Burning coal is far and away the main culprit for elevated atmospheric CO2 and global climatic warming. That is a consequence of the Industrial Revolution and a mode of production that centres on the market value of commodities rather than their intrinsic usefulness and thus on the continual generation of profit. As the main original energy source for this capitalist mode, whose viability depends on incessant economic growth, world coal production grew at an exponential rate through the 19th and 20th centuries, as did its influence on global climate. Beginning in the 1920s, coal was joined by other carbon-based fossil fuels (oil and natural gas) in massively increasing energy and greenhouse-gas production. In the data there is little sign of an appetite to reduce this dependence on carbon burning, renewable energy output accounting today for only a few percent of the energy demands of capital. Although coal’s energy contribution is flattening off to be replaced by those of oil and gas, in terms of CO2 emissions it still dominates. That is because oil and gas are carbon-hydrogen compounds rather than almost pure carbon in the case of coal. Unless burning fossil fuels is outlawed and economic growth is drastically curtailed, we are set to live on a far warmer planet.

Growth in energy supply from different sources since 1800 CE (Credit: ourworldindata.org)

For various reasons coal is unique in a social sense. Every producing area has large communities who depend on mining for income. Britain now produces vastly less coal than it did up to the 1990s, with wholesale closure of underground mines. Since 1960 these communities have lost over half a million jobs in mining, let alone those in related industries and those that served mining communities. Three decades on from the last round of closures, those communities remain socially devastated in many respects. A huge amount of coal still lies beneath them. Can it make a come-back? A recent study suggests that perhaps it can, with diametrically opposite environmental consequences.

It seems that surfaces of coal particles are able to take-up and store gases, increasingly so as pressure increases. Miners faced the consequences of that in the form of adsorbed carbon dioxide and methane (‘choke damp’ and ‘fire damp’) that were released when coal was mined underground. Miners’ safety lamps (invented in 1815 by Humphry Davy) enable them to monitor the risks of suffocation by CO2 or explosion of CH4 when the lamps dim or flare, respectively. Engineers at Edith Cowan University in Perth, Western Australia, experimentally measured the amounts of hydrogen adsorbed by crushed coal at different pressures (Iglauer, S et al. 2021. Hydrogen adsorption on sub-bituminous coal: Implications for hydrogen geostorage. Geophysical Research Letters, v. 48, article 2021GL092976; DOI: 10.1029/2021GL092976). From surface atmospheric pressure to 40 times that, adsorption increases rapidly, especially for hydrogen (from 0.05 to 0.25 grams per kilogram). At higher pressures it rises less rapidly to about 0.6 g kg-1 at 100 times atmospheric pressure, which is equivalent to a depth of about 500 m in a sedimentary rock formation. At deeper levels hydrogen adsorption remains about the same.

The experimental results suggest that large amounts of hydrogen can be stored in coal at quite shallow depths. The potential storage in a ton of fractured coal is about 600 kg, equivalent to about 12 cubic metres of liquid hydrogen, but without the need for containment and refrigeration. In the absence of oxygen, such storage would be safe and long-term. If feasible from an engineering standpoint, underground storage of hydrogen in coal seams to overcome one of the current barriers to a hydrogen-based industrial economy through the storage of energy generated by carbon-free technologies, such as wind, wave, tidal and solar generation that operate at highly variable rates, not suited to energy use patterns. Effectively, coalfields could become giant ‘batteries’ without the need to mine vast amounts of elements, such as lithium, needed for conventional batteries; provided that a sustainable means of repeated hydrogen recovery can be devised. A central technology of a future ‘hydrogen economy’ is that of the fuel cell in which hydrogen and oxygen combine using a catalyst to generate electricity, without any combustion and emitting only water vapour.

Volcanism and the Justinian Plague

Between 541 and 543 CE, during the reign of the Roman Emperor Justinian, bubonic plague spread through countries bordering the Mediterranean Sea. This was a decade after Justinian’s forces had had begun to restore the Roman Empire’s lost territory in North Africa, Spain, Italy and the present-day Balkans by expeditions out of Byzantium (the Eastern Empire). At its height, the Plague of Justinian, was killing 5000 people each day in Constantinople, eventually to consume 20 to 40% of its population and between 25 to 50 million people across the empire. Like the European Black Death of the middle 14th century. The bacterium Yersinia pestis originated in Central Asia and is carried in the gut of fleas that live on rats. The ‘traditional’ explanation of both plagues was that plague spread westwards along the Silk Road and then with black rats that infested ship-borne grain cargoes. Plausible as that might seem, Yersinia pestis, fleas and rats have always existed and remain present to this day. Trade along the same routes continued unbroken for more than two millennia. Although plagues with the same agents recurred regularly, only the Plague of Justinian and the Black Death resulted in tens of million deaths over short periods. Some other factor seems likely to have boosted fatalities to such levels.

407458aa.2
Monk administering the last rites to victims of the Plague of Justinian

Five years before plague struck the Byzantine historian Procopius recorded a long period of fog and haze that continually reduced sunlight; typical features of volcanic aerosol veils. Following this was the coldest decade in the past 2300 years, as recorded by tree-ring studies. It coincides with documentary evidence of famine in China, Ireland, the Middle East and Scandinavia.. A 72 m long ice core extracted from the Colle Gnifetti glacier in the Swiss Alps in 2013 records the last two millennia of local climatic change and global atmospheric dust levels. Sampled by laser slicing, the core has yielded a time series of data at a resolution of months or better. In 536 an Icelandic volcano emitted ash and probably sulfur dioxide over 18 months during which summer temperature fell by about 2°C. A second eruption followed in 540 to 541. ‘Volcanic winter’ conditions lasted from 536 to 545, amplifying the evidence from tree-ring data from the 1990’s.

The Plague of Justinian coincided with the second ‘volcanic winter’ after several years of regional famine. This scenario is paralleled by the better documented Great Famine of 1315-17 that ended the two centuries of economic prosperity during the 11th to 13th centuries. The period was marked by extreme levels of crime, disease, mass death, and even cannibalism and infanticide. In a population weakened through malnutrition to an extent that we can barely imagine in modern Europe, any pandemic disease would have resulted in the most affected dying in millions. Another parallel with the Plague of Justinian is that it followed the ending of four centuries of the Medieval Warm Period, during which vast quantities of land were successfully brought under the plough and the European population had tripled. That ended with a succession of major, sulfur-rich volcanic eruption in Indonesia at the end of the 13th century that heralded the Little Ice Age. Although geologists generally concern themselves with the social and economic consequences of a volcano’s lava and ash in its immediate vicinity– the ‘Pompeii view’ – its potential for global catastrophe is far greater in the case of really large (and often remote) events.

Chemical data from the same ice core reveals the broad economic consequences of the mid-sixth century plague. Lead concentrations in the ice, deposited as airborne pollution from smelting of lead sulfide ore to obtain silver bullion, fell and remained at low levels for a century. The recovery of silver production for coinage is marked by a spike in glacial lead concentration in 640; another parallel with the Black Death, which was followed by a collapse in silver production, albeit only for 4 to 5 years.

Related article: Gibbons, A. 2018. Why 536 was ‘the worst year to be alive’. Science, v. 362,p. 733-734; DOI:10.1126/science.aaw0632

Read more on Geohazards, Magmatism and Palaeoclimatology

The risk of landslides in Africa

The most widespread risk from natural hazards is, with little doubt, that posed by ground instability; landslides and landslips; mudflows; rock avalanches and a range of other categories in which large volumes of surface material are set in motion. They can be triggered by earthquakes, volcanism or heavy rainfall that changes the physical properties of rock and soil. Not only steep slopes pose a risk, for some affect ground with quite gentle topography, as witness the terrible scenes from Sulawesi triggered by the 28 September 2018 magnitude 7.5 earthquake beneath the Minhasa Peninsula. This set in motion mudflows on gently sloping ground when the seismic waves caused liquefaction of unconsolidated sediments that not only shattered dwellings by the lateral motion, but whole communities sank into the slurry with little trace. The rapid events left a death toll confirmed at 2010 people with about 5000 missing, feared to have been swallowed by the earth. In the last 9 months mass movement has resulted in fatalities in many places, the most publicised being in Uganda, Japan, Philippines, Sulawesi, Ethiopia, Sumatra, South India, Bangladesh, California, Nepal, and the list grows as it does every year.

407458aa.2
Types of mass movement (Credit: US Geological Survey

As well as purely natural causes, human activities, such as deforestation, excavations and dumping of materials, greatly exacerbate risks. The South Wales former coal-mining communities commemorate every year the collapse of a mine spoil heap on a steep hillside on 21 October 1966 that engulfed a primary school at Aberfan, killing 116 small children and 28 adults. Wherever they occur, there seems to be little chance of escape for those in their path. Slowly it has become possible for geoscientists to outline areas that are potentially at risk from catastrophic mass wastage, sometimes from the distribution of scars of previous events on remotely sensed images, but increasingly by multivariate analysis of landscapes in terms of the factors that may contribute to future ground failures. The principal ones are: topographic slope and relief; annual rainfall, especially the likely precipitation in a single day; vegetation cover, particularly by trees; strength of surface rock and soils, including degrees of consolidation, interbedding and water content; geological structure, such as the trajectory of faults, degree of  jointing and the dip of strata. Modelling risk has to grapple with the global scale of the problem, which cannot be addressed in the least developed regions by piecemeal local studies, although those are urgent, of course, in areas with recorded instances of catastrophic ground failure. Regional studies can screen vast areas of probably low risk so that meagre resources can focus on those that appear to be most dangerous to populated places.

afr landslide
Degree of risk from landslides of all types in the northern part of the East African Rift System (Credit: Broeckx et al. 2018; Fig. 6)

Belgian engineering geologists and GIS specialists have assembled a monumental risk assessment of Africa, together with a bibliography of all published work on mass movement across the continent (Broeckx, J. et al. 2018. A data-based landslide susceptibility map of Africa. Earth-Science Reviews, v. 185, p. 102-121; DOI: 10.1016/j.earscirev.2018.05.002). They point out that Google Earth’s 3-D viewing potential at fine spatial resolution provides a free and rapid means of mapping scars of previous earth movements in considerable detail over areas that data analysis suggests to be susceptible. Their paper provides continent-scale maps of the parameters that they used as well as maps showing several versions of their risk analysis. The supplementary data to the paper include downloadable, full-resolution maps of landslide susceptibility.

How rich are deep-sea resources?

My first task as a Lecturer in Earth Sciences at the British Open University, from 1971 onward, was to write teaching materials about the economics, formation and geological setting of metal resources. Much of the content was about the full range of ‘conventional’ metal ores, but something being publicised as having huge potential intrigued me. This concerned manganese-rich nodules (with the aesthetic appeal of unwashed potatoes) and crusts found sitting on top of sediments of the abyssal ocean floor, at depths between 3 to 5 kilometres.  While manganese is by no means a rare element and occurs in vast ore reserves on the continents, the nodules contain unusually high concentrations of other, more valuable metals, such as copper, nickel, zinc, cobalt and lead. Some contained more than 3% of Cu, Ni and Co combined, above the ‘grades’ of economic deposits of ores of the individual metals on land. This was the source of their potential: simple, albeit very deep dredging of the nodules would provide multi-metal ore of very high profitability. Moreover, the nodules are in truly vast tonnages (about 10 kg m-2) and continually grow by precipitation from seawater in the underlying sediments at a few millimetres per million years – they are renewable resources.

Manganese nodules taken from the bottom of the...
Manganese nodules from the Pacific abyssal plains. (credit: Wikipedia)

A variety of reasons, not the least of which was the vexatious question of ownership of sea-floor resources far from land, have meant that commercial operations have yet to begin. However, spiralling prices for metals on the world market together with depletion of on-shore, high-grade reserves are beginning to make the opportunity of nodule mining irresistible. Fifteen companies, with licence areas issued by the intergovernmental  International Seabed Authority of around 75 000 km2 each, are now engaged in economic assessment of one of the most remote swathes of the Pacific abyssal plains (Peacock, T. & Alford M.H. 2018. Is deep-sea mining worth it? Scientific American, v. 318(5) (May 2018 issue), p. 63-67). There are several controversial issues surrounding deep-sea mining. First, dredging, like beam trawling disturbs and destroys ocean-floor ecosystems and turns bottom water turbid, the very fine grain size of sediments resulting in settling being very slow ( about 1 mm s-1). Second, preliminary ore processing on board dredging vessels results in plumes of turbid and metal-rich slurry in the wakes, threatening surface and mid-water ecosystems. Such plumes will rapidly spread far from operational areas in surface current systems, eventually to smother pristine areas of ocean floor. Re-examination of areas of experimental dredging from 30 years ago have revealed that they are still sterile of lifeforms larger than 50 micrometres. Added to these effects, onshore processing will produce large amounts of waste – about 75% of the volume of dredged nodules. Conventional mines eventually backfill their excavations, but with nodule mining disposal would be an environmental nightmare.

Japanese sea-floor mining machine. (credit: Japan Times)

Economically, it seems that nodule dredging is potentially highly profitable. To break even requires lifting about a million metric tons, which would yield of the order of 37 000 t of Ni, 32 000 t of Cu, 6000 t of Co and 750 000 t manganese. If all 15 companies begin extraction, production at these levels will have a downward effect on world metal prices, tending to undercut production from conventional mines. One little-considered issue is that the ‘blend’ of metals from nodules will not match the industrial demand for each of them, further destabilising markets. Added to mining of the abyssal plains, plans are well advanced for multi-metal mining of massive sulfide deposits forming at hydrothermal vents or ‘black smokers’ along mid-ocean ridge systems, in which gold figures strongly. Only a few Pacific island states have resisted the ‘promise’ of such operations. Japanese companies are already mining the seabed off Okinawa within their own offshore waters and seemingly are producing zinc equivalent to the country’s annual consumption as well as gold, copper and lead.

Volcano heading for the sea

John Murray of The Open University, UK has been studying Europe’s largest active volcano Mount Etna on Sicily for most of his career. With a group of colleagues he installed high-precision GPS receivers at over 100 stations on the flanks of the mountain. This was to monitor any shifts in elevation and geographic position, which might be related to magmatic events within the volcano, such as inflation and contraction of the magma chamber. Measurements of position gathered annually since 2001 reveal a somewhat alarming picture (Murray, J.B. et al. 2018. Gravitational sliding of the Mt. Etna massif along a sloping basement. Bulletin of Volcanology, v. 80 online, open access; doi /10.1007/s00445-018-1209-1). The edifice is moving relentlessly ESE at 14 mm yr-1, on average, towards the Mediterranean Sea. Research by one of Murray’s co-authors, Benjamin van Wyk de Vries of the Université Clermont Auvergne, established that many volcanoes have associated signs of deformation due to their huge masses. Often, this is a matter of radial spreading that produces thrust-like faults at their base and in the basement on which they grew. In the case of Etna all the annual displacements on its flanks are skewed to the ESE. The researchers are able to show that this is not a case of flank instability that ultimately may result in lateral collapse but the entire volcano is slowly slipping sideways.

English: Mount Etna, Sicily, topped in snow It...
Mount Etna, Sicily, topped in snow (credit: Wikipedia)

An experimental mock up of the volcano– a cone and flanking layers of lava and pyroclastic rocks made of sand on a substrate of putty to represent underlying sedimentary strata – began to slide once it was tilted at a shallow angle. This suggests that the base of the volcano and igneous debris that it has emitted dips gently to the ESE. The underlying materials are poorly consolidated Quaternary sediments, which are likely to be rheologically weak. Geophysics shows that the NW side of the volcano rests on an almost horizontal plateau, the cone itself being above a spoon-like depression, probably produced by the cone’s mass, and the base dips seawards  in the SE sector. It is through this basement that magma makes its way to Etna’s summit vent system, probably along fractures.

The authors warn that such sliding volcanoes are prone to devastating sector collapse on the downslope side, although there are no signs that might be imminent. Yet it will almost certainly have an effect on eruptive activity as the magma conduits are continually changing. Future research needs to focus on periods when there is horizontal contraction on the volcano, as happens during lengthy periods of dormancy – the period for which there are data has been one of expansion.

Large earthquakes and the length of the day

Geoscientists have become used to the idea that long-term global climate shifts are cyclical, as predicted by Milutin Milanković. The periods of shifts in the Earth’s orbital and rotational parameters are of the order of tens to hundreds of thousand years. The gravitational reasons why they occur have been known since the 1920s when Milanković came up with his hypothesis, and they were confirmed fifty years later. But there are plenty of other cycles with shorter periods. The last 115 years of worldwide records for earthquakes with magnitudes greater than 7 whose changing annual frequency shows a clear cyclical period of about 32 years. The records show peaks in 1910, 1943, 1970 and 2011 (see Bendick, R. & Bilham, R. 1917. Do weak global stresses synchronize earthquakes? Geophysical Research Letters, v. 44 online; doi/10.1002/2017GL074934). Unlike Milanković cycles, these oscillations were not predicted, but something synchronous with them must be forcing this behavior: a sort of “cross-talk”. Either global seismicity has a tendency for events to trigger others elsewhere on the Earth or some other process is periodically engaging with major brittle deformation to give it a nudge.

Rebecca Bendick, of the University of Montana, Missoula, and Roger Bilham of the University of Colorado, Boulder used a complex statistical method to check for synchronicity between the seismic cycles and other repetitive phenomena. It turns out that there is a close match with historic data for the length of the day which varies by several milliseconds. At first sight this may seem odd, until one realizes that day length is governed by the Earth’s speed of rotation (about 460 m s-1 at the Equator). The correlation is between increases in both major seismicity and the length of the day; i.e. quakes increase as rotation slows.  Day length can vary by a millisecond over a year or so during el Niño, which involves shifts of vast masses of Pacific Ocean water that affect rotation. But what of larger changes on a three-decade cycle? Seismic events and the forces that they release result from buildup of strain in the lithosphere, so the episodic earthquake maxima require some kind of transfer of momentum within the Earth. It does not need to be large, as the Milanković astronomical forcing of climate demonstrates, just a regular pulse.

One possibility is that, as rotation decelerates, decoupling between the liquid outer core and the solid mantle may change the flow of molten iron-nickel alloy.  That may be sufficient to transmit momentum and thus stress through the plastic mantle to the brittle lithosphere so that areas of high elastic strain are pushed beyond the rocks’ strength so that they fail. There are indeed signs that the geomagnetic field also changes with day length on a decadal basis (Voosen, P. 2017. Sloshing of Earth’s core may spike big quakes. Science, v. 358, p. 575; doi:10.1126/science.358.6363.575). Rotational deceleration began in 2011, and if the last century’s trend holds there may be an extra five large earthquakes next year. Could the deadly 7.3 magnitude earthquake at the Iran-Iraq border on 12 November 2017 be the start? If so, will the 32-year connection improve currently unreliable earthquake forecasting? Probably the best we can expect is increased global readiness. The study has nothing to add as regards which areas are at risk: although there is clustering in time there is none with location, even on the regional scale.

A fully revised edition of Steve Drury’s book Stepping Stones: The Making of Our Home World can now be downloaded as a free eBook


http://www.gettyimages.com/detail/news-photo/iranians-salvage-their-furniture-and-household-appliances-news-photo/874026786
Iranians salvage their furniture and household appliances from damaged buildings in the town of Sarpol-e Zahab in Iran’s western Kermanshah province near the border with Iraq, on November 14, 2017

Shock and Er … wait a minute

Chicxulub2
Enhanced gravity map of the Chicxulub crater (credit: Wikipedia)

Michael Rampino has produced a new book (Rampino, M.R. 2017. Cataclysms: A New Geology for the Twenty-First Century. Columbia University Press; New York). As the title subtly hints, Rampino is interested in mass extinctions and impacts; indeed quite a lot more, as he lays out a hypothesis that major terrestrial upheavals may stem from gravitational changes during the Solar System’s progress around the Milky Way galaxy. Astronomers reckon that this 250 Ma orbit involves wobbling through the galactic plane and possibly varying distributions of mass – stars, gas, dust and maybe dark matter – in a 33 Ma cycle. Changing gravitational forces affecting the Solar System may possibly fling small objects such as comets and asteroids towards the Earth on a regular basis. In the 1980s and 90s Rampino and others linked mass extinctions, flood-basalt outpourings and cratering events, with a 27 Ma periodicity. So the books isn’t entirely new, though it reads pretty well.

Such ideas have been around for decades, but it all kicked off in 1980 when Luis and Walter Alvarez and co-workers published their findings of iridium anomalies  at the K-Pg boundary and suggested that this could only have arisen from a major asteroid impact. Since it coincided with the mass extinction of dinosaurs and much else besides at the end of the Cretaceous it could hardly be ignored. Indeed their chance discovery launched quite a bandwagon. The iridium-rich layer also included glass spherules, shocked mineral grains, soot and other carbon molecules –nano-scale diamonds, nanotubes and fullerenes whose structure is akin to a geodesic dome – and other geochemical anomalies. Because the Chicxulub crater off the Yucatán Peninsula of Mexico is exactly the right age and big enough to warrant a role in the K-Pg extinction, these lines of evidence have been widely adopted as the forensic smoking gun for other impacts. In the last 37 years every extinction event horizon has been scrutinized to seek such an extraterrestrial connection, with some success, except for exactly coincident big craters.

The K-Pg event is the only one that shows a clear temporal connection with a small mountain falling out of the sky, most of the others seeming to link with flood basalt events and their roughly cyclical frequency – but hence Rampino’s Shiva hypothesis that impacts may have caused the launch of mantle plumes from the core-mantle boundary. Others have used the ‘smoking gun’ components to link lesser events to a cosmic cause, the most notorious being the 2007 connection to the extinction of the North American Pleistocene megafauna and the start of the Younger Dryas return of glacial conditions. Since 1980 alternative mechanisms for producing most of the impact-connected materials have been demonstrated. It emerged in 2011 that nano-diamonds and fullerenes may form in a candle flame and their global distribution could be due to forest fires. And now it seems that shocked mineral grains can form during a lightning strike (Chen, J. et al. 2017. Generation of shock lamellae and melting in rocks by lightning-induced shock waves and electrical heating. Geophysical Research Letters, v. 44, p. 8757-8768; doi:10.1002/2017GL073843). Shocked or not, quartz and feldspar grains are resistant enough to be redistributed into sediments. Although platinum-group metals, such as iridium, are likely to be mainly locked away in Earth’s core, some volcanic exhalations and many flood basalts – especially those with high titanium contents – significantly are enriched in them. So even the Alvarez’s evidence for a K-Pg impact has an alternative explanation. Rampino is to be credited for acknowledging that in his book.

An awful lot of ideas about rare yet dreadful events in the biosphere depend, like many criminal cases, on the ‘weight of evidence’ and defy absolute proof. The evidence generally permits alternatives, such the cunning Verneshot hypothesis for the extinction-flood basalt connection supported by one of the founders of plate tectonics, W. Jason Morgan. As regards The K-Pg extinction, it is certain that a very large mass did fall on Chicxulub at the time of the mass extinction, whereas the Deccan flood basalts span a million years or so either side. But the jury is out on whether either or both did the deed. For other events of this scale and larger ones the money is on internal origins. As for Rampino’s galactic hypothesis, the statistics are decidedly dodgy, but chasing down more forensics is definitely on the cards.

English: From source; an animation showing the...
Animation showing the Chicxulub Crater impact. ( credit: University of Arizona, Space Imagery Center)

Water-borne arsenic back in the news

In the 1980s grim news began to emerge from the Indian State of West Bengal and a decade later from neighbouring Bangladesh. Villagers from the low-lying delta plains of the Ganges and Brahmaputra river systems at the head of the Bay of Bengal began to present at clinics with disfiguring skin lesions or keratoses on hands and feet, loss of feeling in fingers and toes and dark skin patches on their torsos. The latter were colloquially known as ‘black rain’. The victims were often stigmatised, as their neighbours believed they were suffering from leprosy. These symptoms were followed a few years later by increased incidences of lung, liver, kidney and bladder cancers. The first medical practitioner to recognise these typical signs of chronic arsenic poisoning in 1983, Dr Depankar Chakraborti of Kolkata, was branded as a ‘panic monger’ by local authorities. His warnings, backed by evidence published by the World Health Organisation (WHO) in 1988 that there was a connection with high arsenic levels in West Bengal drinking water supplies from new tubewells, went largely unheeded for a decade. Tragically, as it turned out, thousands of tubewells had been sunk in the Bengali delta plains from the 1970s onwards, aimed at reducing the risk of disease from pathogens in the previously used surface water from ponds and streams. After a conference on the perceived problem, organized in Kolkata by Dr Chakraborti in 1995, the WHO declared the situation in Bangladesh to be a ‘Major Public Health Issue’, and the world’s press took up the story. Clearly, millions of Bengali villagers were at risk or were already suffering from chronic arsenic poisoning. By the late 1990s thousands of samples of tubewell waters from the delta plains had been analysed, many of which revealed arsenic levels far above the 10 μg l-1 safe threshold. In 2002, 400 Bangladeshi victims sued the British Geological Survey (BGS) for negligence. The BGS had analysed 150 water samples from the Bangladesh delta plains in 1992 and had not reported any risks, but arsenic was not among the elements being analysed. The civil action eventually failed.

Skin lesions or keratoses that are symptomatic of chronic arsenic poisoning

Almost two decades after the arsenic scandal on the eastern side of the subcontinent well-water analyses showing high arsenic values have been published from the Indus plains of Pakistan (Podorski, J.E. et al. 2017. Extensive arsenic contamination in high-pH unconfined aquifers in the Indus Valley. Science Advances, v. 3,; doi:10.1126/wsciadv.1700935). The Indus catchment having a similar Himalayan source and being at a similar latitude it has long been considered to be at potential risk from arsenic derived from its thick alluvial sediments. The Swiss-Pakistani-Chinese team have produced geochemical data from 1200 tubewells throughout the catchment within Pakistan. A swath from Lahore to Karachi, with the country’s greatest population density, is at high risk of water with arsenic concentrations above the WHO guideline safe concentration, suggesting some 50 to 60 million people being subject to its hazard.

Although the geological setting is similar to that in the Bengal plains, a different natural chemical process causes the high concentrations ultimately from the iron hydroxide veneer on sediment grains which selectively absorbs several trace elements, including arsenic, from river water. In Bangladesh arsenic is released from sediments as a result of highly reducing conditions due to organic matter buried in some layers of alluvium, by a process known as reductive dissolution – when insoluble ferric iron (Fe3+) hydroxide (goethite) is exposed to a ready supply of electrons the iron is reduced to the soluble ferrous (Fe2+) form and the mineral breaks down to release its absorbed trace elements. Most of the alluvium in the Indus plain contains little organic carbon, so another mechanism is implicated. The high arsenic levels correlate with high pH in the groundwater and therefore seem most likely to be released from goethite grain coatings by alkaline water. That, in turn, is often a product of high evaporation and salinisation from the massive irrigation using groundwater in semi-arid southern Pakistan. The alkaline water then returns to the underlying groundwater in the highly permeable Indus alluvium; i.e. it is a consequence of irrigated agriculture rather than of a natural geochemical process as in more humid Bengal.

Whereas a remedy in Bangladesh and West Bengal has been to sink new tubewells into oxidising alluvial strata (red coloured rather than the reducing grey sediments)  that yield water with safe arsenic levels, the risky areas in Pakistan may need expensive use of absorbent filters on a large scale to remove the hazard. Because irrigation using groundwater is on such a large scale on the Indus plain there is also a definite risk of ingesting arsenic from crops produced there, principally rice but also unwashed leaf vegetables

See also:

http://www.bbc.co.uk/news/science-environment-41002005

http://www.sciencemag.org/news/2017/08/arsenic-drinking-water-threatens-60-million-pakistan

http://www.dawn.com/news/1353482/50-million-at-risk-of-arsenic-poisoning-in-pakistan?preview

https://www.dawn.com/news/1354023

Gas hydrates: a warning from the past

Detailed acoustic imaging above the Troll gas field in the northern North Sea off western Norway has revealed  tens of thousands of elliptical pits on the seabed. At around 10 to 20 per square kilometre over an area of about 15,000 km2 there are probably between 150 to 300 thousand of them. They range between 10 to 100 m across and are about 6 m deep on average, although some are as deep as 20 m. They are pretty much randomly distributed but show alignment roughly parallel to regional N-S sea-floor currents. Many of the world’s continental shelves display such pockmark fields, but the Troll example is among the most extensive. Almost certainly the pockmarks formed by seepage of gas or water to the surface. However, detailed observations suggest they are inactive structures with no sign of bubbles or fluid seepage. Yet the pits cut though glacial diamictites deposited by the most recent Norwegian Channel Ice Stream through which icebergs once ploughed and which is overlain by thin Holocene marine sediments. One possibility is that they record gas loss from the Troll field, another being destabilisation of shallow gas hydrate deposits.

Troll pockmarks
Parts of the Troll pockmark field off Norway. A: density of pockmarks in an area of 169 square km. B: details of a cluster of pockmarks. (Credit: Adriano Mazzini, Centre for Earth Evolution and Dynamics (CEED) University of Oslo)

Norwegian geoscientists have studied part of the field in considerable detail, analysing carbonate-rich blocks and foraminifera in the pits (Mazzini, A. and 8 others 2017. A climatic trigger for the giant Troll pockmark field in the northern North Sea. Earth and Planetary Science Letters, v. 464, p. 24-34; http://dx.doi.org/10.1016/j.epsl.2017.02.014). The carbonates show very negative δ13C values that suggest the carbon in them came from methane, which could indicate either of the two possible means of formation. However, U-Th dating of the carbonates and radiocarbon ages of forams in the marine sediment infill suggest that they formed at around 10 ka ago; 1500 years after the end of the Younger Dryas cold episode and the beginning of the Holocene interglacial. Most likely they represent destabilisation of a once-extensive, shallow layer of methane hydrates in the underlying sediments, conditions during the Younger Dryas having been well within the stability field of gas hydrates. Sporadic leaks from the deeper Troll gas field hosted by Jurassic sandstones is unlikely to have created such a uniform distribution of gas-release pockmarks. Adriano Mazzini and colleagues conclude that rapid early Holocene warming led to sea-floor temperatures and pressures outside the stability field of gas hydrates. There are few signs that hydrates linger in the area, explaining the present inactivity of the pockmarks – all the methane and CO2 escaped before 10 ka.

Gas hydrates are thought to be present beneath shallow seas today, wherever sea-floor sediments have a significant organic carbon content and within the pressure-temperature window of stability of these strange ice-like materials. Mazzini et al.’s analysis of the Troll pockmark field clearly has profound implications for the possible behaviour of gas hydrates at a time of global climatic warming. As well as their destabilisation adding to methane release from onshore peat deposits currently locked by permafrost and a surge in global warming, there is an even more catastrophic possibility. The whole of the seaboard of the southern North Sea was swept by a huge tsunami about 8000 years ago, which possibly wiped out Mesolithic human occupancy of lowland Britain, the former land mass of Doggerland, and the ‘Low Countries’ of western Europe. This was created by a massive submarine landslide – the Storegga Slide just to the north of the Troll field – which may have been triggered by destabilisation of submarine gas hydrates during early Holocene warming of the oceans.

Scablands: megaflood hypothesis tempered

Channeled Scablands during flood
Channeled Scablands at the time of a glacial lake outburst flood (credit: Wikipedia)

The eastern side of Washington State in the US includes a vast, barren area that has been scoured virtually free of superficial sediment, including soils. Its landscape is among the most odd in North America, consisting of a network of unusually wide canyons or couleés that incise a regional plateau formed by the Columbia River flood basalts. The now largely dry canyon floors contain immense potholes, megaripples and erratic boulders, together with strangely streamlined hillocks made of residual, windblown loess deposits, which collectively resemble features of normal river beds but at a gargantuan scale. The canyon network emerges from the Rocky Mountains near the city of Spokane, then criss-crosses what had previously been a wide basalt plain to merge with the Columbia River in southern Washington. The couleés are up to 100 km long and reach  100 m in depth.

Dry Falls, WA Français : Les Dry Falls dans l'...
Dry Falls in Grand Colee, Washington state, US, showing typical features of the Channelle Scablands. (credit: Wikipedia)

In the 1920s J. Harlen Bretz suggested that the Channelled Scablands had been formed by a massive flood, a view that met disbelief until his colleague Joseph Pardee discovered that a huge lake of glacial meltwater (Lake Missouala) had formed in the intricate valleys of the Montana Rockies when their outflow into Washington had been blocked by a southward-surging finger of the Cordilleran ice sheet. Lake Missouala is estimated to have been about half the size of modern Lake Michigan (~7700 km2) and up to 610 m deep, reaching a maximum volume of 2100 km3  between 15 to 13 ka ago. Bretz’s idea was vindicated; melting of the ice dam was widely thought to have produced a single vast outburst flood and the removal of approximately 320 km3 of basalt and loess. The later discovery of strandlines, similar to those on a smaller scale in Glen Roy, western Scotland, on the flanks of former lake modified the theory to a series of individual, but still huge outburst flood events. Their magnitudes, estimated by assuming that each filled the coulees to their brim, were thought to be up to 60 km3 per hour, i.e. 100 times greater than the largest recorded historically, that of the Amazon. A recent study tempers the awe long-associated with the Scablands.

Isaac Larsen and Michael Lamb of the University of Massachusetts and the California Institute of Technology examined Moses Couleé, one of the largest, in detail (Larsen, I.J. & Lamb, M.P. 2016. Progressive incision of the Channelled Scablands by outburst floods. Nature, v. 538, p. 229-232; doi;10.1038/nature19817). Terraces in Moses Couleé allow successive topographic profiles of the canyon to be reconstructed, and the flow features on its floor allow water depth during some of the flows to be estimated. Far from being brim-full at any time, except during the first incision, individual discharges of meltwater were probably 5 to 10 times less than those previously suggested. Moreover, the pattern of the Scablands reflects major fracture zones n the Columbia River flood basalts, which suggests that floods followed lines of least resistance and greatest ease of erosion by removal of joint-bound blocks of basalt. Yet the floods still reached a magnitude never recorded for modern ones, and Larsen and Lambs modelling may well apply to the even vaster outburst canyons on Mars, such as Valles Marineris.

See also: Perron, J.T. & Venditti, J.G. 2016, Megafloods downsized. Nature, v. 538, p. 174-175; nature.com/newsandviews