

Milutin Milankovitch’s astronomical theory to account for glacial – interglacial cycles is based on 3 gravitational influences on the Earth that change the way it spins and orbits the Sun. Each is cyclic but with different periods: the angle of axial tilt every 41 ka; precession of its rotation axis on a 23 ka pacing; the change in shape of the orbit around the Sun over 100 ka. Each subtly affects the amount of solar energy, their influences combining to produce a seemingly complex, but predictable variation through time of solar heating for any point on the Earth’s surface. Milankovitch’s work was triumphantly confirmed when analysis of oxygen-isotope time series from sea-floor sediments revealed precisely these periods in the record of continental ice cover. Specifically, astronomical pacing of midsummer insolation at 65°N matches the real climatic pattern through time.
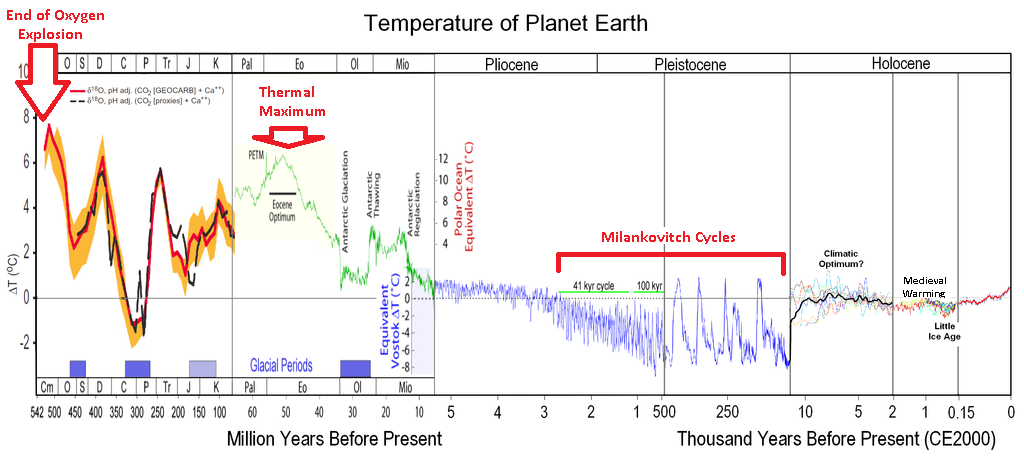
Yet the periods between glacial maxima have not stayed constant over the last 2 Ma or so (Figure showing Phanerozoic climate changes). About 0.8 to 1 Ma ago a sequence with roughly 41 ka spacing was replaced by another about every 100 ka, i.e. both overall climate periods matched one of the astronomical forcings. What is a puzzle is that the current periodicity seems to follow the very weakest influence in energy terms; that from orbital eccentricity. The energy shifts from changes in orbit shape are, in fact, far too weak to drive the accumulation and eventual melting of ice sheets on land. Climatologists have suggested a variety of processes that might be paced by eccentricity but which act to amplify is climatic ‘signal’. None have been especially convincing.
In an attempt to resolve the mystery Ayako Abe-Ouchi of the University of Tokyo and Japanese, US and Swiss colleagues linked a climate model driven by Milankovitch insolation and variations in CO2 recorded in an Antarctic ice core with a model of how land-ice forms and interacts with the underlying lithosphere (Abe-Ouchi, A. et al. 2013. Insolation-driven 100,000-year glacial cycles and hysteresis of ice-sheet volume. Nature, v. 500, p. 190-193).

Their key discovery is that the ice-sheets that repeatedly formed on the Canadian Shield and extended further south than Chicago had such a huge mass that they changed the shape of the land surface beneath them so much it had an effect on climate as a whole. The reason for this is that glacial loading forces the lithosphere down by displacing the more ductile asthenosphere sideways. But when melting begins rebound of the rock surface lags a long time behind the shrinking ice volume – well displayed today in Britain and Scandinavia by continued rise of the land to form raised beaches. In the case of the North American ice sheet, what had become an enormous ice bulge at glacial maxima developed into a huge basin up to 1 km deep as the ice began to melt. Simply by virtue of its low elevation this sub-continental basin would have warmed up more and more rapidly as the ice-surface fell because of this ‘isostatic’ lag.
Another feature to emerge from the model was the interaction between the 100 ka eccentricity ‘signal’ and that of precession at 23 ka. For long periods that kept summer temperature low enough for snow to pile up and become glacial ice, but on a roughly 100 ka time scale both acted together to increase summer temperatures at high northern latitudes. Melting that instantaneously removed some ice load each summer brought into play the sluggish isostatic response that helped even more warming the following year. As well as convincingly accounting for the 100 ka mystery, the model explains the far more rapid deglaciations in that mode than in the preceding 41 ka cycles, which were almost symmetrical compared with the more recent slow accumulation of continental ice sheets over ~90 ka followed by almost complete melting in a mere 10 ka.
If true, the model seems to imply that before 800 ka the positions, thicknesses and extents of continental ice sheets were different from those in later times. Or perhaps it reflects a steady increase in the overall volume of ice being produced over northern North America, or that glacial erosion thinned the crust until changing isostatic influences could ‘trip’ sufficient additional warming.
Related articles
- Why an Ice Age Occurs Every 100,000 Years: Climate and Feedback Effects Explained (thedailysheeple.com)
- The Milankovitch Cycles (muchadoaboutclimate.wordpress.com)
- Kerr, R.A. 2013. How to make a Great Ice Age, Again and again and again. Science, v. 341, p. 599.
- Useful link for climate science


One thought on “New approach to the Milankovitch mystery”