How rich are deep-sea resources?

My first task as a Lecturer in Earth Sciences at the British Open University, from 1971 onward, was to write teaching materials about the economics, formation and geological setting of metal resources. Much of the content was about the full range of ‘conventional’ metal ores, but something being publicised as having huge potential intrigued me. This concerned manganese-rich nodules (with the aesthetic appeal of unwashed potatoes) and crusts found sitting on top of sediments of the abyssal ocean floor, at depths between 3 to 5 kilometres.  While manganese is by no means a rare element and occurs in vast ore reserves on the continents, the nodules contain unusually high concentrations of other, more valuable metals, such as copper, nickel, zinc, cobalt and lead. Some contained more than 3% of Cu, Ni and Co combined, above the ‘grades’ of economic deposits of ores of the individual metals on land. This was the source of their potential: simple, albeit very deep dredging of the nodules would provide multi-metal ore of very high profitability. Moreover, the nodules are in truly vast tonnages (about 10 kg m-2) and continually grow by precipitation from seawater in the underlying sediments at a few millimetres per million years – they are renewable resources.

Manganese nodules taken from the bottom of the...
Manganese nodules from the Pacific abyssal plains. (credit: Wikipedia)

A variety of reasons, not the least of which was the vexatious question of ownership of sea-floor resources far from land, have meant that commercial operations have yet to begin. However, spiralling prices for metals on the world market together with depletion of on-shore, high-grade reserves are beginning to make the opportunity of nodule mining irresistible. Fifteen companies, with licence areas issued by the intergovernmental  International Seabed Authority of around 75 000 km2 each, are now engaged in economic assessment of one of the most remote swathes of the Pacific abyssal plains (Peacock, T. & Alford M.H. 2018. Is deep-sea mining worth it? Scientific American, v. 318(5) (May 2018 issue), p. 63-67). There are several controversial issues surrounding deep-sea mining. First, dredging, like beam trawling disturbs and destroys ocean-floor ecosystems and turns bottom water turbid, the very fine grain size of sediments resulting in settling being very slow ( about 1 mm s-1). Second, preliminary ore processing on board dredging vessels results in plumes of turbid and metal-rich slurry in the wakes, threatening surface and mid-water ecosystems. Such plumes will rapidly spread far from operational areas in surface current systems, eventually to smother pristine areas of ocean floor. Re-examination of areas of experimental dredging from 30 years ago have revealed that they are still sterile of lifeforms larger than 50 micrometres. Added to these effects, onshore processing will produce large amounts of waste – about 75% of the volume of dredged nodules. Conventional mines eventually backfill their excavations, but with nodule mining disposal would be an environmental nightmare.

Japanese sea-floor mining machine. (credit: Japan Times)

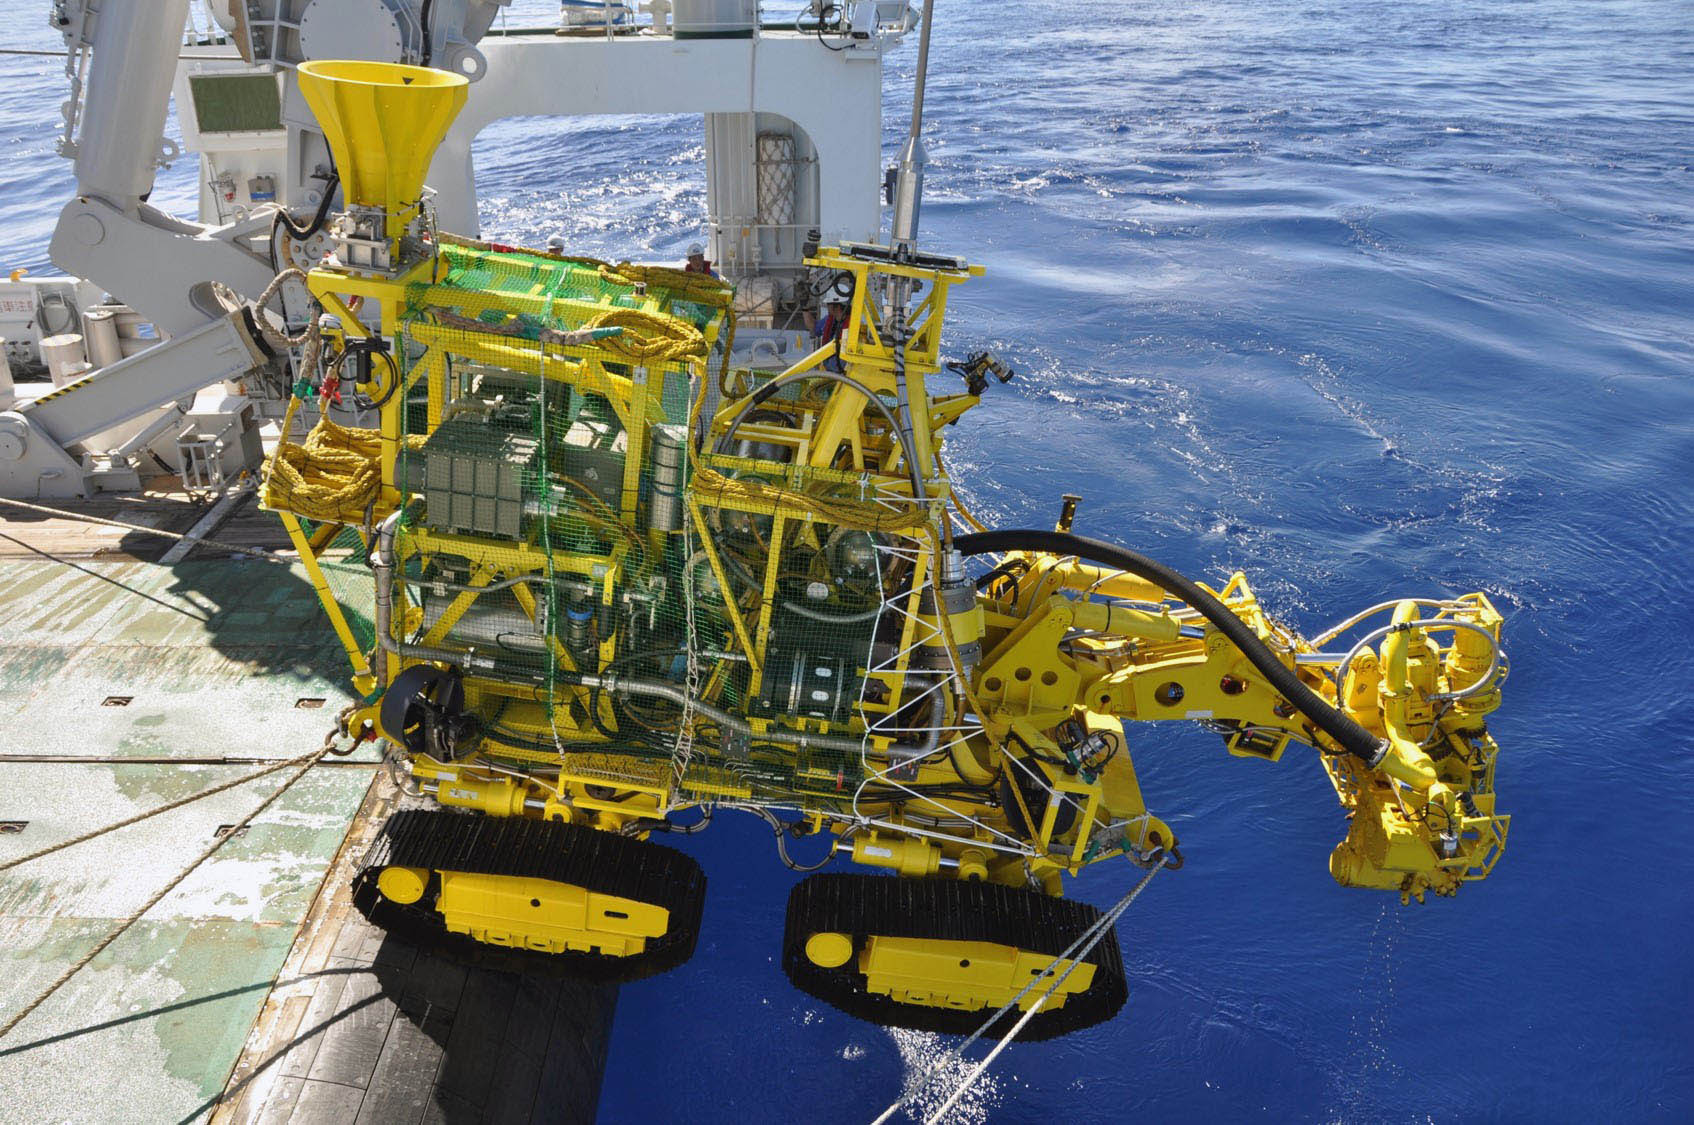
Economically, it seems that nodule dredging is potentially highly profitable. To break even requires lifting about a million metric tons, which would yield of the order of 37 000 t of Ni, 32 000 t of Cu, 6000 t of Co and 750 000 t manganese. If all 15 companies begin extraction, production at these levels will have a downward effect on world metal prices, tending to undercut production from conventional mines. One little-considered issue is that the ‘blend’ of metals from nodules will not match the industrial demand for each of them, further destabilising markets. Added to mining of the abyssal plains, plans are well advanced for multi-metal mining of massive sulfide deposits forming at hydrothermal vents or ‘black smokers’ along mid-ocean ridge systems, in which gold figures strongly. Only a few Pacific island states have resisted the ‘promise’ of such operations. Japanese companies are already mining the seabed off Okinawa within their own offshore waters and seemingly are producing zinc equivalent to the country’s annual consumption as well as gold, copper and lead.

‘Big data’ on water resources


Two petabytes (2×10¹⁵) is a colossal number which happens to approximate how much data has been collected in geocoded form by the Landsat Thematic Mapper and its successors since it was first launched in 1984. In tangible form these would occupy about half a million DVDs, weighing in at about 8 metric tonnes; ‘daunting’ comes nowhere near describing the effort needed to visually interpret this unique set of multi-date imagery. Using the Google Earth Engine, the free cloud-computing platform for big sets of image data which hosts all Landsat data and much else (but not yet the equally daunting ASTER data – roughly a million 136 Mb scenes) the 32 years-worth has been analysed for its content of hydrological information by the European Commission’s Joint Research Centre in Italy, with assistance from Google Switzerland. Using the various spectral characteristics of water in the visible and infrared region, the team has been able to assess the position on the continents of surface water bodies larger than 900 m2, both permanent and ephemeral, and how the various categories have changed in the last 32 years (Pekel, J.-F. et al. 2016. High-resolution mapping of global surface water and its long-term changes. Nature, v. 540, p. 418-422; doi:10.1038/nature20584). The results are conveniently and freely available in their entirety at the Global Surface Water Explorer, an unparalleled and easy-to-use opportunity for water resource managers, wetland ecologists and geographers in general.

Among the revelations are sites and areas that have been subject to gains and losses in water availability, the extents of new and vanished permanent and seasonal water bodies and the conversion of one to the other. A global summary gives a net disappearance of 90 thousand km2 of permanent water bodies, about the area of Lake Superior, but exceeded by new permanent bodies totalling 184 thousand km2. There has been a net increase in permanent water on all continents except Oceania with a loss one percent (note that Antarctica and land north of the Arctic Circle were not analysed). More than 70 % of the losses are in the semi-arid Middle East and Central Asia (Iran, Iraq, Uzbekistan, Kazakhstan and Afghanistan), due mainly to overuse of irrigation, dam construction and long-term drought. Much of the increase in water occurrence stems from reservoir construction, but climate change may have played a part through increased precipitation and melting of high-altitude snow and ice, as in Tibet.

The Aral Sea in Uzbekistan and Kazakhstan has suffered dramatic loss of standing and seasonal water cover due to overuse of water for irrigation from the two main rivers, the Amu (Oxus) and Syr, that flow into it. Note the key to the colours that represent different categories of changes in surface water. (Credit: Global Surface Water Explorer)
Many of the lakes in the northern Tibetan Plateau have grown in size during the last 32 years, mainly due to increased precipitation and snow melt. (Credit: Global Surface Water Explorer)

There are limitation to the accuracy of the various categories of change, one being the persistence of cloud cover in humid climates, another being the sometimes haphazard scheduling of Landsat Data capture (in some case that has depended on US Government interest in different areas of the world).

More detail on using remote sensing in exploration for and evaluation of water resources can be found here.

Free course on remote sensing for water exploration

250 million people who live in the drylands of Africa and Asia face a shortage of water for their entire lives. Hundreds of millions more in less drought-prone regions of the ‘Third World’ have to cope repeatedly with reduced supplies. A rapid and effective assessment of how to alleviate the shortfall of safe water is therefore vital. In arid and semi-arid areas surface water storage is subject to a greater rate of evaporation than precipitation, so groundwater, hidden beneath the land surface, provides a better alternative. Rainwater is also lost by flowing away far more quickly than in areas with substantial vegetation. Harvesting that otherwise lost resource and diverting it to storage secure from evaporation – ideally by using it to recharge groundwater – is an equally important but less-used strategy. Securing a sustainable water supply for all peoples is the most important objective that geoscientists can address.

In practice, to assure good quality water supplies to a community in the form of productive wells, surface water harvesting schemes or planning the recharge of exploited aquifers requires skill, a great deal of work and considerable financial resources. Yet in many parts of sub-Saharan Africa and arid areas of Asia knowing where to focus effort and increase the chances of it being fruitful is one the biggest hurdles to overcome. Such reconnaissance – highlighting the most probable localities on geological and hydrological grounds, and screening out those least likely to yield water for drinking and hygiene – depends on details of the geology and topography of the terrain in which needy communities are situated. For most of the Afro-Asian dryland belt adequate geological and topographic maps are in as short supply as potable water itself.  Remote sensing combined with an understanding of groundwater storage and surface-water harvesting is a powerful tool for bridging that knowledge gap, and is routinely used successfully in areas blessed with abundances of experienced geoscientists, money and engineering infrastructure. Again, most of the Afro-Asian dryland belt is poorly endowed in these respects.

dvd-sleeve-front

Having long ago written a textbook on general remote sensing for geoscientists, now out of print (Image Interpretation in Geology (3rd edition): 2001. Nelson Thorne/Blackwell Science), I decided to re-issue revised parts of it framed in the specific context of water exploration in arid and semi-arid terrains, and to add practical case studies and exercises based on a free version of professional image processing and desktop mapping software. Some of the most geologically revealing remotely sensed image data – those from the Landsat series of satellites and the joint US-Japan ASTER system carried by Terra, one of NASA’a Earth Observing System satellites – are now easily and freely available for the whole of the Earth’s land surface. Given basic familiarity with theory and practicalities, a computer and appropriate software together with a moderately fast internet connection there is nothing to stop any geoscientist, university geology student or engineer working in the water, sanitation and hygiene (WASH) sector from becoming a proficient, self-contained practitioner in water reconnaissance. Water Exploration: Remote Sensing Approaches has that aim. Online access to the theoretical parts is free, and a DVD that combines theory, software, exemplary data and several exercises that teach the use of image processing/desktop mapping software is available at cost of reproduction and postage.

If you visit the website, find what you see potentially useful and wish to know more, contact me through the Comments form at the H2Oexplore homepage.

Fracking unlikely in Europe

These days, leading British politicians burdened with power have a tendency to show outwardly that they are, if little else, earnest. When busy with economic and industrial policy they wear tailored day-glo hi-viz suits and shiny new hard hats. During the great 2015 floods of Northern England, their garb was off the peg North Face gear and green wellington boots. And, of course, for social policy a hoodie is de rigueur. Rosy-cheeked Prime Minister David Cameron has been extremely earnest about fracking for shale gas for several years, and in the petroleum industry the appropriate signal of a leading politician’s enthusiasm is to wear a rigger’s blue jumpsuit; ‘We’re going all out for shale’ Cameron has said. Given the explosive success of shale-gas exploitation in North America over the last decade that’s not very surprising, but do not expect to see him looking earnestly at an exploration rig again any time soon.

Cameron’s excitement began when in 2011 the Advanced Resources Institute (ARI) in Washington DC released the results of its consultancy for the US Department of Energy on global shale-gas prospects. The star prospect in Europe was Poland, well endowed with subsurface shales, which according to ARI, had more than 5 trillion cubic metres of technically recoverable reserves, enough to satisfy Polish consumption for more than 300 years. In 2013, ARI suggested 17 trillion m3 beneath Britain, albeit only 0.7 trillion that was amenable to fracking (about a decade’s worth of British gas consumption). But still the hype was maintained. An article in the 3 March 2016 issue of Nature (Inman, M. 2016. Can fracking power Europe. Nature, v. 531, p. 22-24) tempers enthusiasm a great deal more.

The Polish Geological Institute revised the country’s reserves down to a tenth of ARI’s estimate. After an initial frenzy of interest following the ARI report, when exploration licences covered a third of Poland, during 2013 and 2014 major companies relinquished licences for fracking en masse. Their exploratory activities had been disappointing because of the depth of burial (2-5 km compared with 1-2 km in the US) and unfavourably high clay content and strength of the target shales. The less thrilling ARI prospects for Britain did not excite major petroleum players at all, what interest there is being from ‘juniors’ such as Cuadrilla. The British Geological Survey, which has huge archives of geological information, both surface and subsurface, has assessed the three main British shale-gas ‘plays’ and comes up with a reserve figure of between 24 and 68 trillion m3. But that high figure is based on the situation in mid-west North American shale-gas fields, where the geology is a great deal simpler than here. In Britain, orogenies at the end of the Carboniferous and the outermost ripples of that which formed the Alps in late Mesozoic and Palaeogene times created far more deformation than beneath the central plains of North America. Widespread faults, even though few in Britain have large displacements, pose two sets of problems. As the minor earthquakes set off by fracking in the tectonically simple Fylde area of western Lancashire indicate, pumping fluids into faulted rock can release pent-up elastic strain. But such leakage into faults and smaller fractures may also cause the injection pressure to fall, making the fracking process less efficient.

https://i0.wp.com/www.agentsofchangefoundation.org/wp-content/uploads/2014/06/4596344953.jpg
Fracking information sheet from the British Geological Survey

Inman reports that fracking is now moribund throughout Europe, partly because of the disappointing results and also because environmental concerns for densely populated regions have spurred widespread moratoria, including those in three of Britain’s four nations; Scotland, Wales and Northern Ireland. The only current European fracking activity is in England, conducted by a handful of junior companies. A stumbling block in England actually lies with the quality of subsurface data for what has been described at the most close examined geology in the world. Since the early 1980s there has been a succession of onshore licensing rounds for oil and conventional gas, the 14th of which is still active. The early ones were accompanied by a great deal of seismic reflection surveying, mainly using the truck mounted ‘Vibroseis’ method where the ground is mechanically thumped rather than subject to explosive shot firing that is favoured in sparsely populated areas. According to BGS, the guardians of the onshore seismic exploration repository, compared with the onshore seismic data available in North America that for Britain is ‘sparse, and fairly poor’.

Paris Agreement 2015: Carbon Capture and Storage

Anyone viewing news that covered the adoption of the Paris Agreement on climate change on 11 December 2015 would have seen clear evidence of the reality of the old saw, ‘There was dancing in the streets’. Not since the premature celebration of the landing of the Philae spacecraft on comet 67P/Churyumov–Gerasimenko 11 months before has there been such public abandonment of normal human restraint. In the case of ‘little Philae’ the object of celebration sputtered out three days after landing, albeit with the collection of some data. Paris 2015 is a great deal more important: the very health of our planet and its biosphere hangs on its successful implementation. At 32 pages long, by UN standards the document agreed to by all 196 UN Member States is pretty succinct considering everything it is supposed to convey to its signatories and the human race at large.

The Bagger 288 bucket wheel reclaimer moves from one lignite mine to another in Germany.

One central and, by most scientific criteria, the most important technology needed as a stopgap before the longed-for adoption of carbon-free energy generation does not figure in the diplomatic screed: carbon capture and storage (CCS) is not mentioned once. Indeed, only 10 Member States have included it in their pledge or ‘intended nationally determined contribution’ (INDC) – Bahrain, Canada, China, Egypt, Iran, Malawi, Norway, Saudi Arabia, South Africa and the United Arab Emirates. Only three of them are notable users of coal-fired power stations for which CCS is most urgent. An article in the January 2016 issue of Scientific American offers an explanation of what seems to be a certain diplomatic timidity about this highly publicized stop-gap measure (Biello, D. 2016. The carbon capture fallacy. Scientific American, v. 314(1) 55-61). David Biello emphasizes the urgency of CCS from more industries than fossil fuel power plants, cement manufacture being a an example. He focuses on the economics and logistics of one of very few CCS facilities that may be on track for commissioning (33 have been shut down or cancelled worldwide since 2010).

The Kemper power station in Mississippi, USA is the most advanced in the US, as it has to be to burn the strip-mined, wet, brown coal or lignite that is its sole fuel. The chemistry it deploys is quite simple but technologically complex and expensive. So Kemper survives only because it aims to sell the captured CO2 to a petroleum company so that it can be pumped into oil fields to increase dwindling production. However, its extraction costs US$1.50 per tonne, while naturally occurring, underground CO2 costs US$0.50 to pump out. Moreover, Kemper’s power output at US$11 000 per kW of generating capacity is three times more expensive than that for a typical coal-fired boiler. Mississippi Power is lucky, in that it only needs to pipe the gas 100 km to its ‘partner’ oil field; a pretty small one producing about 5 000 barrels per day. Some coal plants are near oil fields, but the majority are not. To cap it all, only about a third of the CO2 production is likely to remain in long-term underground storage.

Because Kemper has, predictably, hit the financial buffers (almost US$4 billion over budget) to avoid bankruptcy it has raised electricity prices to its customers by 18%. Without the projected revenue from its partnered oil field it would go belly up. Even in the happy event of financial break-even, in carbon terms it would be subsidising the oilfield to produce…CO2! But the sting in the tail of Biello’s account of this ‘flagship’ project is that the plant is currently neither burning coal nor capturing carbon: it uses natural gas…

A new explanation for banded iron formations (BIFs)

The main source for iron and steel has for more than half a century been Precambrian rock characterised by intricate interlayering of silica- and iron oxide-rich sediments known as banded iron formations or BIFs. They always appear in what were shallow-water parts of Precambrian sedimentary basins. Although much the same kind of material turns up in sequences from 3.8 to 0.6 Ga, by far the largest accumulations date from 2.6 to 1.8 Ga, epitomised by the vast BIFs of the Palaeoproterozoic Hamersley Basin in Western Australia. This peak of iron-ore deposition brackets the time (~2.4 Ga) when world-wide evidence suggests that the Earth’s atmosphere first acquired tangible amounts of free oxygen: the so-called ‘Great Oxidation Event’. Yet the preservation of such enormous amounts of oxidised iron compounds in BIFs is paradoxical for two reasons: the amount of freely available atmospheric oxygen at their acme was far lower than today; had the oceans contained much oxygen, dissolved ions of reduced Fe-2 would not have been able to pervade seawater as they had to for BIFs to have accumulated in shallow water. Iron-rich ocean water demands that its chemical state was highly reducing.

Oblique view of an open pit mine in banded iron formation at Mount Tom Price, Hamersley region Western Australia (Credit Google earth)

The paradox of highly oxidised sediments being deposited when oceans were highly reduced was resolved, or seemed to have been, in the late 20th century. It involved a hypothesis that reduced, Fe-rich water entered shallow, restricted basins where photosynthetic organisms – probably cyanobacteria – produced localised enrichments in dissolved oxygen so that the iron precipitated to form BIFs. Later work revealed oddities that seemed to suggest some direct role for the organisms themselves, a contradictory role for the co-dominant silica-rich cherty layers and even that another kind of bacteria that does not produce oxygen directly may have deposited oxidised iron minerals. Much of the research focussed on the Hamersley BIF deposits, and it comes as no surprise that another twist in the BIF saga has recently emerged from the same, enormous repository of evidence (Rasmussen, B. et al. 2015. Precipitation of iron silicate nanoparticles in early Precambrian oceans marks Earth’s first iron age. Geology, v. 43, p. 303-306).

The cherty laminations have received a great deal less attention than the iron oxides. It turns out that they are heaving with minute particles of iron silicate. These are mainly the minerals stilpnomelane [K(Fe,Mg)8(Si, Al)12(O, OH)27] and greenalite [(Fe)2–3Si2O5(OH)4] that account for up to 10% of the chert. They suggest that ferruginous, silica-enriched seawater continually precipitated a mixture of iron silicate and silica, with cyclical increases in the amount of iron-silicate. Being such a tiny size the nanoparticles would have had a very high surface area relative to their mass and would therefore have been highly reactive. The authors suggest that the present mineralogy of BIFs, which includes iron carbonates and, in some cases, sulfides as well as oxides may have resulted from post-depositional mineral reactions. Much the same features occur in 3.46 Ga Archaean BIFs at Marble Bar in Western Australia that are almost a billion years older that the Hamersley deposits, suggesting that a direct biological role in BIF formation may not have been necessary.

More on BIFs and the Great Oxidation Event

Bicentenary of the first national geological map

It’s good to know that the geosciences have had revolutionising developments to match those of the rest of science. Forget the Battle of Waterloo in 1815, which of course was ‘the nearest-run thing you ever saw in your life’ when the Brits were saved from defeat by the timely arrival of the Prussians: This year we can celebrate one that literally put geology on the map, kicked-off the systematic exploration for every kind of physical resource, thereby putting a great deal of money in the pockets of coal, petroleum and metal moguls and making geology a career rather than a pastime. In 1815 William Smith published A Delineation of the Strata of England and Wales with part of Scotland, which despite the title was a map showing the basic geology and structure of the whole of England and Wales: the first ever map showing accurately the distribution of rocks for an entire country. The original, at 2.6 by 1.8 m, dominates the main staircase at Burlington House, the home of the Geological Society of London.

William Smith's A Delineation of the Strata of England and Wales with part of Scotland (1815)
William Smith’s A Delineation of the Strata of England and Wales with part of Scotland (1815)

Tom Sharpe has nicely summarized the key facts surrounding Smith’s masterpiece (Sharpe, T. 2015. The birth of the geological map. Science, v. 347, p. 230-232). One feature that I certainly did not know was that the colour scheme for the different stratigraphic units was based on the dominant colour of the rocks themselves, such as purples for the abundant slates of the Lower Palaeozoic, brown and red for the Old- and New Red Sandstone, greys and blacks for the Coal Measures and green for the Greensand, which until quite recently remained widely used to signify Cambrian, Ordovician and Silurian; Devonian and Permian; Upper Carboniferous and Cretaceous.

Although celebrated today, Smith’s map was panned by the gentlemen geologists of the Geol Soc, who attempted to do a better job, but failed ignominiously. William Smith was not a leisured chap of the Enlightenment, but worked for a living surveying coal mines, navigating canals and draining fens. Despite their antipathy, the Fellows of the Geological Society of London knew a good earner when they saw one and plagiarized Smith’s work and undercut his regular price for his map. As a result he ended up in a London debtors’ prison. Even on the day of his release in 1819, bailiffs seized his house and its contents. The Geol Soc eventually did honour Smith with its Wollaston Medal in 1831, its then president Adam Sedgwick dubbing him ‘the Father of English Geology’: by that time geology had become a profession…

Serious groundwater depletion in western US

The 2300 km long Colorado River whose catchment covers most of Arizona and parts of the states of Colorado, California, Nevada, Utah, New Mexico and Wyoming is one of the world’s most harvested surface water resources. So much so that barely a trickle now ends up in Baja California where the huge river once flowed into the sea. The lower reaches of the river system cross arid lands and it is the water source for several major cities and areas of intensive agriculture, serving as many as 40 million people and 16 thousand km2 of irrigated fields. It has been nicknamed the US Nile because of its economic importance, but Egypt’s Nile has far less pressure put on it, although its exit flow to the Mediterranean is also hugely reduced from its former peak volume. The water crisis affecting the Colorado River and the areas that it serves has peaked during the 14-year drought over its lower reaches. To ease conditions in the former wet lands of Mexico near the river’s outlet 2014 saw deliberate major releases from giant reservoirs higher in the Colorado’s course.

English: New map of the Colorado River watersh...
The Colorado River Basin (credit: Wikipedia)

Surface abstraction is not the only drain on water resources of the Colorado River basin: groundwater pumping from the sediments beneath has grown enormously for both irrigation and urban use. That it is possible to play golf at many courses in the desert and to see monstrous musical fountains in Las Vegas is down largely to groundwater exploitation. There have been concerns about depletion of underground reserves once abstraction outpaced natural recharge by infiltration of rainfall and snow melt, but highlighting the magnitude of the problem required a rather dramatic discovery: so much water has been lost from aquifers that the missing mass has reduced the Earth’s gravitational field over the south-west US (Castle, S.L. et al. 2014. Groundwater depletion during drought threatens future water security of the Colorado River Basin. Geophysical Research Letters, doi: 10.1002/2014GL061055).

Global Gravity Anomaly Animation over land fro...
Global Gravity Anomaly Animation over land from GRACE (credit: Wikipedia)

The evidence comes from the Gravity Recovery and Climate Experiment (GRACE), jointly funded by NASA and Germany’s DLR and launched in March 2002. GRACE uses two satellites that follow the same orbit with a spacing of 220 km between them.  Range finders on each measure their separation distance, and so their ups and downs as gravity varies, with far greater accuracy than any other method.  Measuring the Earth’s entire gravitational field at their orbital height takes about a month. Groundwater depletion beneath the Gangetic Plains of northern India, to the tune of 109 km3, was detected in 2009  and the same approach has been applied to the Colorado Basin for nine years between 2004 and 2013. It shows that during this part of one of the longest droughts in the history of the south-west US 50 km3 have been lost from beneath, as a rate of about 5.5 km3 per year. Though the total is half the loss from beneath northern India, it should be remembered that more than ten times as many people depend on the Ganges Basin. Moreover, there is no monsoon recharge in the south-western states.

Fracking in the UK; will it happen?

Whether or not one has read the Tractatus Logico-Philosophicus of Ludwig Wittgenstein, there can be little doubt that one of his most famous quotations can be applied to much of the furore over hydraulic fracturing (fracking) of hydrocarbon-rich shale in south-eastern Britain: ‘Whereof one cannot speak, one must remain silent’ (more pithily expressed by Mark Twain as ‘Better to remain silent and be thought a fool than to speak and remove all doubt’). A press release by the British Geological Survey  in late May 2014 caused egg to appear on the shirts of both erstwhile ‘frackmeister’ David Cameron (British Prime Minister) and anti-fracking protestors in Sussex. While there are oil shales beneath the Weald, these Jurassic rocks have never reached temperatures sufficient to generate any significant gas reserves (see: Upfront, New Scientist, 31 May 2014 issue, p. 6). Yet BGS estimate the oil shales to contain a total of 4.4 billion barrels of oil. That might sound a lot, but the experience of shale fracking companies in the US is that, at best, only about 5% can be recovered and, in cases that are geologically similar to the Weald, as little as 1% might be expected. Between 44 and 220 million barrels is between two and six months’ worth of British oil consumption; and that is only if the entire Wealden shales are fracked.

Areas where petroleum-rich shales occur at the surface in Britain. (credit: British Geological Survey)

Why would any commercial exploration company, such as Cuadrilla, go to the trouble of drilling wells, even of an ‘exploratory nature’, for such meager potential returns? Well, when there is sufficient hype, and the British Government has gushed in this context for a few years, bigger fish tend to bite and cash flows improve. For instance, Centrica the owner of British Gas forked out $160 million to Cuadrilla in June 2013 for a quarter share in the well-publicised licence area near Blackpool in Lancashire; the grub stake to allow Cuadrilla to continue exploration in exchange for 25% of any profit should commercial quantities of shale-gas be produced.

Sedimentary rock sequences further north in Britain whose geological evolution buried oil shales more deeply are potential gas producers through fracking; an example is the Carboniferous Bowland Shale beneath the Elswick gasfield in west Lancashire, targeted by Cuadrilla. Far greater potential may be present in a large tract of the Pennine hills and lowlands that flank them where the Bowland Shale occurs at depth.

Few people realize just how much detail is known about what lies beneath their homes apart from maps of surface geology. That is partly thanks to BGS being the world’s oldest geological survey (founded in 1835) and partly the sheer number of non-survey geologists who have prowled over Britain for 200 years or more and published their findings. Legally, any excavation, be it an underground mine, a borehole or even the footings for a building, must be reported to BGS along with whatever geological information came to light as a result. The sheer rarity of outcropping rock in Britain is obvious to everyone: a legacy of repeated glaciation that left a veneer of jumbled debris over much of the land below 500m that lies north of the northern outskirts of the London megalopolis. Only highland areas where glacial erosion shifted mullock to lower terrains have more than about 5% of the surface occupied by bare rock. Of all the data lodged with BGS by far the most important for rock type and structure at depth are surveys that used seismic waves generated by vibrating plates deployed on specialized trucks. These and the cables that connected hundreds of detectors were seen along major and minor roads in many parts of Britain during the 1980s during several rounds of licenced onshore exploration for conventional petroleum resources. That the strange vehicles carried signs saying Highway Maintenance lulled most people apart from professional geologists as regards their actual purpose. Over 75 thousand kilometers of seismic sections that penetrated thousands of metres into the Earth now reside in the UK Onshore Geophysical Library (an Interactive Map at UKOGL allows you to see details of these surveys, current areas licenced for exploration and the locations of various petroleum wells).

Seismic survey lines in northern England (green lines) from the interactive map at the UK Onshore Geophysical Library

Such is the detail of geological knowledge that estimates of any oil and gas, conventional or otherwise, residing beneath many areas of Britain are a lot more reliable than in other parts of the world which do not already have or once had a vibrant petroleum industry. So you can take it that when the BGS says there is such and such a potential for oil or gas beneath this or that stretch of rural Britain they are pretty close to the truth. Yet it is their raw estimates that are most often publicized; that is, the total possible volumes. Any caveats are often ignored in the publicity and hype that follows such an announcement. BGS recently announced that as much as 38 trillion cubic metres of gas may reside in British shales, much in the north of England. There followed a frenzy of optimism from Government sources that this 40 years’ worth of shale gas would remove at a stroke Britain’s exposure to the world market of natural gas, currently dominated by Russia, and herald a rosy economic future to follow the present austerity similar to the successes of shale-gas in North America. Equally, there has been fear of all kinds of catastrophe from fracking on our ‘tight little island’ especially amongst those lucky enough not to live in urban wastelands. What was ignored by both tendencies was reality. In the US, fracking experience shows that only 10% at most of the gas in a fractured shale can be got out; even the mighty Marcellus Shale of the NE US underlying an area as big as Britain can only supply 6 years of total US gas demand. Britain’s entire shale-gas endowment would serve only 4 years of British gas demand.

To tap just the gas in the upper part of the Bowland basin would require 33 thousand fracking wells in northern Britain. Between 1902 and 2013 only 19 onshore petroleum wells were drilled here in an average year. To make any significant contribution to British energy markets would require 100 per annum at a minimum. Yet, in the US, the flow rate from fracked wells drops to a mere zephyr within 3 years. Fracking on a large scale may well never happen in Britain, such are the largely unstated caveats. But the current hype is fruitful for speculation that it will, and that can make a lot of cash sucked in by the prospect – without any production whatsoever.

Enhanced by Zemanta

Fresh offshore groundwater resources

There are paradoxes with groundwater: while over-use of coastal aquifers may draw in seawater to become undrinkable, on reef islands with no surface water adequate supplies may be had from fresh groundwater ‘floating’ on deeper, denser salt water. Seemingly even more odd, there are places several kilometres off some coastlines where freshwater rises in large volumes to the surface from springs on the sea floor.

Despite this and the fact that onshore aquifers extend far out to sea on continental shelves, hydrogeologists have paid scant attention to the potential water supplies that they might offer. Indeed, around the Persian Gulf where many submarine fresh springs are known petrodollars have poured into desalination rather than cheaper drilling and pipelines to the aquifers feeding the springs.

Reviewing the known potential of offshore groundwater, which occurs seawards of most continental shores, Vincent Post of Flinders University, Australia and colleagues from Holland, the US and Britain, consider that the global potential might be as high as half a million cubic kilometres (Post, V.E.A. et al. 2013. Offshore fresh groundwater reserves as a global phenomenon. Nature , v. 504, p. 71-78), around one tenth that of shallow (<750 m deep) groundwater onshore . It should be noted that the maximum safe level of salts dissolved in drinking water is about 1 gram per litre, and double that for irrigation water. The best prospects are where aquifers are trapped beneath impermeable sedimentary layers that prevent downward contamination by salt water.

The key to explaining such huge reserves is dating the water. In those places where that has been done the water is older than the Holocene (i.e. > 11 ka), which suggests infiltration when sea level was as much as 130 m lower than in interglacial periods, due to storage of evaporated seawater in major ice sheets. That would have exposed vast areas of what is now the sea floor to recharge. Modelling downward diffusion of seawater as sea level rose suggests that interglacials have too short to fully flush fresh water from the now submarine aquifers. Nevertheless, recharge is not continual, so that exploiting the resource is akin to ‘mining’ water. Yet the potential may prove essential in some coastal regions, and the authors caution against contamination by human activities offshore, such as exploration drilling for petroleum and carbon dioxide sequestration.

The review points out that submarine hydrogeology is one of the last great challenges in analysis of sedimentary basins.