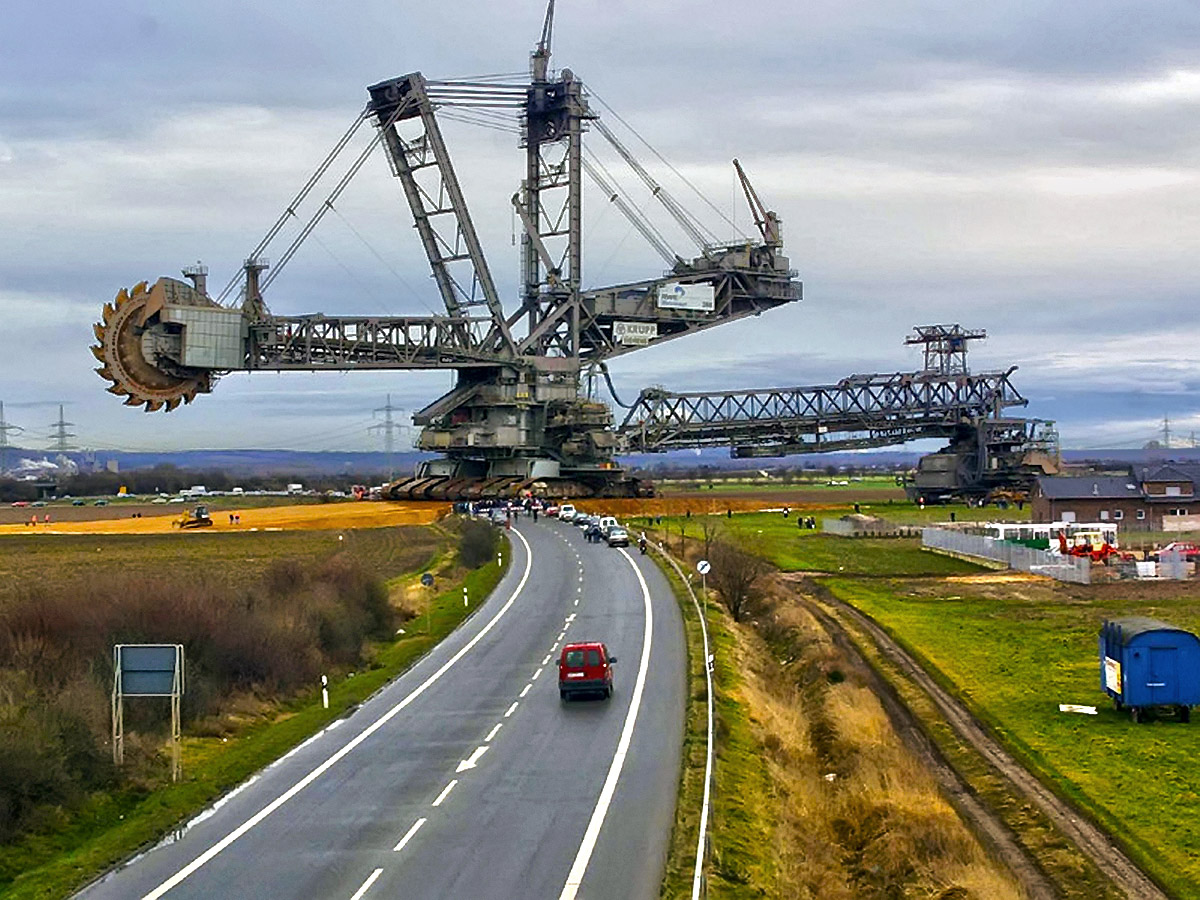
The Vattenfall lignite mine in Germany; the Anthropocene personified
The issue of whether or not to assign the time span during which human activities have been significantly affecting the planet and its interwoven Earth Systems has been dragging on since the term ‘Anthropocene’ was first proposed more than two decades ago. A suggestion that may resolve matters, both amicably and with a degree of scientific sense, has emerged in a short letter to the major scientific journal Nature, written by six eminent scientists (Bauer, A.M. et al. 2021. Anthropocene: event or epoch? Nature, v. 597, p. 332; DOI: 10.1038/d41586-021-02448-z). The full text is below
“The concept of the Anthropocene has inspired more than two decades of constructive scholarship and public discussion. Yet much of this work seems to us incompatible with the proposal to define the Anthropocene as an epoch or series in the geological timescale, with a precise start date and stratigraphic boundary in the mid-twentieth century. As geologists, archaeologists, environmental scientists and geographers, we have another approach to suggest: recognize the Anthropocene as an ongoing geological event.
The problems with demarcating the Anthropocene as a globally synchronous change in human–environment relations, occurring in 1950 or otherwise, have long been evident (P. J. Crutzen and E. F. Stoermer IGBP Newsletter41, 17–18; 2000). As an ongoing geological event, it would be analogous to other major transformative events, such as the Great Oxidation Event (starting around 2.4 billion years ago) or the Great Ordovician Biodiversification Event (around 500 million years ago).
Unlike formally defined epochs or series, geological events can encompass spatial and temporal heterogeneity and the diverse processes — environmental and now social — that interact to produce global environmental changes. Defining the Anthropocene in this way would, in our view, better engage with how the term has been used and criticized across the scholarly world.”
AUTHORS: Andrew M. Bauer, Stanford University, Stanford, California, USA; Matthew Edgeworth, University of Leicester, Leicester, UK; Lucy E. Edwards, Florence Bascom Geoscience Center, Reston, Virginia, USA; Erle C. Ellis, University of Maryland, Baltimore County, Maryland, USA ; Philip Gibbard, Scott Polar Research Institute, University of Cambridge, Cambridge, UK; Dorothy J. Merritts, Franklin and Marshall College, Lancaster, Pennsylvania, USA.
I have been grousing about the attempt to assign Epoch/Series status to the Anthropocene for quite a while (you can follow the development of my personal opinions by entering ‘Anthropocene’ in the Search Earth-logs box). In general I believe that the proposal being debated is scientifically absurd, and a mere justification for getting a political banner to wave. What the six authors of this letter propose seems eminently sensible. I hope it is accepted by International Commission on Stratigraphy as a solution to the increasingly sterile discussions that continue to wash to and fro in our community. Then perhaps the focus can be on action rather than propaganda.
As things have stood since 21 May 2019, a proposal to accept the Anthropocene as a formal chrono-stratigraphic unit defined by a GSSP at its base around the middle of the 20th century is before the ICS and the International Union of Geological Sciences (IUGS) for ratification. It was accepted by 88% of the 34-strong Anthropocene Working Group of the ICS Subcommission on Quaternary Stratigraphy. But that proposal has yet to be ratified by either the ICS or IUGS. Interestingly, one of the main Anthropocene proponents was recently replaced as chair of the Working Group.
Key ages of early H. sapiens, Neanderthals and Denisovans (credit: Delson, 2019; Fig. 1)
For almost 2 million years humans have migrated long distances, the earliest example of a move out of Africa being the Georgian Homo erectus specimens (see: First out of Africa? November 2003). As regards H. sapiens – anatomically modern humans (AMH) – the earliest fossils, found at Jebel Irhoud in Morocco, are about 300 ka old. By 260 ka they were present at several sites that span the African continent. The first sign of AMH having left Africa are fossils found at Mislaya in Israel and Apidima in Greece – dated to 177 and 210 to 170 ka respectively – and 125 ka-old tools tentatively attributed to AMH in the Arabian Peninsula (see: Arabia : staging post for human migrations?, September 2014). There is also genetically dated evidence of geneflow from Homo sapiens into Neanderthal DNA between 130 to 250 ka ago. The evidence for an early ‘Out of Africa’ migration by AMH is concrete but very sparse, a fuller story of our permanently colonising all habitable parts of the world only emerging for times after about 65 ka.
It is easy to appreciate that the main hindrance for palaeo-anthropological research into human migration centres on the issue of where to look for evidence, a great many discoveries owing more to luck than to a strategic approach. And, of course, once interesting sites are found researchers congregate there. There is a limited number of active palaeoanthropologists of whom only a proportion engage regularly in field exploration. And there is also an element of the old gold prospectors adage: ‘If you want to find elephants, go to elephant country’! But there are other issues connected with discoveries. When was it possible for AMH to make transcontinental journeys and what routes would have been feasible from time to time? Robert Beyer of the Cambridge University with scientists from New Zealand, Estonia and the UK have devised a rational approach to the questions of optimum times and routes for major migration (Beyer, R.M., et al. 2021. Climatic windows for human migration out of Africa in the past 300,000 years. Nature Communications, v. 12, article 4889; DOI: 10.1038/s41467-021-24779-1). Just two routes out of Africa have been considered feasible: by crossing the Strait of Bab el Mandab from Djibouti and southern Eritrea to the Yemen, and following the Nile northwards to access Eurasia via the Levant. The first depends to some extent on how wide the Strait was; depending on sea level fluctuations, it has varied from 4 to 20 km during the last 300 ka. Exit by way of both routes would also have depended on vegetation, game and drinking water supplies that varying amounts of rainfall would have supported.
Assessing the feasibility of crossing the southern Red Sea at different times is fairly easy. Sea level fluctuates according to the amount of water locked in the ice caps of Antarctica and Greenland and on the land glaciated during ice ages in northern North America and Scandinavia. Oxygen isotopes in Pleistocene sea-floor sediments and today’s ice caps reveal that variation. Being one of the world’s most important seaways the bathymetry of the Red Sea is known in considerable detail. At present the minimum sea distance needed to cross the Strait of Bab el Mandab is about 21 km. At the lowest sea levels during the Pleistocene the sea journey was reduced to slightly less than 5 km, which would not have required sophisticated boats or seafaring skills. There is evidence that AMH and earlier humans occupied the western shore of the Red Sea to use its rich marine resources, but none for boats or for habitation of the Yemeni coastline. However, calculations by Beyer et al. of sea level fluctuations during the last 300 ka show that for more than half that time the sea crossing was less than 7 km thanks to a shallow continental shelf and a very narrow stretch of deep water. Clearly the varying width of the Strait is not a useful guide to windows of opportunity for migration via that route. Except for warm interglacials and a few interstadials, people could have crossed at any time provided that the ecosystems on either side could sustain them.
Annual precipitation during each millennium of the Late Pleistocene for the two most likely out-of-Africa routes. The double green lines show the lower level of tolerance for hunter gatherers. The percentage of decades during which ANH could sustain themselves is colour-coded in blues. (Credit: Beyer et al. Fig 2)
Turning to climatic fluctuations, especially that of rainfall, Beyer et al. first estimated the lowest rainfall that hunter-gatherers can survive from the distribution of surviving groups according to annual precipitation and the biomass of grazing prey animals in their habitats. The lower limit is about 90 mm per year. Using the climate record for the Late-Pleistocene from proxies, such as oxygen isotopes, in global climate modelling produces a series of high-resolution ‘time-lapse snapshots’ of conditions in the geographic areas of interest – the Nile-Levant route and that from the Horn of Africa to Yemen. The results are expressed as the percentage of decades in each thousand-year interval that hunter-gatherers could sustain themselves under prevailing climatic conditions in the two regions. What seems clear from the figure (above) is that the southern, Bab el Mandab route had considerable potential for AMH migrants. The northern one looks as if it was more risky, as might be expected from today’s dominant aridity away from the Mediterranean and Gulf coasts. The northern route seems to have been just about feasible for these periods: 245-230; 220-210; 206-197; 132-94; 85-82; ~75 and ~72 ka. The climatic windows for possible migration via the southern route are: ~290; 275-240 (with optimums at ~273, ~269, ~246 and ~243); 230-210; 203-200; 182-145; 135-118; 112; 107; 70-30; 18-13 ka. The well documented beginning of major AMH migration into Eurasia was around 75 to 60 ka, which the southern route would most favour on climatic grounds. Yet before that there are many possibilities involving either route. Any AMH finds outside Africa before 250, and between 190-133 ka seem almost certain to have been via the southern route, based on arid conditions in the north. But, of course, there would have been other factors at play encouraging or deterring migration via either route. So perhaps not every climatic opportunity was exploited.
Beyer and colleagues have provided a basis for plenty of discussion and shifts in focus for future palaeo-anthropological work. One thing to bear in mind is that different humans may also have taken up the opportunities; for example, some Neanderthals are now suspected to have migrated back to Africa in the last 300 ka.
On 14-15 August 2021 it rained for the first time since records began at the highest point on the Greenland ice cap. Summit Camp at 3.216 m is run by the US National Science Foundation, which set it up in 1989, and is famous for climate data gleaned from two deep ice cores there. This odd event came at a time when surface melting of the ice cap covered 870 thousand km2: over half of its total 1.7 million km2 extent: a sure sign of global warming. The average maximum temperature in August at Summit is -14°C, but since the mid 20th century the Arctic has been warming at about twice the global rate. Under naturally fluctuating climatic conditions during the Pleistocene, associated with glacial-interglacial cycles, Greenland may have been ice-free for extended periods, perhaps as long as a quarter of a million years around 1.1 Ma ago. If 75% of the up to 3 km thick ice on Greenland melted that would add 5 to 6 m to global sea level, perhaps as early as 2100 if current rates of climate warming persist.
The edge of the ice cap in NE Greenland (credit: Wikipedia)
The worst scenario is runaway warming on the scale of that which took place 56 Ma ago during the Palaeocene-Eocene Thermal Maximum (PETM) when global mean temperature rose by between 5 to 8°C at a rate comparable with what the planet is experiencing now as a result of growth in the world economy. In fact, the CO2 released during the PETM emerged at a rate that was only about tenth of modern anthropogenic emissions Sediments that span the Palaeocene-Eocene boundary occur in NE Greenland, a study of which was recently published by scientists from Denmark, Greenland, the UK, Australia and Poland (Hovikoski, J. and 13 others 2021. Paleocene-Eocene volcanic segmentation of the Norwegian-Greenland seaway reorganized high-latitude ocean circulation. Communications Earth & Environment, v. 2, article 172; DOI: 10.1038/s43247-021-00249-w). The greenhouse world of NE Greenland that lay between 70 and 80°N then, as it still does, was an area alternating between shallow marine and terrestrial conditions, the latter characterised by coastal plain and floodplain sediments deposited in estuaries, deltas and lakes. They include coals derived from lush, wooded swamps, inhabited by hippo-like ungulates, primates and reptiles.
At that time the opening of the northern part of the North Atlantic had barely begun, with little chance for an equivalent of the Gulf Stream to have had a warming influence on the Arctic. Shortly after the PETM volcanism began in earnest, to form the flood basalts of the North Atlantic Igneous Province. Each lava flow is capped by red soil or bole: further evidence for a warm, humid climate and rapid chemical weathering. As well as lava build-up, tectonic forces resulted in uplift, effectively opening migration routes for animals and land plants to colonise the benign – for such high latitudes – conditions and perhaps escape the far hotter conditions further south.
The situation now is much different, with the potential for even more rapid melting of the Greenland ice cap to flood freshwater into the North Atlantic, as is currently beginning. Diluting surface seawater reduces its density and thus its tendency to sink, which is the main driving force that pulls warmer water towards high-latitudes in the form of the Gulf Stream. Slowing and even shutting down its influence may have an effect that contradicts the general tendency for global warming – a cooling trend at mid- to high latitudes with chaotic effects on atmospheric pressure systems, the jet stream and weather in general.
Sooner rather than later all energy users will be forced to change their source of energy to ones that do not involve fossil fuels. On average, 84% of household energy consumption is for space heating and hot water. Reducing domestic greenhouse gas emissions must replace the current dominance of coal, natural gas and oil in keeping ourselves warm and clean. One widely suggested solution is the use of heat pumps to ‘concentrate’ the solar energy that is temporarily stored in air or in the soil and rock just beneath our homes and gardens: air- and ground-source heating systems. Heat pumps rely on overcoming the Second Law of Thermodynamics, as do refrigerators and air conditioners. The Law implies that hot things always cool down; that is, energy cannot move ‘of its own accord’ from a cooler source to a warmer destination. But reversing the natural flow of heat energy is possible. To achieve this involves work in some form. There are several kinds of heat pumps powered by electricity, the simplest using a vapour compression cycle, as in refrigeration, which ‘pumps’ heat out of a fridge interior or a room. So, warm air is emitted to the outside world. Reverse the flow and the pump becomes a device that captures heat from a cold source – either a gas or a fluid – and delivers it for a domestic or industrial use.
In the case of a ground-source heat pump, the energy delivered also includes geothermal heat flowing from deep in the Earth: ultimately from radioactive decay of unstable isotopes bound up in rocks and the minerals they contain. At the surface, this supply is far less than solar heating. Yet, because of the Second Law of Thermodynamics it flows from a much hotter source: the Earth’s mantle. The deeper down, the hotter it gets. Beneath most of the continental surface temperature increases at between 15 to 35°C per kilometre. Without surface air being circulated to the deepest parts of mines it would be impossible to work in them. I remember as a school student visiting the deepest level of Maltby Main coal mine in South Yorkshire. Because my school was co-educational, our guide shouted ahead to the miners that women were coming – these miners normally worked in just helmet, boots and a jock strap! Dozens of them rushed frantically to find their trousers. Maltby Main’s shafts reached almost a kilometre below the surface and without ventilation the air temperature would have been more than 50°C. As it was, it was well above 30 degrees
As well as methane (‘fire damp’), CO2 (‘choke damp’) and roof collapse, one of the main hazards of coal mining is flooding by groundwater. When operational, before the Conservative governments of the 1980s and early 90s set about destroying deep-coal mining in Britain, all mines had massive pumps to remove water from their deepest levels or ‘sumps’. It is hazardous stuff, being highly acidic and rich in dissolved metals – including arsenic in some areas – as well as being warm: a low-temperature hydrothermal fluid. In many cases such water seeps to the surface from the now flooded mine workings, and precipitates brightly coloured iron hydroxides. Most of the abandoned British coalfields are plagued by such minewater escaping to the surface. Untreated it contaminates surface water, soils and sediments, posing threats to vegetation, wild life and people. Yet, it has considerable potential as a heat source, especially for community heating systems based on large-scale heat pumps (Farr, G. et al. 2020. The temperature of Britain’s coalfields. Quarterly Journal of Engineering Geology and Hydrogeology, v. 54, article qjegh2020-109; DOI: 10.1144/qjegh2020-109).
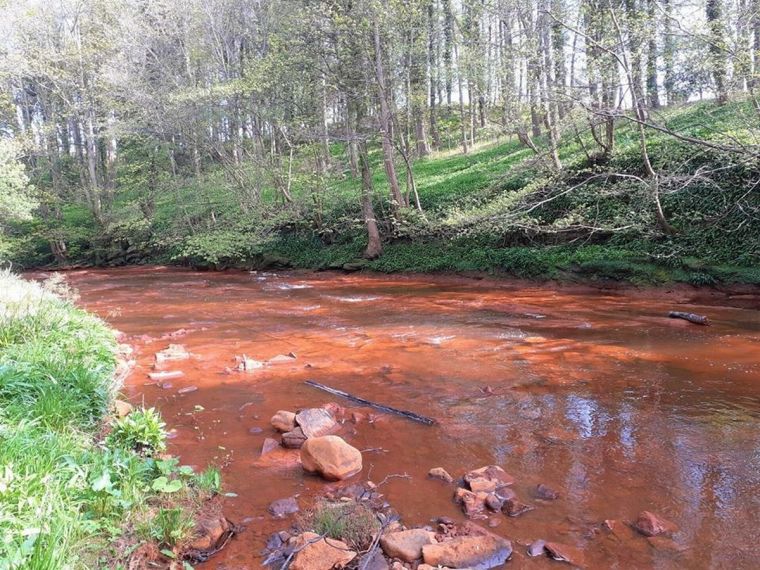
Pollution of South Esk river near Edinburgh by water from old coal-mine workings (Credit: EdinburghLive, 11 June 2020)
For decades, geothermal energy has been touted as a near-ideal renewable, carbon-free resource, using natural hot-spring systems in volcanically active areas, such as Iceland and New Zealand, from areas of unusually high heat flow over highly radioactive granite intrusions or from very deep sedimentary aquifers as exploited in parts of the Paris Basin. But in Britain various optimistic projects have arisen and then faded away. All relied on pumping surface water down boreholes to depths that achieve high temperatures, returning it to the surface at around 60°C to the surface and then piping it to users: very expensive. About a quarter of the population live above the former coalfields of Britain. Around 2.2 million gigawatt hours of geothermal heat are currently stored in flooded mine workings, with the possibility of further expansion. The UK Coal Authority has about 40 minewater pumping stations aimed at reducing pollution, which remove 3,000 l s-1 at an average temperature of around 9-18°C. Expressed in terms of energy content this amounts to 63 MW if recovered. But this is just scratching the surface of the potential for large-scale district heating based on heat pumps, such as that planned at Seaham, County Durham to heat 1500 new homes. Community heating and wastewater treatment can be combined for all the former coal mining areas in Central Scotland, the North of England and Midlands and South Wales where population densities are still very high
Since the start of 2020 I doubt there has been much field research. But such a vast amount of data has been amassed over the years that there must be opportunities to keep the academic pot boiling. One way is to look for new correlations between different kinds of data. For instance matching the decades-old time series of extinctions with those of other parameters that have changed over geological time. At a time of growing concern about anthropogenic climate change a group based at the State Key Laboratory of Biogeology and Environmental Geology, at China University of Geosciences, Wuhan have checked the extinction rates of marine fossils over the last 450 Ma against variations in sea-surface temperature (Song, H. et al 2021. Thresholds of temperature change for mass extinctions. Nature Communications, v. 12, Article number 4694; DOI: 0.1038/s41467-021-25019-2).
Extinction data are usually presented in time ‘bins’ based on the number of disappearances of fossil genera in one or a number of geological Stages – the finest divisions of the stratigraphic column. The growing data set for sea-surface temperatures derived using oxygen isotopes from marine fossil shells is more continuous, being derived from many different layers of suitable sedimentary rock within a Stage. Clearly, the two kinds of data have to be expressed in a similar way to check for correlations. Haijun Song and co-workers converted both the extinction and temperature time series to 45 time ‘bins’, each around 10 Ma long. They express the binned climatic data in two ways: as the largest temperature change (°C) and the highest rate of temperature change (°C Ma-1) within each bin. That is, they expressed to some extent the greater continuity of seawater temperature data as well as matching them to those for extinctions.
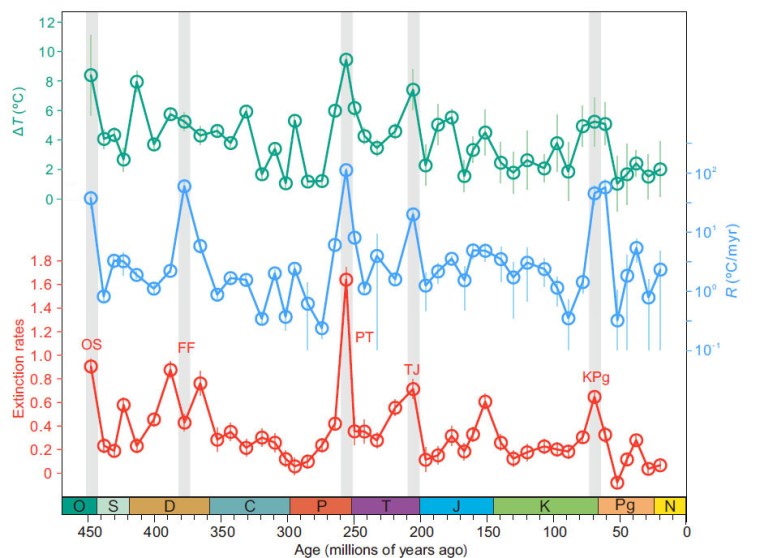
Changes since the end of the Ordovician: red = extinction rate in time bins; green = the greatest magnitude of change in temperature in each bin; blue- the greatest rate of temperature change in each bin. Grey bars show mass extinctions (Credit: Song et al., Fig 1)
There are good correlations between the climatic and extinction data, particularly for mass extinctions. Bearing in mind that mass extinctions take place far more rapidly than can be expressed with 10 Ma time bins, the authors were concerned that bias could creep into the binned extinction data. They were able to discount this by examining both data sets in finer detail at the times of the ‘Big 5’ extinctions. Earlier research had identified warming episodes around the times of each mass extinction, often implicating greenhouse-gas emissions from Large Igneous Provinces. Yet there are other factors that may have influenced the 7 ‘lesser’ mass extinctions in the fossil record. The authors are sufficiently confident in the correlations they have revealed to suggest thresholds that seem to have launched major mass extinctions: greater than 5.2 °C and 10 °C Ma-1 for magnitudes and rates of sea-surface temperature change, respectively.
In the context of the modern climate, the data analysis predicts that a rise of 5.2 °C above the preindustrial mean global temperature spells extinctions of ‘Big Five’ magnitude. The rate of temperature increase since 1880 – 0.08 ° per decade – is hugely faster than that expressed by the data that span the last 450 Ma. This is more alarming than the stark Sixth Report of the Intergovernmental Panel on Climate Change IPCC released on 9 August 2021.
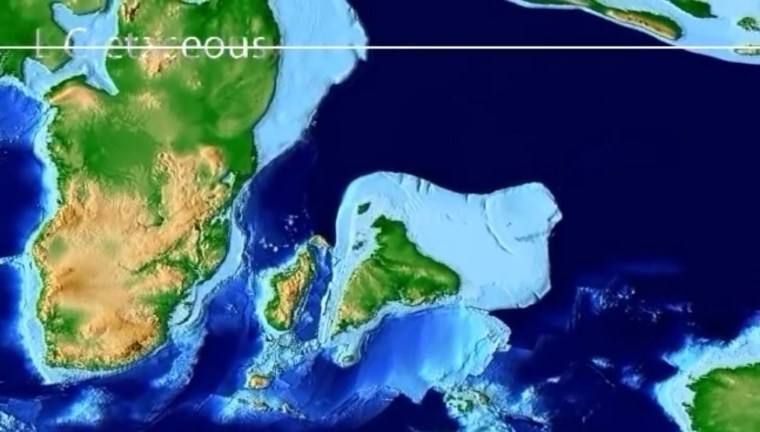
During the Early Cretaceous (~140 Ma ago) India, Madagascar, Antarctica and Australia parted company with Africa after 400 Ma of unity as components of the Gondwana supercontinent. By 120 Ma Antarctica and Australia split from India and Madagascar, and the Indian Ocean began to form. India moved northwards , leaving Madagascar in its wake after about 70 Ma ago. By 50 Ma the subcontinent began to collide with Eurasia, its northward motion driving before it crustal materials that eventually formed the Himalaya. This highly complex process is wonderfully documented in an animation made in 2015 by Christopher Scotese, Emeritus Professor in the Department of Earth and Environmental Sciences, Northwestern University, USA. At the start of its journey India moved northwards at a slow rate of about 5 cm per year. After 80 Ma it speeded up dramatically to 15 cm per year, about twice as fast as any modern continental drift and a pace that lasted for over 30 Ma until collision began. How could that, in a geological sense, sudden and sustained acceleration have been induced? It would have required a change in the slab-pull force that is the primary driver of plate tectonics, suggesting an increase in the amount of subduction in the Tethys Ocean that formerly lay between India and Eurasia, probably at two, now hidden destructive plate margins.
A group of geoscientists from Canada, the US and Pakistan has documented that collision in terms of the record of metamorphism experienced beneath the Himalaya as slab after slab of once near-surface rocks were driven beneath the rising orogen (Soret, M. et al. 2021. How Himalayan collision stems from subduction. Geology, v. 49, p. 894-898; DOI: 10.1130/G48803.1). The Western Himalaya has trapped a deformed and tilted magmatic rock sequence of an island arc – the Kohistan Arc – between the Eurasian plate and a zone of crustal thickening and shortening that was thrust southward over the ancient metamorphic basement of India itself. That crust was mantled by a variety of younger sediments deposited on the Tethyan continental shelf of the northern Indian plate which became involved in the process of crustal thickening. The Kohistan Arc probably formed above one of the destructive margins that consumed the oceanic lithosphere of the now vanished Tethys Ocean. Two distinct types of rock make up the slabs stacked-up by thrusting.
The uppermost, which also forms the highest part of the Western Himalaya in the form of Nanga Parbat (at 8,126 metres the world’s ninth highest mountain) comprises rocks thought to represent Tethyan oceanic lithosphere subducted perhaps at the second destructive margin. Their mineral assemblages, especially those of eclogites, indicate that they have been metamorphosed under pressures corresponding to depths of up to 100 km, but at low temperatures along a geothermal gradient of about 7°C km-1, i.e. in a low heat-flow environment. These ultra-high pressure (UHP) metamorphic rocks formed at the start of the India-Eurasia collision. The sequence of sedimentary slabs now overridden by the UHP slab were metamorphosed at around the same time, but under very different conditions. Their burial reached only about 35 km – the normal thickness of the continental crust – and a temperature of about 600°C on a 30°C km-1 geothermal gradient. Detailed mineralogy of the UHP slab reveals that as it was driven over the metasediments it evolved to the same geothermal conditions.
Matthew Soret and his colleagues explain how this marked metamorphic duality may have arisen in rocks that are now part of the same huge thrust complex. Their results are consistent with slicing together of oceanic lithosphere in a subduction zone to form a tectonic wedge of UHP mineral assemblages at the same time as continental shelf sediments were metamorphosed under more normal geothermal conditions. This was happening just as India came into contact with Eurasia. When crustal thickening began in earnest through the inter-slicing of the two assemblages, pressure on the UHP rocks fell rapidly as a result of their being thrust over the dominantly metasedimentary shelf sequence. It also moved into a zone of normal heat flow, first heating up equally quickly and then following a path of decreasing pressure and temperature as erosion pared away the newly thickened crust. Both assemblages now became part of the same metamorphic regime. In this way a subduction system evolved to become incorporated in an orogenic zone as two continents collided; a complex process that finds parallels in other orogens such as the Alps.
The idea that the Earth was like a giant snowball during the Neoproterozoic Era arose from the discovery of rocks of that age that could only have formed as a result of glaciation. However, unlike the Pleistocene ice ages, evidence for these much older glacial conditions occurs on all continents. In some locations remanent magnetism in sedimentary rocks of that age is almost horizontal; i.e. they had been deposited at low magnetic latitudes, equivalent to the tropics of the present day. Frigid as it then was, the Earth still received solar heating and magmatic activity would have been slowly adding CO2 to the atmosphere so that less heat escaped – a greenhouse effect must have been functioning. Moreover, an iced-over world would not have been supporting much photosynthetic life to draw down the greenhouse gas into solid carbohydrates and carbonates to be buried on the ocean floor. As far as we know the Solar System’s geometry during the Neoproterozoic was much as it is today. So changes in the gravitational fields induced by the orbiting Giant Planets would have been affecting the shape (eccentricity) of Earth’s orbit, the tilt (obliquity) of its rotational axis and the precession (wobble) of its rotation as they do at present through the Milankovich effect. These astronomical forcings vary the amount of solar energy reaching the Earth’s surface. It has been suggested that a Snowball Earth’s climate system would have been just as sensitive to astronomical forcing as it has been during the last 2 million years or more. Proof of that hypothesis has recently been achieved, at least for one of the Snowball events (Mitchell, R.N. and 8 others 2021. Orbital forcing of ice sheets during snowball Earth. Nature Communications, v. 12, article 4187; DOI: 10.1038/s41467-021-24439-4).
Another of the enigmas of the Neoproterozoic is that after and absence of more than a billion years banded iron formations (see: Banded iron formations (BIFs) reviewed, December 2017) began to form again. BIFs are part of the suite of sedimentary rocks that characterise Snowball Earth events, often alternating with glaciogenic sediments. Throughout each cold cycle – the Sturtian (717 to 663 Ma) and Marinoan (650 to 632 Ma) glacial periods – conditions of sediment deposition varied a great deal from place to place and over time. Some sort of cyclicity is hinted at, but the pace of alternations has proved impossible to check, partly because the dominant rocks (glacial conglomerates or diamictites) show little stratification and others that are bedded (various non-glacial sandstones) vary from place to place and give no sign of rates of deposition, having been deposited under high-energy conditions. BIFs, on the other hand are made up of enormous numbers of parallel layers on scales from millimetres to centimetres. Bundles of bands can be traced over large areas, and they may represent repeated cycles of deposition.
Typical banded iron formation
How BIFs formed is crucial. They were precipitated from water rich in dissolved iron in its reduced Fe2+ (ferrous) form, which originated from sea-floor hydrothermal vents. Precipitation occurred when the amount of oxygen in the water increased the chance of electrons being removed from iron ions to transform them from ferrous to ferric (Fe3+). Their combination with oxygen yields insoluble iron oxides. Cyclical changes in the availability of oxygen and the balance between reducing and oxidising conditions result in the banding. In fact several rhythms of alternation are witnessed by repeated packages at deci-, centi- and millimetre scales within each BIF deposit. Overall the packages suggest a constant rate of deposition: a ‘must-have’ for precise time-analysis of the cycles. BIFs contain both weakly magnetic hematite (Fe2O3) and strongly magnetic magnetite (Fe3O4), their ratio depending on varying geochemical conditions during deposition. Ross Mitchell of Curtin University, Western Australia and his Chinese, Australian and Dutch colleagues measured magnetic susceptibility at closely spaced intervals (1 and 0.25 m) in two section of BIFs from the Sturtian glaciation in the Flinders Ranges of South Australia. Visually both sections show clear signs of two high-frequency and three lower frequency kinds of cycles, expressed in thickness.
The tricky step was converting the magneto-stratigraphic data to a time series. High-precision zircon U-Pb dating of volcanic rocks in the sequence suggested a mean BIF deposition rate of 3.7 to 4.4 cm per thousand years. This allowed the thickness of individual bands and packages to be expressed in years, the prerequisite for time-series analysis of the BIF magneto-stratigraphic sequence. This involves a mathematical process known as the Fast-Fourier Transform, which expresses the actual data as a spectral curve. Peaks in the curve represent specific frequencies expressed as cycles per metre. The rate of deposition of the BIF allows each peak to be assigned a frequency in years, which can then be compared with the hypothetical spectrum associated with the Milankovich effect. One of the BIF sequences yielded peaks corresponding to 23, 97 and 106 ka. These match the effects of variation in precession (23 ka) and ‘short’ orbital eccentricity (97 and 106 ka) found in Cenozoic sea-floor sediments and ice cores. The other showed peaks at 405, 754 and 1.2 Ma corresponding to ‘long’ orbital eccentricity and long-term features of both obliquity and precession. Quite a result! But how does this bear on Snowball Earth events? Cyclical changes in solar heating would have affected the extent of ice sheets and sea ice at all latitudes, forcing episodes of expansion and contraction and thus changes in sediment supply to the sea floor. That helps explain the many observed variations in sedimentation other than that of BIFs. Rather than supporting a ‘hard’ Snowball model of total marine ice cover for millions of years, it suggests that such an extreme was relieved by period of extensive open water, much as affected the modern Arctic Ocean for the last 2 million years or so. There could have been global equivalents of ice ages and interglacials during the Sturtian and Marinoan. ‘Hard’ conditions would have shut down much of the oceans’ biological productivity, periodically to have been reprieved by more open conditions: a mechanism that would have promoted both extinctions and evolutionary radiations. Snowball events may have driven the takeover of prokaryote (bacteria) dominance by that of the multicelled eukaryotes that is signalled by the Ediacaran faunas that swiftly followed glacial epochs and the explosion of multicelled life during the Cambrian. As eukaryotes, we may well owe our existence to Snowball.
Three weeks ago I commented on a novel and progressive use for coal seams as stores for large quantities of hydrogen gas. That would be analogous to batteries for solar- and wind power plants by using electricity generated outside times of peak demand to electrolyse water to hydrogen and oxygen. There are other abundant rocks that naturally react with the atmosphere to permanently sequester carbon dioxide in alteration products, and form possible solutions to global warming. The most promising of these contain minerals that are inherently unstable under surface conditions; i.e. when they come into contact with rainwater that contains dissolved CO2. The most common are anhydrous minerals containing calcium and magnesium that occur in igneous rocks. Basalts contain the minerals plagioclase feldspar (CaAl2Si2O8), olivine ([Fe,Mg]2SiO4)] and pyroxene ([Fe,Mg]CaSi2O6)] that weather to yield the minerals calcium and magnesium carbonate. My piece Bury the beast in basalt, written in June 2016, mentions experiments in the basalts of Iceland and Washington State, USA to check their potential for drawing down atmospheric CO2. News of an even more promising prospect for CO2 sequestration in igneous rock emerged in the latest issue of Scientific American (Fox, D. 2021. Rare Mantle Rocks in Oman Could Sequester Massive Amounts of CO2. Scientific American, July 2021 issue).
Distribution of ophiolites around the Eastern Mediterranean and Black Seas. Most orogenic belts carry comparable volumes of ophiolites. (Credit: Gültekin Topuz, Istanbul Technical University)
The most abundant magnesium-rich material in our planet is the peridotite of the mantle, which consists of more than 60% olivine with lesser amounts of pyroxene and almost no feldspar. Being so rich in Mg and Fe, it is said to have an ultramafic composition and is extremely prone to weathering. The rock dunite is the ultimate ultramafic rock being made of more than 90% olivine. All ultramafic rocks are denser than 3,000 kg m-3, so might be expected to be rare in lower density continental crust (2,600 kg m-3). But they are present at the base of sections of oceanic lithosphere that plate tectonics has thrust up and onto the continents, known as ophiolite bodies. They often occur in orogenic belts at former destructive plate margins and are more common than one might expect. One of the largest and certainly the best-exposed occurs in the Semail Mountains of Oman, where scientists from the Lamont-Doherty Earth Observatory, New York State, USA, and other collaborators have been investigating its potential for absorbing CO2, since 2008.
Olivine-rich rocks react with naturally carbonated groundwater or hydrothermal fluids to form soft, often highly coloured material known as serpentine, well-known for the ease with which it can be carved and polished. As well as the mineral serpentinite [Mg3Si2O5(OH)4], the hydration reactions yield magnetite (Fe3O4), magnesium carbonate (magnesite) and silica (SiO2). If reaction takes place in the absence of oxygen gaseous hydrogen also forms. All these have been noted in the Oman ophiolite: fractures in serpentinites are filled with carbonates, and springs associated with them emit copious amounts of hydrogen and, in some cases, methane. Interestingly, the reactions – like those that involve anhydrous calcium-aluminium silicates when cement is wetted and then cures – release large amounts of heat. This makes the reactions self-sustaining once they begin in peridotite or dunite. However, at the Earth’s surface they are somewhat sluggish as the heat of reaction is lost to the air.
Mantle rock in the Oman ophiolite, showing cores of fresh peridotite, brownish serpentinite and white carbonate veins (credit: Juerg Matter, Oman Drilling Project, Southampton University, UK)
The capacity for CO2 sequestration by ultramafic igneous rocks is high: a ton of olivine when completely hydrated takes in 0.62 tons of CO2. The Lamont-Doherty team has estimated that they speed up in crushed peridotite, for instance after milling during industrial-scale mining – peridotites are host rocks for platinum-group metals, nickel and chromium. (Kelemen, P.B. et al. 2020. Engineered carbon mineralization in ultramafic rocks for CO2 removal from air. Chemical Geology, v. 550, article 119628; DOI: 10.1016/j.chemgeo.2020.119628). Spreading mine waste over large areas of desert surfaces would be one way of capturing CO2. However, using the age of emplacement of the Oman ophiolite (96-70 Ma) and the amount of carbonate found in fractured serpentinite there, the team estimates that each ton of the 15 m deep zone of active weathering has naturally absorbed CO2 at a rate of about 1 g m-3 year-1 equivalent to 1000 tons per cubic km per year. But parts of the ophiolite have been fully altered to serpentinite plus carbonates since the Cretaceous, probably at depth. Dating some of the near-surface carbonate veins revealed that they had formed in only a few thousand years rather than the tens of million years expected. Natural sequestration could therefore be happening at depth about 10,000 times faster than theory predicts. Also natural springs emerging from the peridotite are highly alkaline and by combining with atmospheric carbon dioxide precipitate carbonate to form travertine deposits at the surface. This is so rapid that if the carbonate is scraped off the exposed rock, within a year it has recoated the surface.
This year, deep drilling into the Oman ophiolite has begun. To the surprise of members of the team, carbonate minerals are not present in the bedrock below 100 m depth: CO2 is not penetrating naturally beyond that depth. If it becomes possible to inject CO2 deep beneath the surface the exothermic reactions could be kick-started. This would involve sinking pairs of boreholes to set up a flow of carbon-charged water from the ‘injection’ hole to the other that would return decarbonised water to the surface for re-use. The carbon-capture experiment in Iceland (Carbfix) has been running since 2012. Carbon dioxideseparated from hot water passing through a geothermal power plant is re-injected into basalt at a depth of half a kilometre. This small pilot runs at a cost of US$25 per ton of sequestered gas. But it uses already concentrated CO2, whereas global-scale sequestration would require capturing, compressing and dissolving it directly from the atmosphere, probably costing about $120 to $220 per ton injected into mantle rock. The engineering required – about 5,000 boreholes – to capture a billion tons of CO2 deep in the Oman ophiolites is achievable with current technology. Since 2005 almost 140 thousand fracking wells have been sunk in the US alone; they are analogous to the paired holes needed for sequestration. Worldwide, the petroleum industry has driven tens of million wells for conventional oil and gas extraction.
The energy needed to run carbon capture in mantle rocks in an arid country like Oman could be solar derived. Moreover, there are possible by-products such as hydrogen released by the chemical reactions. The alternative, more conventional approach of pumping CO2 into deep, permeable sedimentary reservoirs also carries substantial costs but has the disadvantage of possible leakage. Ophiolites are not rare, occurring as they do in areas of ancient destructive plate margins. So permanently locking away excess atmospheric greenhouse gases currently driving global warming would require only a tiny proportion of the volume of peridotite that is easily accessible by drilling. It would clearly cost an eye-watering sum, but bear in mind that the four biggest petroleum companies – BP, Shell, Chevron and Exxon – have harvested profits of around US$ 2 trillion since 1990. Along with the global coal industries, they are the source of the present climate emergency.
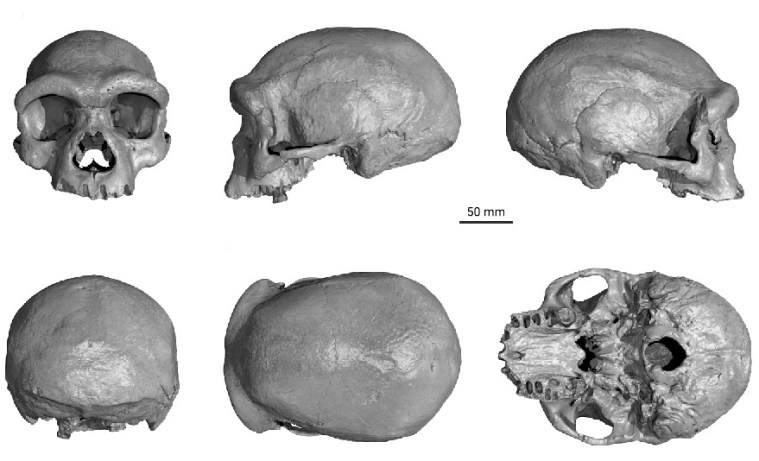
In 1933 labourers unearthed a very large skull during the construction of a bridge near Harbin, Northern China. At that time, the area was under occupation by Imperial Japanese forces. To keep it out of the invaders’ hands the skull was quickly wrapped in a cloth and hidden in an old well. It was only in 2018 that the original finder’s grandson recovered it to pass on to archaeologists at Hebei Geo University. It lacks a lower jawbone, so technically it is a cranium, but is very well preserved. The face has very large brow ridges – generally taken as a primitive feature – but also some more modern features. With a 1,420 ml brain case, it is significantly larger than most modern human crania. Apparently, it is of an adult male. As well as a big head, he had a large nose, as do Neanderthals: a possible adaptation to very cold conditions. Without waiting to see if the bones might yield DNA, five of the team who examined the cranium claimed it as a new species, Homo longi or ‘Dragon Man’; i.e. distinct from modern humans and Neanderthals and all known older hominins (Ni, X. et al. 2021. Massive cranium from Harbin establishes a new Middle Pleistocene human lineage in China. The Innovation, v. 2, article 100130; DOI: 10.1016/j.xinn.2021.100130. Ji, Q. et al. 2021. Late Middle Pleistocene Harbin cranium represents a new Homo species. The Innovation, v. 2, article 100132; DOI: 10.1016/j.xinn.2021.100132). They based this phylogenetic interpretation on morphology alone. At least one of the team, Chris Stringer a leading hominin palaeoanthropologist at The Natural History Museum in London, demurred. The cranium is not unique and bears close similarity to another from the central Chinese province of Shaanxi, which was found in the late 1970s. In fact there are three other Chinese crania that resemble that from Harbin, although they are less well preserved.
All-sided views of the Harbin cranium. (Credit: Ni et al., Fig 2)
Dating the fossil was not easy, as the site where labourers discovered him was destroyed during construction of the bridge. Researchers used a variety of geochemical analyses, including from sediment stuck in his nasal cavity, to derive a likely stratigraphic profile from which the cranium may have been excavated. The best fit is with Middle Pleistocene sediments in the Harbin area. Uranium-series dating of the bone suggests that it is older than 146 ka (Shao, Q. et al. 2021. Geochemical locating and direct dating of the Harbin archaic human cranium. The Innovation, v. 2, article 100131; DOI: 10.1016/j.xinn.2021.100131). So it is likely that this man and his companions did not cohabit China with anatomically modern humans, who arrived no more than about 50 ka ago. The highly robust nature of all the similar crania suggests that the individuals must have been large and physically active. Like the Neanderthals, they had adapted to harsh conditions over several hundred thousand years of repeated climate change. Even today, winters in northern China average around -16°C, and far inland conditions are semi-arid to arid. For them to migrate would have involved traversing some of highest, bleakest passes in the world. These people evolved to survive extreme climatic and environmental change, much as did the Neanderthals in West Asia and Europe. By comparison anatomically modern humans evolved in the more stable environments of Africa and the Middle East, surviving only the last ice age once they had migrated northwards. Those who made it to northern Siberia and crossed the Bering Strait via Beringia around the last glacial maximum did evolve physical traits that helped them survive, but minor ones compared with the earlier humans.
So what do these Chinese fossils represent? Using cranial features alone to propose distinct species smacks of the techniques of 19th and early 20th century anatomical anthropologists, albeit with powerful statistical analysis. We know that anatomically modern humans carry genetic signatures of interbreeding with at least two known ‘species’ with whom they cohabited Eurasia – Neanderthals and Denisovans. Indeed, traces in the DNA of living African and Eurasian humans hint at other unknown and probably very ancient ‘ghost’ populations. Genetic, physical and probably cultural differences did not deter repeated interbreeding with these ‘others’. To be frank, erecting new human ‘species’ these days seems to serve little purpose. ‘Dragon Man’ is just as likely to represent the Denisovans as the fully sequenced DNA from a couple of bones from caves in Siberia and Tibet. The latter matched stretches of the DNA from living people of East Asia and parts of the Pacific. There are no other such live genetic tracers awaiting a different candidate to fill the role that we know Neanderthals and Denisovans to have filled. That may yet change, but the first job for the mainly Chinese consortium of scientists is to get genetic material from these crania and sequence it, or invite other highly successful palaeogeneticists who would leap at the opportunity.
The surface of Venus is not easily observed because of the almost opaque nature of its atmosphere. The planet is veiled by a mixture of CO2 (96.5%) and nitrogen (3.5%), with a little sulfur dioxide and noble gases. The atmosphere’s mass is almost 100 times that of the Earth’s, and has a density about 6.5% that of liquid water at the surface. The opacity stems from a turbulent upper layer of mainly sulfuric acid. Venus is the victim of runaway greenhouse conditions. Despite that, radar can penetrate the atmosphere to reveal details of its surface morphology – roughness and elevation – at a spatial resolution of 150 m. Although coarser than that available from radar remote sensing of the Earth from orbit, the Magellan data are still geologically revealing.
Earlier interpretation of Venus radar images revealed the surface to be far simpler than that of the Earth, Mars and all other rocky bodies in the Solar System. Yet it has more volcanoes than does the Earth or Mars. However, despite being subject to very little erosion – Venus is a dry world – only around 1000 impact craters have been found: far short of the number seen on Mars or the Moon. This deficiency of evidence for bombardment suggests that Venus was ‘repaved’ by vast volcanic outpourings in the geologically recent past, estimated to have occurred 300 to 600 Ma ago. This early work concluded that plate tectonics was absent; indeed that for half a billion years the lithosphere on Venus had been barely deformed. It has been suggested that Venus has been involved in megacycles of sudden, planet-wide magmatic activity separated by long periods of quiescence. This could be attributed to the lack of plate tectonics, which is the principal means that Earth continuously rids itself of heat produced at depth by decay of radioactive isotopes in the mantle. Venus has been suggested to build up internal temperatures until they reach a threshold that launches widespread partial melting of its mantle. Planet-wide eruption of magma then reduces internal temperatures.
Polygonal blocks or ‘campuses’ on the lowland surface of Venus. Note the zones of ridges that roughly parallel ‘campus’ margins. Credit: Paul K. Byrne, North Carolina State University and Sean C. Solomon, Lamont-Doherty Earth Observatory
It comes as a surprise that 26 years after Magellan plunged into the Venusian atmosphere new interpretation of its radar images suggests a completely different scenario (it may be that academic attention generally switched to research on Mars because of all the missions to the ‘Red Planet’ since Magellan disappeared). It is based on features of the surface of Venus so large that their having been missed until now may be a planetary-scale example of ‘not seeing the woods for the trees’! Geoscientists from the US, Turkey, the UK and Greece have mapped out features ranging from 100 to 1000 km across that cover the lowland parts of Venus (Byrne, P.K. et al. 2021. A globally fragmented and mobile lithosphere on Venus. Proceedings of the National Academy of Science, v. 118, article e2025919118; DOI: 10.1073/pnas.2025919118). They resemble 1950s ‘crazy paving’ or floes in Arctic pack ice, but on a much larger scale. Extending the ice floe analogy, the polygonal blocks are separated by what resemble pressure ridges that roughly parallel the block margins. Paul Byrne of North Carolina State University, USA, and co-workers also found evidence that the large blocks of lithosphere had rotated and moved laterally relative to one another: they had ‘jostled’. Moreover, some of the movement has disturbed the youngest materials on the surface.
To distinguish what seem to be characteristic of Venus’s tectonics from Earthly tectonic plates, the team hit on the name ‘campus’, meaning ‘field’ in Latin. Rather than having remained a single spherical skin of lithosphere, the surface of at least part of Venus has broken into a series of ‘campuses’. It does display tectonics, but not as we know it on planet Earth. This could be ascribed to an outcome of stress transfer from deep convective motion in the Venerean mantle. Being in the virtually non-magmatic phase of Venus’s thermal cycling, there is neither formation of new lithosphere nor subduction of old, cold plates that characterise terrestrial plate tectonics. ‘Campus’ tectonics seems likely to be another form of planetary energy and matter redistribution, and Byrne et al. have likened it to how the Earth may have functioned during the ‘missing’ 600 Ma of the Hadean Eon on Earth. But perhaps not …
The runaway greenhouse has resulted in surface temperatures on Venus being 450°C higher than on Earth: enough to melt lead. It is not just solar heat that is trapped by the atmosphere, but that from the Venerean interior. This must result in a very different geotherm (the way temperature varies with depth in a planet) from that characterising the Earth. The temperature of the beginning of mantle melting – about 1200°C – must be much shallower on Venus. On Earth that is at depths between 50 and 100 km below active plate margins and within-plate hotspots, and is not reached at all for most of the Earth that lies beneath the tectonic plates. If the mantle of Venus contained a similar complement of heat-producing isotopes to that of Earth wouldn’t we expect continual volcanism on Venus rather than the odd dribble that has been observed by Magellan? Or does the jostling of ‘campuses’ absorb the thermal energy and help direct it slowly to space by radiation through the dense, greenhouse atmosphere. Here’s another poser: If the Earth and Venus are geochemically similar and Hadean Earth went through such a phase of ‘campus tectonics’ – perhaps our world had a CO2-rich atmosphere too – what changed to allow plate tectonics here to replace that system of thermal balance? And, why hasn’t that happened on Venus? Perhaps some light will be thrown on these enigmas once a series of new missions to Venus are launched between now and the 2030s, by NASA and the European Space Agency.
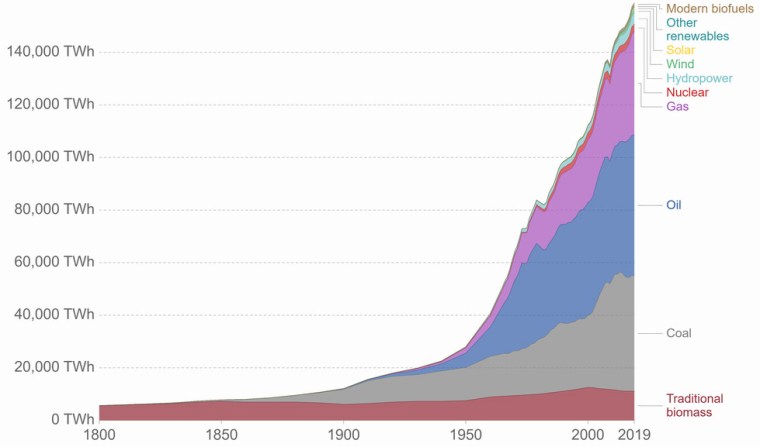
Burning coal is far and away the main culprit for elevated atmospheric CO2 and global climatic warming. That is a consequence of the Industrial Revolution and a mode of production that centres on the market value of commodities rather than their intrinsic usefulness and thus on the continual generation of profit. As the main original energy source for this capitalist mode, whose viability depends on incessant economic growth, world coal production grew at an exponential rate through the 19th and 20th centuries, as did its influence on global climate. Beginning in the 1920s, coal was joined by other carbon-based fossil fuels (oil and natural gas) in massively increasing energy and greenhouse-gas production. In the data there is little sign of an appetite to reduce this dependence on carbon burning, renewable energy output accounting today for only a few percent of the energy demands of capital. Although coal’s energy contribution is flattening off to be replaced by those of oil and gas, in terms of CO2 emissions it still dominates. That is because oil and gas are carbon-hydrogen compounds rather than almost pure carbon in the case of coal. Unless burning fossil fuels is outlawed and economic growth is drastically curtailed, we are set to live on a far warmer planet.
Growth in energy supply from different sources since 1800 CE (Credit: ourworldindata.org)
For various reasons coal is unique in a social sense. Every producing area has large communities who depend on mining for income. Britain now produces vastly less coal than it did up to the 1990s, with wholesale closure of underground mines. Since 1960 these communities have lost over half a million jobs in mining, let alone those in related industries and those that served mining communities. Three decades on from the last round of closures, those communities remain socially devastated in many respects. A huge amount of coal still lies beneath them. Can it make a come-back? A recent study suggests that perhaps it can, with diametrically opposite environmental consequences.
It seems that surfaces of coal particles are able to take-up and store gases, increasingly so as pressure increases. Miners faced the consequences of that in the form of adsorbed carbon dioxide and methane (‘choke damp’ and ‘fire damp’) that were released when coal was mined underground. Miners’ safety lamps (invented in 1815 by Humphry Davy) enable them to monitor the risks of suffocation by CO2 or explosion of CH4 when the lamps dim or flare, respectively. Engineers at Edith Cowan University in Perth, Western Australia, experimentally measured the amounts of hydrogen adsorbed by crushed coal at different pressures (Iglauer, S et al. 2021. Hydrogen adsorption on sub-bituminous coal: Implications for hydrogen geostorage. Geophysical Research Letters, v. 48, article 2021GL092976; DOI: 10.1029/2021GL092976). From surface atmospheric pressure to 40 times that, adsorption increases rapidly, especially for hydrogen (from 0.05 to 0.25 grams per kilogram). At higher pressures it rises less rapidly to about 0.6 g kg-1 at 100 times atmospheric pressure, which is equivalent to a depth of about 500 m in a sedimentary rock formation. At deeper levels hydrogen adsorption remains about the same.
The experimental results suggest that large amounts of hydrogen can be stored in coal at quite shallow depths. The potential storage in a ton of fractured coal is about 600 kg, equivalent to about 12 cubic metres of liquid hydrogen, but without the need for containment and refrigeration. In the absence of oxygen, such storage would be safe and long-term. If feasible from an engineering standpoint, underground storage of hydrogen in coal seams to overcome one of the current barriers to a hydrogen-based industrial economy through the storage of energy generated by carbon-free technologies, such as wind, wave, tidal and solar generation that operate at highly variable rates, not suited to energy use patterns. Effectively, coalfields could become giant ‘batteries’ without the need to mine vast amounts of elements, such as lithium, needed for conventional batteries; provided that a sustainable means of repeated hydrogen recovery can be devised. A central technology of a future ‘hydrogen economy’ is that of the fuel cell in which hydrogen and oxygen combine using a catalyst to generate electricity, without any combustion and emitting only water vapour.
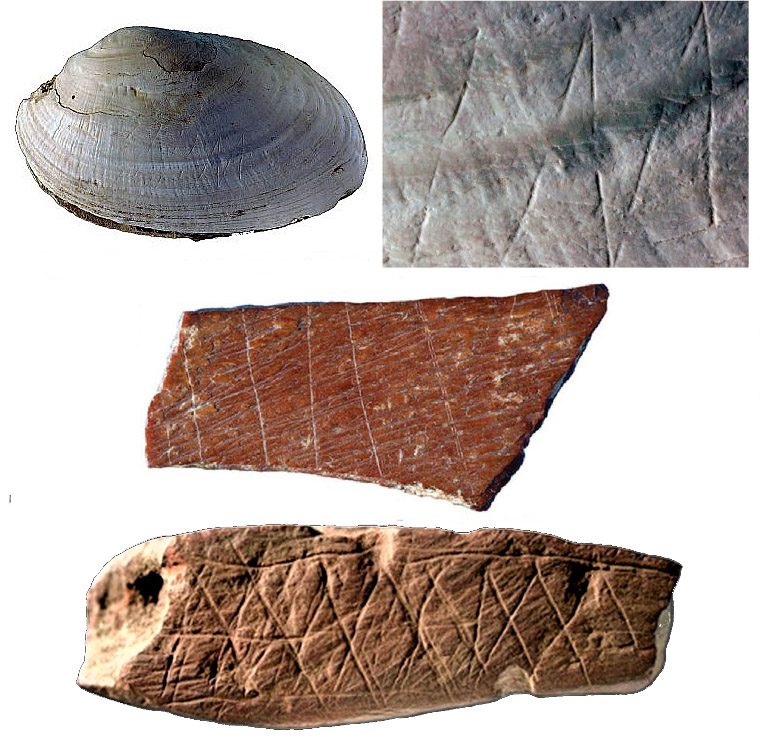
Three earlier articles in Earth-logs originally focussed on what I supposed to be ‘ancient abstract art’. One highlighted a clam shell that bears carefully etched V-shapes found at the type locality for Asian Homo erectus at Trinil on the Solo River, Java, dated between 430 and 540 ka. Another is about parallel lines etched on a piece of defleshed bone from China dated at 78 to 123 ka, which may be a Denisovan artefact. The most complex is a piece of ochre found in the coastal Blombos Cave 300 km east of Cape Town, South Africa in association with tools ascribed to early modern humans who lived there about 73 ka ago. Fascinating as they seemed at the time, they may hold much greater significance about early-human cognitive powers than about mere decoration. That is thanks to recent evaluation of other simple artefacts made of lines and notches by anthropologists, cognitive scientists and psychologists. Their work is summarised in a recent Nature Feature by Colin Barras (Barras, C. 2021. How did Neanderthals and other ancient humans learn to count?Nature, v. 594, p. 22-25; DOI: 10.1038/d41586-021-01429-6). The European Research Council recently allocated a €10 million grant to foster research into ‘when, why and how number systems appeared and spread’.
Examples of ancient ‘abstract’ art. Top – V-shaped features inscribed on 430-540 ka freshwater clam from Java; Middle – parallel lines etched through red ochre to show white bone, from a possible Denisovan site in China; Bottom – complex inscription on a tablet of iron-rich silcrete from South Africa
Straight lines and patterns made from them are definitely deliberate, whatever their antiquity. In recent times, such devices have been used by artists to render mental images, moods and thoughts as simplified abstractions: hence ‘abstract’ art, such as that of Piet Mondrian and Kazimir Malevich. The term also applies to the dribbles and drabbles of Jackson Pollock and many more styles. But these works are a very recent evolutionary development out of earlier schools of art. So deliberate geometric shapes and arrangements of lines that are many millennia old cannot simply be termed ‘abstract art’. It is certainly not easy to see how they evolved into the magnificence of Palaeolithic figurative cave art that started at least 40 thousand years ago; Yet they are not ‘doodles’. Being so deliberate suggests that they represented something to their makers. The question is, ‘What?’
The research summarised by Barras is mainly that of Francisco d’Errico of The University of Bordeaux, France and colleagues from Canada and Italy (d’Errico, F. et al. 2018. From number sense to number symbols. An archaeological perspective. Philosophical Transactions of the Royal Society B, v. 373, article 2160518; DOI: 10.1098/rstb.2016.0518). They focused their work on two remarkable artefacts. The oldest (72 to 60 ka), from a cave near Angoulême in France, is a fragment of a hyena’s thigh bone that carries nine notches. It is associated with stone tools almost certainly made by Neandethals. The other, from the Border Cave rock shelter in KwaZulu-Natal in South Africa, is a 44 to 42 ka old baboon’s shin bone, which carries a row of 29 prominent notches, and a number of less distinct, roughly parallel scratches. The rock shelter contains remains of anatomically modern humans and a very diverse set of other artefacts that closely resemble some used by modern San people.
Top: notched hyena femur bone fragment associated with Neanderthal tools from SW France. Bottom: notched baboon shin bone from Border Cave, South Africa. Scale bars(Credit: F. d’Errica and L. Backwell)
Microscopic examination of the notches made by a Neanderthal suggest that all 9 notches were cut at the same time, using the same stone blade. Those on the Border Cave shin bone suggest that they were made using four distinctly different tools on four separate occasions. Are both objects analogous to tally sticks; i.e. to count or keep a record of things as an extension to memory? There are other known examples, such as a 30 ka-old wolf’s radial bone from the Czech Republic having notches in groups of five, suggesting a record of counting on fingers. Yet very similar devices, made in recent times by the original people of Australia, were not used for keeping count, but to help travellers commit a verbal message to memory enabling them to recount it later.
Do read Barras’s summary and the original paper by d’Errico et al. to get an expanded notion of the arguments being debated. They emerge from the truly novel idea that just because the makers of such objects lived tens or even hundreds of thousands of years ago that doesn’t make them intellectually lacking. Imagining in the manner of Victorian scientists that ancient beings such as Neanderthals and H. erectus must have been pretty dim is akin to the prejudice of European colonialists that people of colour or with non-European cultures were somehow inferior, even non-human. To me it is admirable that the European Research Council has generously funded further research in this field at a time when research funding in the UK, especially for the disciplines involved, has been decimated by those who demanded an exit from the EU.
The older Trinil and Blombos patterns appear yet more sophisticated. The pattern on the latter looks very like the kind of thing that someone in a prison cell might draw to keep track of time. It also incorporates the zig-zag element engraved on the Trinil clam shell. Remember that the word ‘Exchequer’ is derived from a tax audit during the reign of Henry I of England that was conducted on a counting board whose surface had a checked pattern
The Bagger 288 bucket wheel reclaimer moves from one lignite mine to another in Germany: an apt expression of modern times
Followers of Earth-logs and its predecessor, should be familiar with the concept of ‘The Anthropocene’. More recent readers can hardly have escaped it, for it has become a recurrent motif that extends far beyond science to the media, the social sciences and even the arts. Some circles among the ‘chattering classes’ speak of little else. It has become a trope – a word with figurative or metaphorical meaning. In 2000, atmospheric chemist and Nobel Laureate Paul Crutzen suggested that the increasingly clear evidence that human society is having growing impacts on the Earth system should be recognised by a new stratigraphic Epoch. Some Fellows of the Geological Society of London launched an attempt to formalise the suggestion through the society’s Stratigraphic Commission (Zalasiewicz, J. and 20 others 2008. Are we now living in the Anthropocene?GSAToday, v.18(ii), p. 4-8; DOI: 10.1130/GSAT01802A.1). In 2009 Jan Zalasiewicz of the University of Leicester became the first chair of the Anthropocene Working Group (AWG) within the International Commission on Stratigraphy (ICS). A dozen years on, stratigraphers continue to debate the Anthropocene (See: Brazil, R. 2021. Marking the Anthropocene. Chemistry World, 29 January 2021). One of the problems facing its supporters is the lack of agreement about what it is and when it started.
Since 1977 the ICS has been searching for localities, known as Global Boundary Stratotype Sections and Points, or GSSPs, that mark the actual beginning of each basic division of the geological record: Eons, Eras, Periods, Epochs and Ages. So far, those for Epochs and longer divisions have been agreed and GSSP markers have been cemented in place, sometimes with quite large monuments, if not actual golden spikes. Those for the shortest timespans – Ages – are proving more difficult to agree on. These GSSPs have to have global significance, yet the very nature of stratigraphy means that a fair number of the most brief rock sequences revealed by field work either formed at different times across the globe, or there is no incontrovertible dating method to record their beginning and end.
Currently, we live in the Holocene Epoch whose beginning marked the global climate system’s exit from the frigid Younger Dryas at 11.7 ka ago. The Holocene (‘entirely recent’) Epoch marks the latest interglacial. When it began every human being was Homo sapiens, made a living as a hunter-gatherer and eventually expanded into every ecosystem that offered sustenance on all continents bar Antarctica. Within a few thousand years some began sedentary life as farmers and herders after their domestication of a range of plant and animal species. A few millennia later agriculture had a growing foothold everywhere except in Australia. Natural tree cover began to be cleared and organised grazing steadily changed other kinds of ecosystem. Human influences, other than scattered artefacts and bones, became detectable in geological formations such as lake-bed sediments and peat mires. The geological record of the Holocene is by no means consistent globally, there being lots of gaps. That is partly because sedimentary systems continually deposited, eroded and transported sediments on the landmasses. In the tropics and much of the Southern Hemisphere the Younger Dryas is, in any case, barely recognisable in post-Ice Age deposits, so the start of the Holocene there is vague. Things are simpler on the deep sea floor, as muds accumulate with no interruption. But it was only when data became available from drill cores through continental ice masses on Antarctica, Greenland and scattered high mountains that any detailed sense of changes and their pace emerged. The major climatic perturbation of the Younger Dryas and its end only became clear from the undisturbed annual layering in Greenland ice cores. It proved to have been extremely fast: a couple of decades at most. The GSSP for the start of the Holocene therefore lies in a single Greenland ice core preserved by cold storage in Copenhagen. It is a somewhat ephemeral record.
Leaving aside for the moment that the Anthropocene adds the future to the geological record, when was it supposed to start? Its name demands that it be linked to some human act that began to change the world. That is implicit in the beginning of agriculture which held out the prospect of continuous growth in human populations by securing food resources rather than having to seek them. But such an event is not so good from the standpoint of purist stratigraphy as it happened at different times at different places and probably for different reasons (See: Mithen, S. 2004. After the Ice: A Global Human History, 20,000 – 5000 BC. Weidenfeld and Nicolson, London; ISBN-13: 978-0753813928 [A superb read]). A case has been made for the European conquest and colonisation of the Americas which was eventually followed by the death from European diseases of tens of millions of native people, many of whom were farmers in the Amazon basin. The Greenland ice records a decline in atmospheric CO2 between 1570 to 1620 CE, which has been ascribed to massive regrowth of previously cleared tropical rainforest. That would define a start for the Anthropocene at around 1610 CE. Yet the main driver for erecting an Anthropocene Epoch is global warming, which has grown exponentially with the burning of fossil fuels and CO2 emissions since the ill-defined start of the Industrial Revolution (late 18th – early 19th century). It looks like in a year or so the ICS is due to debate a much later start at the peak of nuclear weapon fallout in 1964, which its champions claim to coincide with the ‘Great Acceleration’ in world economic growth, emissions and warming.
If that is accepted, anyone still alive who was born before 1964 is a relic of the Holocene, as Philip Gibbard secretary-general of ICS wryly observed, whereas our children and grandchildren will be wholly of the Anthropocene. We Holocene relics only grasped the change at the start of the 21st century! The very nature of exponential growth is that its tangible effects always come as a surprise. The build-up of human influence on the world has been proceeding stealthily since not long after the Holocene began. Annoyingly, the very name Anthropocene lays the blame on the whole of humanity. In reality it is an outcome of a mode of economy that demands continual exponential growth. That mode – the World Economy – lies completely beyond the reach of social and political control. It is effectively inhuman. So, why the pessimism – can’t human beings get rid of an ethos that is obviously alien to their interests? Perhaps ‘Anthropocene’ might be an apt name for the aftermath of such a reckoning, which may last long enough to be properly regarded as an Epoch …
A glance at statistics for the global consumption of any particular metal reveals much about the current unfairness of the world we live in. On a per capita basis, people in the developed, rich world use vastly more than do those in the less developed countries, on average. It is commonly said that in order for everyone to live in a fair world, the poor need more metals and other physical resources in order to match the living standards of the rich, or the wealthy will need to consume much less. A new factor in the equitability equation is the necessity to stave off CO2-induced global warming, largely through replacing energy from fossil fuels with that produced by a variety of ‘green’ sources. That carries with it another issue; the technologies for carbon-free energy generation, transmission, storage and use will consume a broad range of metals and other physical resources. These include cobalt and lithium, graphite, rare-earth elements and especially copper, whose annual production is set to soar.
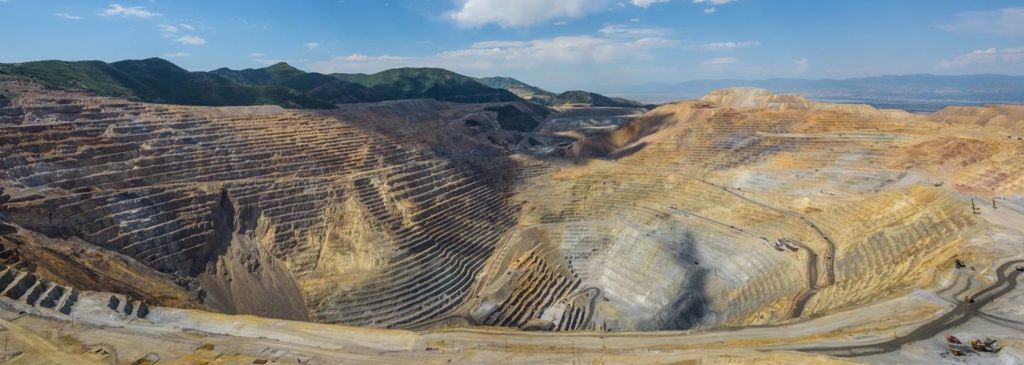
Copper is particularly critical. If China alone fulfils its planned production of all-electric transportation, the demand for copper will over 2 billion tonnes requiring 119 years production at the current extraction rate of 20 Mt per year. The rush to electric cars has already forced copper demand above production, resulting in soaring prices on the world market. In the last year they have doubled, reaching US$10,000 per ton at the time ofwriting. Most metals are won by digging up their ores, often from considerable depths in the crust. Ores then have to be concentrated, smelted and the elemental metals refined. About 6 % of global energy is consumed by this process, adding CO2 and a variety of noxious gases to the atmosphere, let alone the stupendous amounts of uneconomic waste rock and polluted water. Copper is high up the list for environmental impact, being extracted from some of the world biggest mines. Like all physical resources, its extraction cannot be continued without further environmental deterioration. But is there a more sustainable way of extracting metals from the Earth?
Bingham Canyon copper mine in Utah, USA; at 4.5 km diameter and 1.2 km depth it is the world’s largest excavation. (Credit: Mining Magazine)
Under the right chemical conditions many metals can be dissolved, so longs as fluids can pass through the ore. One example is the use of sodium cyanide solution (known as a lixiviant) to dissolve gold from low-grade ore: so-called ‘heap leaching’. But this is done at the surface, either using newly crushed ore from an excavation or waste from earlier mining that could not extract fine-grained gold. A similar approach uses bacteria whose metabolism involves oxidation of sulfide ore minerals, resulting in chemical reactions that liberate their desirable metal content to solution in water. If buried orebodies are fractured in situ this kind of leaching will supposedly transform metal production, in an analogous fashion to fracking for gas and oil. Like fracking, current operations that involve both forms of hydrometallurgy generate highly toxic fluids, and in many cases extract only a fraction of the target metal. But a novel alternative has just emerged, which involves leaching based on electrical means (Martens, E. and 9 others 2021. Toward a more sustainable mining future with electrokinetic in situ leaching. Science Advances, v. 7, article eabf9971; DOI: 10.1126/sciadv.abf9971). It isn’t totally new, for it uses the same chemistry as in heap leaching. However, it does not involve shattering the orebody at depth. Instead, low-voltage currents are passed through the orebody which induce a lixiviant to migrate through the rock, along mineral-grain boundaries rather than through fractures. Fluid movement becomes more efficient over time as the host rock is artificially ‘weathered’ thereby making it permeable. In effect, electrokinetic leaching creates a kind of hydrothermal system in reverse, by replacing the chemically reducing conditions of ore deposition with oxidising dissolution and transportation.
So far, the method has only been demonstrated through a small-scale test of concept using drill core samples of ore from a copper mine. Tests over a few days consumed more than half the grains of a copper ore mineral (chalcopyrite) present in the ore sample. So, it seems to work and astonishingly rapidly too. No doubt metal-mining companies, who are currently coining it hand-over-fist during a boom in metal prices, will beat a path to the doors of the team of researchers. But is it an economic proposition? They authors will soon find out … More important, if it is deployed widely will it increase the sustainability of metal mining? At first glance, yes: by removing the need for excavation of ore, liberation of ore-mineral grains by milling and their separation from valueless waste and many other aspects of beneficiation at the surface. Yet, the bottom line is that mining companies deploy their capital not so much to make ingots of useful metal but primarily to yield profits. Speeding up metal extraction and thereby its supply to the world market could drive down the price that they can get for each tonne. Perversely, it is perceived shortages on metals and the resulting inflation of price that really yield bonanzas. My guess is that the industry will continue mining in the present manner, with all its lack of sustainability and environmental impact, for that very reason. The real way to reduce damage is to reduce demand for metals: do people in general really need more of them and the goods in which they are bound up in such vast amounts?
Earth-pages asked this question in August 2020 because it had been suggested that at least one mass extinction – the protracted faunal decline during the Late Devonian – may provide evidence that supernovas can have deadly influence. The authors of the paper that I discussed proposed mass spectrometric analysis of isotopes, such as 146Sm, 235U and 244Pu in sediments deposited in an extinction event to test the hypothesis. In the 14 May issue of Science a multinational group of geochemists and physicists, led by Anton Wallner of the Australian National University, report detection of alien isotopes in roughly 10 million-year-old sediments sampled from the Pacific Ocean floor (Wallner, A and 12 others 2021. 60Fe and 244Pu deposited on Earth constrain the r-process yields of recent nearby supernovae. Science, v. 372, p. 742-745; DOI: 10.1126/science.aax3972).
Many of the chemical elements whose atomic masses are greater than 56 form by a thermonuclear fusion process known as rapid neutron capture – termed the ‘r-process’ by physicists. This requires such high energy that the likely heavy-element ‘nurseries must be events such as supernovas and/or mergers of neutron stars. The iron and plutonium isotopes detected at very low concentrations are radioactive, with half-lives of 2.6 Ma for 60Fe and 80.6 Ma for 244Pu. That makes it impossible for them to be terrestrial in origin because, over the lifetime of the Earth, they would decayed away completely. They must be from recent, alien sources either in our galaxy or one of the nearby galaxies. In fact two ‘doses’ were involved. The authors make no comment on any relationship with marine or continental extinctions at that time in the Miocene Epoch
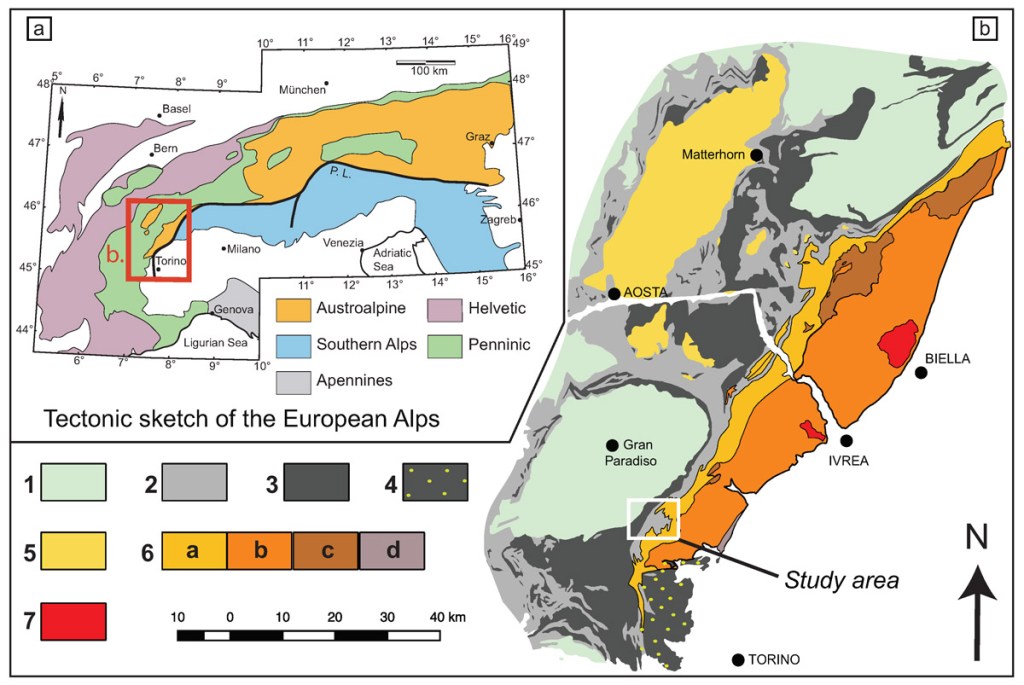
Geological map of part of the Italian Alps. The Sesia-Lanzo Zone is 6 in the Key: a – highly deformed gneisses; b – metasedimentary schists with granite intrusions; c – mafic rocks; d – mixed mantle and crystalline basement rocks. (Credit: M. Assanelli, Universita degli Studi di Milano)
To a first approximation, as they say, the basis of plate tectonics is that the lithosphere is divided up into discrete, rigid plates that are bounded by lines of divergent, convergent and sideways relative motions: constructive, destructive and conservative plate margins. These are characterised by zones of earthquakes whose senses of motion roughly correspond to the nature of each boundary: normal, reverse and strike-slip, respectively. The seismicity is mainly confined to the lithosphere in the cases of constructive and conservative boundaries (i.e. shallow) but extends as deep as 700 km into the mantle at destructive margins, thereby defining the subduction of lithosphere that remains cool enough to retain its rigidity. Although the definition assumes that there is no deformation within plates, in practice that does occur for a wide variety of reasons in the form of intra-plate seismicity, mainly within continental lithosphere. Oceanic plate interiors are much stronger and largely ‘follow the rules’; they are generally seismically quiet.
One important feature of plate tectonics is the creation of new subduction zones when an earlier one eventually ceases to function. Where these form in an oceanic setting volcanism in the overriding plate creates island arcs. They create precursors of new continental crust because the density of magmas forming the new lithosphere confers sufficient buoyancy for them to be more difficult to subduct. Eventually island arcs become accreted onto continental margins through subduction of the intervening oceanic lithosphere. Joining them in such ‘docking’ are microcontinents, small fragments spalled from much older continents because of the formation of new constructive plate margins within them. It might seem that arcs and microcontinents behave like passive rafts to form the complex assemblages of terranes that characterise continental mountain belts, such as those of western North America, the Himalaya and the Alps. Yet evidence has emerged that such docking is much more complicated (Gün, E. et al. 2021.Pre-collisional extension of microcontinental terranes by a subduction pulley. Nature Geoscience, v. 14, online publication; DOI: 10.1038/s41561-021-00746-9).
Erkan Gün and colleagues from the University of Toronto and Istanbul Technical University examined one of the terranes in the Italian Alps – the Sesia-Lanzo Zone (SLZ) – thought to have been a late-Carboniferous microcontinental fragment in the ocean that once separated Africa from Europe. When it accreted the SLZ was forced downwards to depths of up to 70 km and then popped up in the latter stages of the Alpine orogeny. It is now a high-pressure, low-temperature metamorphic complex, having reached eclogite facies during its evolution. Yet its original components, including granites that contain the high-pressure mineral jadeite instead of feldspar, are still recognisable. Decades of geological mapping have revealed that the SLZ sequence shows signs of large-scale extensional tectonics. Clearly that cannot have occurred after its incorporation into southern Europe, and must therefore have taken place prior to its docking. Similar features are present within the accreted microcontinental and island-arc terranes of Eastern Anatolia in Turkey. In fact, most large orogenic belts comprise hosts of accreted terranes that have been amalgamated into older continents.
An ‘engineering’ simplification of the subduction pulley. Different elements represent slab weight (slab pull force) transmitted through a pulley at the trench to a weak microcontinent and a strong oceanic lithosphere. (Credit: Gün et al., Fig. 4)
Lithospheric extension associated with convergent plate margins has been deduced widely in the form of back-arc basins. But these form in the plate being underidden by a subduction zone. Extension of the SLZ, however, must have taken place in the plate destined to be subducted. Gün et al. modelled the forces, lithospheric structure, deformation and tectonic consequences that may have operated to form the SLZ, for a variety of microcontinent sizes. The pull exerted by the subduction of oceanic lithosphere (slab pull) would exert extensional forces on the lithosphere as it approached the destructive plate boundary. Oceanic lithosphere is very strong and would remain intact, simply transmitting slab-pull force to the weaker continental lithosphere, which ultimately would be extended. This is what the authors call a subduction ‘pulley’ system. At some stage the microcontinent fails mechanically, part of it being detached to continue with the now broken slab down the subduction zone. The rest would become a terrane accreted to the overriding plate. Subduction at this site would stop because the linkage to the plate has broken. It may continue by being transferred to a new destructive margin ‘behind’ the accreted microcontinent. This would allow other weak continental and island-arc ‘passengers’ further out on the oceanic plate eventually to undergo much the same process.
The observed complexity of tectonic terranes in other vast assemblies of them, such as the northern Pacific coast of North America and in many more ancient orogenic belts, is probably as much a result of extension before accretion as the compressional deformation suffered afterwards. The theoretical work by Erkan Gün and colleagues will surely spur tectonicians to re-evaluate earlier models of orogenesis.
Note: Figure 2 in the paper by Gün et al. shows how the width (perpendicular to the subduction zone) affects the outcomes of the subduction pulley. View an animation of a subduction pulley
Enter a room, even for a few minutes, and dead skin cells will follow you like an invisible cloud to settle on exposed surfaces. Live there and a greyish white, fluffy dust builds up in every room. Even the most obsessive cleaning will not remove it, especially under a bed or on the bathroom floor. Consider a cave as a home, but one without vacuum cleaners, any kind of sanitation, paper tissues, panty liners, nappies or wet wipes. For pre-modern human dwellings can be added snot, fecal matter, sweat, urine, menstrual blood and semen among all the other detritus of living. A modern crime-scene investigator would be overwhelmed by the sheer abundance of DNA from the host of people who had once dwelt there. CSI works today as much because most homes are pretty clean and most people are fastidious about personal hygene as because of the rapidly shrinking lower limit of DNA detection of the tools at its disposal. Except, that is, when someone from outside the home commits a criminal offence: burglary, GBH, rape, murder. We have all eagerly watched ‘police operas’ and in the absence of other evidence the forensic team generally gets its perpetrator, unless they did the deed wearing a hazmat suit, mask, bootees and latex gloves.
Artistic impression of Neanderthal extended-family life in a cave (credit: Tyler B. Tretsven)
Since 2015 analysis of environmental DNA from soils has begun to revolutionise the analysis of ancient ecosystems, including the living spaces of ancient humans (see: Detecting the presence of hominins in ancient soil samples, April 2017). It is no longer necessary to find tools or skeletal remains of humans to detect their former presence and work out their ancestry. DNA sequencing of soil samples, formerly discarded from archaeological sites, can now detect former human presence in a particular layer, as well as that of other animals. In many cases the ‘signal’ pervades the layer rather than occurring in a particular spot, as expected from shed skin cells and bodily fluids. The first results were promising but only revealed mitochondrial DNA. Now the technique has extended to nuclear DNA: the genome (Vernot, B. and 33 others 2021. Unearthing Neanderthal population history using nuclear and mitochondrial DNA from cave sediments. Science, v. 372, article eabf1667; DOI: 10.1126/science.abf1667). Benjamin Vernot and colleagues from 7 countries collected and analysed cave soils from three promising sites with tangible signs of ancient human occupation. Two of them were in Siberia and had previously yielded Neanderthal and Denisovan genomes from bones. The other is part of the Atapuerca cave complex of NW Spain that had not. The Russian caves yielded DNA from more than 60 samples, 30 being nuclear DNA consistent with that from actual Neanderthal and Denisovan bones found in the caves. Galería de las Estatuas cave in Spain presented a soil profile spanning about 40 thousand years from 112 to 70 ka.
Teasing-out nuclear DNA from soil is complicated, from both technical and theoretical standpoints. So being able to match genomes from soil and bone samples in the Russian caves validated the methodology. The Spanish samples could then be treated with confidence. Galería de las Estatuas revealed the presence of Neanderthals throughout its 40 ka soil profile, but also a surprise. The older DNA was sufficiently distinct from that from later levels to suggest that two different populations had used the cave as a home, the original occupants being replaced by another genetically different group around 100 to 115 ka ago. The earlier affinity was with the ancestors of sequenced Neanderthal remains from Belgium, the later with those from Croatia. That time is at the end of the last (Eemian) interglacial episode, so one possibility is a population change driven by climatic deterioration. This success is sure to encourage other re-examinations of caves all over the place. That is, if there is the analyical capacity to perform such painstaking work in greater volume and at greater pace. Like many other palaeo-genomic studies, this one has relied heavily on the analytical facilities pioneered and developed by Svante Paäbo at the Max Planck Institute for Evolutionary Anthropology in Leipzig, Germany. Covid has forced genetics to the front page for a year and more. And it has led to many advances in anlytical techniques, particularly in their speed. It would nice to think that a dreadful experience may end-up with positive benefits for understanding the full history of humanity.
Beinn Alligin and Loch Torridon, Northwest Highlands of Scotland. The hills are formed by Torridonian terrestrial sediments (credit: Stefan Krause, Wikimedia Commons)
Palaeobiologists interested in the origin of animals have generally focussed on sedimentary rocks from southern China: specifically those of the 635 to 550 Ma Doushantuo Formation. Phosphorus-rich nodules in those marine sediments have yielded tiny spheroids whose structure suggests that they are fossil embryos of some unspecified eukaryote. The Doushantuo Formation lies on top of rocks associated with the Marinoan episode of global glaciation during the Neoproterozoic; a feature which suggested that the evolutionary leap from single- to multi-celled eukaryotes was associated with environmental changes associated with Snowball Earth events. In a forthcoming issue of Current Biology that view will be challenged and the origin of multicellular life pushed back to around 1 billion years ago (Strother, P.K. et al. 2021. A possible billion-year-old holozoan with differentiated multicellularity. Current Biology, v. 31, p. 1-8; DOI: 10.1016/j.cub.2021.03.051). Spherical fossils of that age have been teased out of phosphatic nodules deposited in lacustrine sediments from the lower part of the Mesoproterozoic Torridonian Group of the Northwest Highlands of Scotland.
The internal structure of the fossils has been preserved in exquisite detail. Not only are cells packed together in their interiors, but some reveal an outer layer of larger sausage-shaped cells. So, cell differentiation had taken place in the original organisms, whereas such features are not visible in the Doushantuo ‘embryos’. A few of the central cells show dark, organic spots that may be remains of theirnucleii. Whatever these multicellular spheres may have developed into, the morphology of the Torridonian fossils is consistent with a transition from single-celled holozoans to the dominant metazoans of the Phanerozoic; i.e. the stem of later animals. The younger, Chinese fossils that are reputed to be embryos cannot be distinguished from multicellular algae (see: Excitement over early animals dampened, January 2012)
Photomicrograph of Bicellum brazieiri: scale bar = 10μm; arrows point to dark spots that may be cell nuclei (credit: Charles Wellman, Sheffield University)
Interestingly, the Torridonian Group is exclusively terrestrial in origin, being dominated by sediments deposited in the alluvial plains of huge braided streams that eventually buried a rugged landscape eroded from Archaean high-grade metamorphic rocks. Thus the environment would have been continually in contact with the atmosphere and thus oxygen that is vital for eukaryote life forms. The age of the fossils also rings a bell: a molecular clock based on the genomics of all groups of animals alive today hints at around 900-1000 Ma for the emergence of the basic body plan. Because its host rocks are about that age, could Bicellum brazier be the Common Ancestor of all modern animals? That would be a nice tribute to the second author, Martin Brazier (deceased) of Oxford University, who sought signs of the most ancient life for much of his career.
One iconic feature of Rio de Janeiro is Corcovado Mountain, topped by the huge Cristo Redentor (Christ the Redeemer) statue. Another is the Sugar Loaf (Pão de Açúcar) that broods over Botafogo Bay. Each is an inselberg: a loan word from the German for ‘island mountain’. Elsewhere they are known as kopjes (southern Africa), monadnocks (North America) or bornhardts after the German explorer who first described them. But, being on the coast, the Brazilian examples are not typical. Most rise up spectacularly from almost featureless plains, a well-known case being Uluru (Ayers Rock) almost at the centre of Australia. Arid and semi-arid plains of Africa and the Indian subcontinent are liberally dotted with them. So scenically dominant and spectacularly stark, inselbergs are often revered by local people, and have been so for millennia. The only thing that I remember from a desperately boring, but compulsory, first-year course on geomorphology in 1965 is their connection with the ‘cosmogonic egg’: a mythological motif that spans Eurasia, Australia and Africa, signifying that from which the universe hatched. It is perhaps no coincidence that hills in England that suddenly rise from flat land, such as the Wrekin in Shropshire and Malvern Hill in Worcestershire, still host the sport of rolling hard-boiled eggs to celebrate the pagan festival of Eostre (now Easter) that marks the spring rebirth of the land.
Vista of Rio de Janeiro and its inselbergs (Credit: Leonardo Ferreira Mendes, Creative Commons)
How inselbergs and their surrounding plains formed has long been a hot topic in tropical geomorphology. One theory is that they are especially resistant rocks around which eroding rivers meandered during the formation of peneplains, a variant being that they were surrounded by lines of weakness, such as faults or major joint systems. Another is that they formed by erosion into a deeply but irregularly weathered surface. Then there is L.C. Kings theory of escarpment retreat and, of course, a mixture of processes in different stages, or a unique origin for each inselberg. In effect, there has been no final, widely agreed explanation. But that that may be about to change.
A common element to most inselbergs is their very steep and sometimes vertical flanks. Some even display overhangs at their base. Such potential shelters encouraged local people to camp there and, in response to the awe inspired by the sheer majesty of the looming inselberg, to use them for sacred rites and decoration. That is especially true of Australia, so it is fitting that what may be a breakthrough in understanding inselberg formation should have arisen there. (Buckman, S. et al. 2021. Fire-induced rock spalling as a mechanism of weathering responsible for flared slope and inselberg development. Nature Communications, v.12,article2150; DOI: 10.1038/s41467-021-22451-2). Breaking rock by deliberate use of fire has been done for millennia. For instance, Hannibal is said to have used fire to break down huge fallen boulders that blocked passage for his war elephants as his army advanced on Rome. Fire setting is still used by villagers in South India to spall large flakes of rock from outcrops. It is done with such skill that thin slabs up to 3-4 metres across can be lifted, and then split into thin posts for fencing or training vines: an essential alternative to wooden posts that termites would otherwise devour in a matter of months.
Solomon Buckman and colleagues from the University of Wollongong, Australia were drawn to a new hypothesis for inselberg formation by observations around low rock faces and boulders after the 2019-20 “Black Summer” wildfires in eastern Australia. Where burned trees had fallen against rock faces up to hundreds of kg of spalled flakes lay at the base of each face, which also bore freshly formed scars: clear signs of fire action. Thermal expansion and contraction of rock caused by air temperatures of hundreds of degrees close to wildfires is clearly a powerful means of rapid erosion. If the rock is damp – most likely at the base of a rockface as all rainfall on the outcrop drains in its direction – the mechanism is enhanced: Hannibal’s engineers poured vinegar onto the boulders heated by fire, to great effect. Buckman et al. estimate the rate of lateral erosion by fire at slope bases in Australia to be around ten thousand times faster than those operating on horizontal rock surfaces, which are not exposed to fire as no vegetation grows on them. Over time, slopes steepen aided by the formation of flared surfaces at the base. If spalled debris is carried away quickly the developing inselberg evolves to its classical sugarloaf shape. In more arid conditions the debris builds around the outcrop to steadily smother inselberg development, leaving tors and kopjes. The paper came to press remarkably quickly relative to the authors’ field work and analyses. This is a work-in-progress to be followed up by cosmogenic-isotope and other means of surface dating of the tops and flanks of suitably accessible inselbergs and simiar features such as Western Australia’s famous Wave Rock (a flared escarpment).
Wave Rock in the interior of Western Australia is 15 m high and 100 m long and revered by the local Ballardong people as a creation of the Rainbow Serpent
The shifting position of the Tropic of Cancer in Mexico due to nutation from 2005 to 2010 (Credit: Roberto González, Wikimedia Commons)
First suggested by Isaac Newton and confirmed from observations by Seth Chandler in 1891, the Earth’s axis of rotation and thus its geographic poles wander in much the same manner as does the axis of a gyroscope, through a process known as nutation. The best-known movement of the poles – Chandler wobble – results in a change of about 9 metres in the poles’ positions every 433 days, which describes a rough circle around the mean position of each pole. Every 18.6 years the orbital behaviour of the Moon results in a substantially larger shift, illustrated by a shift in the position of the circles of latitude, as above. Essentially, nutation results from the combined effects of gravitational forces imposed by other bodies. The axial precession cycle of 26 thousand years that is part of the Milankovich effect on long-term climate forcing is a result of nutation. But the Earth’s own gravitational field changes too, as mass within and upon it shifts from place to place. So mantle convection and plate tectonics inevitably change Earth’s mode of rotation, as do changes in the Earth’s molten iron core.
The most sensitive instrument devoted to measuring changes in Earth’s gravity is the tandem of two satellites known as the Gravity Recovery and Climate Experiment or GRACE. Among much else, GRACE has revealed the rate of withdrawal of groundwater from aquifers in Northern India and areas of mass deficit over the Canadian Shield that resulted from melting of its vast ice sheet since 18 ka ago (see: Ice age mass deficit over Canada deduced from gravity data, July 2007). Further GRACE data have now confirmed that more recent melting of polar glaciers due to global warming underlie an unusual reversal and acceleration of polar wandering since the 1990s (Deng, S. et al. 2021. Polar drift in the 1990s explained by terrestrial water storage changes. Geophysical ResearchLetters, v. 48, online article e2020GL092114; DOI: 10.1029/2020GL092114). In 1995 polar drift changed from southwards to eastwards, and increased by 17 times from its mean speed from 1981 to 1995. That tallies with an increase in the flow of glacial meltwater from polar regions and also with changes in the mass balance of surface and subsurface water at lower latitudes, especially in India, the USA and China where groundwater pumping for irrigation is on a massive scale.
Clearly, human activity is not only changing climate, but also our planet’s astronomical behaviour. That connection, in itself, is enough to set alarm bells ringing, even though the axial shift’s main tangible effect is to change the length of the day by a few milliseconds. Polar wandering has been documented for the last 176 years. Conceivably, data on shifts in past direction and speed may allow climatic changes throughout the industrial revolution to be assessed independently of meteorological data and on a whole-planet basis.
Full-frontal skull of ‘Sue’, the best-preserved and among the largest specimens of T. rex (Credit: Scott Robert Anselmo, Wikimedia Commons)
Long-term followers of Earth-logs and its predecessor Earth-pages News will have observed my general detachment from the dinosaur hullabaloo, which just runs and runs. That is, except for real hold-the-front-page items. One popped up in the 16 April 2021 issue of Science (Marshall, C.R. et al. 2021. Absolute abundance and preservation rate of Tyrannosaurus rex. Science, v. 372, p. 284-287; DOI:10.1126/science.abc8300). For over two million years in the Late Cretaceous, just before all dinosaurs – except for birds – literally bit the dust, the authors estimated a lot of the dinosaurian poster-childTyrannosaurus rex lurking in North America. I write ‘lurking’ because ‘tyrant lizard the king’ when fully grown was so big that if it ran and fell over, it would have been unable to get up! Tangible evidence from trackways suggests that it ambled from place to place. The leg bones of a 7-tonner would probably have shattered at speeds above 18 km per hour, and accelerating to the speed of a human jogger would, anyhow, have exhausted its energy reserves, But it was agile enough to be an ambush predator; it could even pirouette! And it could crush bones so well that it was able to consume prey entirely. It has been suggested that T. rex may have been a scavenger, at least in old age. Whatever, how is it possible to estimate numbers of any extinct species, let alone dinosaurs?
The stumbling block to getting a result that is better than guesswork is the fossil record of a species. First, it is incomplete, secondly the chance of finding a fossil varies from area to area, depending on all kinds of factors. These include the degree of exposure of sedimentary rock formed by the environment in which they thrived, as well as the vagaries of preservation due to post-mortem scavenging, erosion and water transport. In life the population density of a particularspecies varies between different ecosystems and from species to species. For instance, more lions can thrive in open rangeland than in wooded environments, whereas the opposite holds for tigers: probably because of different hunting strategies. Many factors such as these conspire to thwart realistic estimates of ancient populations. Studies of living species, however, suggest that population density of an animal species is inversely related to the average body mass of individuals. Take British herbivores: there are many more rabbits than there are deer. On the grasslands of East Africa hyenas and wild dogs outnumber lions. This mass-population relationship (Damuth’s Law) outlined by US ecologist John Damuth also depends on where a species exists in the food chain (its trophic level) as well as its physiology. Yet for living species, populations of flesh-eating mammals of similar mass show a 150-fold variation; a scatter that results from their different habits and habitats and also their energy requirements. Because they are warm-blooded (endothermic), small carnivorous mammals need a greater energy intake than do similar sized, cold-blooded reptiles, which need to eat far less. But not all living reptiles are ectothermic, especially the bigger ones. The Komodo dragon is mesothermic, midway between the two, and uses about a fifth of the energy needed by a similar-sized mammal carnivore. Population densities of dragons in the Lesser Sunda Islands are more than twice those of physiologically comparable mammalian predators.
A number of features suggest that the metabolism of carnivorous dinosaurs lay midway between those of large predatory mammals and big lizards like the Komodo dragon. This is the basic assumption for the analysis by Charles Marshall and colleagues. They did not focus on the biggest T. rex specimens, but on the average, estimated body mass of adults. There are numerous smaller specimens of the beast, but clearly some of these would have been sexually immature. It has been estimated that adulthood would have been achieved by around 15 years. The size data seem to show that achieving sexual maturity was accompanied by a 4 to 5 year growth spurt from the 2 to 3 tonnes of the largest juveniles to reach >7 t in the largest known adults which may have lived into their early 30s. The authors used this range to estimate a mean adult mass of 5.2 t. Taking this parameter and much more intricate factors into account, using intricate Monte Carlo simulations Marshall et al. came up with an estimate of 20 thousand T. rex adults across North America at any one time: but with an uncertainty of between 1,300 to 328,000. Spread over the 2.3 million km2 area of Late Cretaceous North America that lay above sea level their best-estimated population density would have been about 1 individual for every 100 square kilometres. An area the size of California could have had about 3800 adult Tyrannosaurus rex, while there may well have been two in Washington DC. Lest one’s imagination gets overly excited, were tigers and lions living wild today in North America under similar ecological conditions there would have been 12 and 28 respectively in the US capital. Yet those two adult Washingtonian T. rexs would have been unable to catch anything capable of a sustained jog, without keeling over. The juveniles weighing in at up to 3 tonnes would probably have been the real top predators; the smaller, the swifter and thus most fierce. Which leaves me to wonder, “Did the early teenagers catch the prey for their massive parents to chow-down on?”
Before 40 thousand years (ka) ago Europe was co-occupied by Neanderthals and anatomically modern humans (AMH) for between five to seven thousand years; about 350 generations – as long as the time since farming began in Neolithic Britain to the present day. Populations of both groups were probably low given their dependence on hunting and foraging during a period significantly colder than it is now. Crude estimates suggest between 3,000 to 12,000 individuals in each group; equivalent to the attendance at a single English Football League 2 match on a Covid-free winter Saturday afternoon. Moving around Europe south of say 55°N, their potential range would have been around 5 million square kilometres, which very roughly suggests that population density would be one person for every 200 km2. That they would have moved around in bands of, say, 10 to 25 might seem to suggest that encounters were very infrequent. Yet a hybrid Neanderthal-Denisovan female found in Siberia yielded DNA that suggested a family connection with Croatia, 5,000 km away (see: Neanderthal Mum meets Denisovan Dad, August 2018); early humans moved far and wide.
The likely appearances of Neanderthals and anatomically modern humans when they first met between 50 and 40 thousand years ago. (Credit: Jason Ford, New York University)
A sparsely populated land can be wandered through with little fear other than those of predators, sparse resources or harsh climate and lack of shelter. But it still seems incredible for there to have been regular meetings with other bands. But that view leaves out knowledge of good places to camp, hunt and forage that assure shelter, water, game and so forth, and how to get to them – a central part of hunter-gatherers’ livelihoods. There would have been a limited number of such refuges, considerably increasing chances of meeting. Whatever the physiognomic differences between AMH and Neaderthals, and they weren’t very striking, meeting up of bands of both human groups at a comfortable campsite would be cause for relief, celebration, exchanges of knowledge and perhaps individuals of one group to partner members of the other.
As well as that from Neanderthals, ancient DNA from very early European AMH remains has increasingly been teased out. The latest comes from three individuals from Bacho Kiro Cave in Bulgaria dated to between 45.9 to 42.6 ka; among the earliest known, fully modern Europeans. One had a Neanderthal ancestor less than six generations removed (perhaps even a great-great grandparent 60 years beforehand). Because of the slight elapsed time, the liaison was probably in Europe, rather than in the Middle East as previously suggested for insertion of Neanderthal genes into European ancestry. The genetic roots of the other two families stemmed back seven to ten generations – roughly 100 to 150 years (Hajdinjak, M. and 31 others 2021. Initial Upper Palaeolithic humans in Europe had recent Neanderthal ancestry. Nature, v. 592, p. 253–257; DOI: 10.1038/s41586-021-03335-3). The interpretation of these close relationships stems from the high proportion of Neanderthal DNA (3 to 4 %) in the three genomes. The segments are unusually lengthy, which is a major clue to the short time since the original coupling; inherited segments tend to shorten in successive generations. The groups to which these AMH individuals belonged did not contribute to later Eurasian populations, but link to living East Asians and Native Americans. They seem to have vanished from Europe long before modern times. The same day saw publication of a fourth instance of high Neanderthal genetic content (~3 %) in an early European’s genome, extracted from a ~45 ka female AMH from Zlatý kůň (Golden Horse) Cave in Czechia (Prüfer, K. and 11 others 2021. A genome sequence from a modern human skull over 45,000 years old from Zlatý kůň in Czechia. Nature Ecology & EvolutionDOI: 10.1038/s41559-021-01443-x). In her case, too, the Neanderthal DNA segments are unusually lengthy, but indicate 70 to 80 generations (~2,000 to 3,000 years) had elapsed. Her DNA also suggests that she was dark-skinned and had brown hair and brown eyes. Overall her genetics, too, do not have counterparts in later European AMH. The population to which she belonged may have migrated westwards from the Middle East, where one of her ancestors had mated with a Neanderthal, perhaps as long as 50 ka ago. But that does not rule out her group having been in Europe at that time. A later modern human, dated at 42 to 37 ka, is a young man from the Petştera cu Oase cave in Romania, whose forbears mixed with Neanderthals. His genome contains 6.4% of Neanderthal DNA, suggesting that his Neanderthal ancestor lived a mere 4 to 6 generations earlier, most likely in Europe, and was perhaps one of the last of that group.
The data suggest that once modern humans came into contact with their predecessors in the Middle East and Europe, mixture with Neanderthals was ‘the rule rather than the exception’. Yet their lack of direct relationship to later Europeans implies that AMH colonisation of Europe occurred in successive waves of people, not all of whom survived. As Palaeolithic specialist Chris Stringer of the Natural History Museum in London cautions, of these multiple waves of incomers ‘Some groups mixed with Neanderthals, and some didn’t. Some are related to later humans and some are not’. Even five thousand years after ‘first contact’, relations of modern humans with Neanderthals remained ‘cordial’, to say the least, including with the last few before their extinction.
Plate tectonics is easily thought of as being dominated by continental drift, the phenomenon that Alfred Wegener recognised just over a century ago. So it is at present, the major continents being separated by spreading oceans. Yet, being placed on a near-spherical planet, continents also move closer to others; eventually to collide and weld together. Part of Wegener’s concept was that modern continents formed from the breakup of a single large one that he called Pangaea; a supercontinent. The current drifting apart began in earnest around the end of the Triassic Period (~200 Ma), after 200 Ma of Pangaea’s dominance of the planet along with a single large ocean (Panthalassa) covering 70% of the Earth’s surface. Wegener was able to fit Pangaea together partly on the basis of evidence from the continents’ earlier geological history. In particular the refit joined up zones of intense deformation from continent to continent. Although he did not dwell on their origin, subsequent research has shown these zones were the lines of earlier collisions between older continental blocks, once subduction had removed the intervening oceanic lithosphere; Pangaea had formed from an earlier round of continental drift. Even older collision zones within the pre-Pangaea continental blocks suggested the former existence of previous supercontinents.
Aided by the development of means to divine the position of the magnetic poles relative to differently aged blocks on the continents, Wegener’s basic methods of refitting have resulted in the concept of supercontinent cycles of formation and break-up. It turns out that supercontinents did not form by all earlier continental clanging together at one time. The most likely scenario is that large precursors or ‘megacontinents’ (Eurasia is the current example) formed first, to which lesser entities eventually accreted A summary of the latest ideas on such global tectonic cycles appeared in the November 2020 issue of Geology (Wang, c. et al. 2020. The role of megacontinents in the supercontinent cycle. Geology, v. 49 p. 402-406; DOI: 10.1130/G47988.1). Chong Wang of the Chinese Academy of Sciences and colleagues from Finland and Canada identify three such cycles of megacontinent formation and the accretion around them of the all-inclusive supercontinents of Columbia, Rodinia and Pangaea since about 1750 Ma (Mesoproterozoic). They also suggestion that a future supercontinent (Amasia) is destined to agglomerate around Eurasia.
Known megacontinents in relation to suggested supercontinents since the Mesoproterozoic (credit: Wang et al.; Fig 2)
The further back in time, the more cryptic are ancient continent-continent collision zone or sutures largely because they have been re-deformed long after they formed. In some cases younger events that involved heating have reset their radiometric ages. The oldest evidence of crustal deformation lies in cratons, where the most productive source of evidence for clumping of older continental masses is the use of palaeomagnetic pole positions. This is not feasible for the dominant metamorphic rocks of old suture zones, but palaeomagnetic measurements from old rocks that have been neither deformed nor metamorphosed offer the possibility of teasing out ancient supercontinents. Commonly cratons show signs of having been affected by brittle extensional deformation, most obviously as swarms of vertical sheets or dykes of often basaltic igneous rocks. Dykes can be dated readily and do yield reliable palaeomagnetic pole positions. Some cratons have multiple dyke swarms. For example the Archaean Yilgarn Craton of Western Australia, founded on metamorphic and plutonic igneous crust that formed by tectonic accretion between 3.8 to 2.7 Ga, has five of them spanning 1.4 billion years from late-Archaean (2.6 Ga) to Mesoproterozoic (1.2 Ga). Throughout that immense span of time the Yilgarn remained as a single continental block. Also, structural trends end abrubtly at the craton margins, suggesting that it was once part of a larger ‘supercraton’ subsequently pulled apart by extensional tectonics. The eleven known cratons show roughly the same features.
On the strength of new, high quality pole positions from dykes of about the same ages (2.62 and 2.41 Ga) cutting the Yilgarn and Zimbabwe cratons, geoscientists from Australia, China, Germany, Russia and Finland, based at Curtin University in Western Australia, have attempted to analyse all existing Archaean and Palaeoproterozoic pole positions (Liu, Y. et al. 2021. Archean geodynamics: Ephemeral supercontinents or long-lived supercratons. Geology, v. 49 ; DOI: 10.1130/G48575.1). The Zimbabwe and Yilgarn cratons, though now very far apart, were part of the same supercraton from at least 2.6 Ga ago. Good cases can be made for several other such large entities, but attempting fit them all together as supercontinents by modelling is unconvincing. The modelled fit for the 2.6 Ga datum is very unlike that for 2.4 Ga; in the intervening 200 Ma all the component cratons ould have had to shuffle around dramatically, without the whole supercontinent edifice breaking apart. However, using the data to fit cratons together at two supercratons does seem to work, for the two assemblies remain in the same configurations for both the 2.6 and 2.4 Ga data.
Interestingly, all cratonic components of one of the supercratons show geological evidence of the major 2.4 Ga glaciation, whereas those of the other show no such climatic indicator. Yet the entity with glacial evidence was positioned at low latitudes around 2.4 Ga, the ice-free one spanning mid latitudes. This may imply that the Earth’s axial tilt was far higher than at present. The persistence of two similar sized continental masses for at least 200 Ma around the end of the Archaean Eon also hints at a different style of tectonics from that with which geologists are familiar. Only palaeomagnetic data from the pre 2.6 Ga Archaean can throw light on that possibility. That requires older, very lightly or unmetamorphosed rocks to provide palaeopole positions. Only two cratons, the Pilbara of Western Australia and the Kaapvaal of South Africa, are suitable. The first yielded the oldest-known pole dated at 3.2 Ga, the oldest from the second is 2.7 Ga. A range of evidence suggests that Pilbara and Kaapvaal cratons were united during at least the late Archaean.
The only answer to the question posed by this item’s title is ‘There probably wasn’t a single supercontinent at the end of the Archaean, but maybe two megacontinents or supercratons’. Lumps of continental lithosphere would move and – given time – collide once more than one lump existed, however the Earth’s tectonics operated …
The Ga-Mohana rock shelter in North Cape Province, South Africa (Credit: Jayne Wilkins, University of the Witwatersrand)
We all, especially as kids, have collected visually interesting objects for no particular reason other than they ‘caught our eye’: at the beach; from ploughed fields; river gravel, or at the side of a path. They end up in sheds, attics and mantel shelves. In an online News and Views article at the Nature website Pamela Willoughby discusses the significance of a paper on an archaeological site in the southern Kalahari Desert, North Cape Province South Africa (Willoughby, P.R. 2021. Early humans far from the South African coast collected unusual objects. Nature, v. 323, online News and Views; DOI: 10.1038/d41586-021-00795-5). Jayne Wilkins and co-workers from South Africa, Australia, Canada, Austria and the UK have investigated a rock shelter, with floor deposits going back over 100 thousand years. The researchers have, in a sense, continued the long human habit of seeking objets trouvée by using trowels and sieves to excavate the shelter’s floor sediments. They found a collection of cleavage fragments of white calcite and abundant shards of ostrich shell. Ga-Mohana Hill is still a place that locals consider to have spiritual significance. The authors consider the original collectors to have had no other motive than aesthetic pleasure and perhaps ritual, and that this signifies perhaps the earliest truly modern human behaviour. Yet, in 1925 a cave on the other side of South Africa, in Limpopo Province, yielded a striking example of a possible ‘collector’s piece’ from much earlier times. It is associated with remains of australopithecines and has been dated to around 3 Ma ago (see: Earliest sign of a sense of aesthetics, November 2020).
Source: Wilkins, J. et al.2021. Innovative Homo sapiens behaviours 105,000 years ago in a wetter Kalahari. Nature, v. 323 DOI: 10.1038/s41586-021-03419-0
Just over a month since evidence emerged that the Arctic Ocean was probably filled with fresh water from 150 to 131 and 70 to 62 thousand years ago (When the Arctic Ocean was filled with fresh water, February 2021), another study has shaken ‘received wisdom’ about Arctic conditions. This time it is about the climate in polar regions, and comes not from an ice core but speleothem or calcium carbonate flowstone that was precipitated on a cave wall in north-eastern Greenland. The existence of caves at about 80°N between 350 to 670 m above sea level in a very cold, arid area is a surprise in itself, for they require flowing water to form. The speleothem is up to 12 cm thick, but none is growing under modern, relatively warm conditions, cave air being below freezing all year. For speleothem to form to such an extent suggests a long period when air temperature was above 0°C. So was it precipitated before glacial conditions were established in pre-Pleistocene times?
Limestone caves in the arid Grottedal region of north-eastern Greenland (Credit: Moseley et al. 2021; Fig 2D)
A standard means of discovering the age of cave deposits, such as speleothem or stalagmites, is uranium-series dating (see: Irish stalagmite reveals high-frequency climate changes, December 2001). In this case the sheet of flowstone turned out to have been deposited between 588 to 537 thousand years ago; a 50 ka ‘window’ into conditions that prevailed during the middle part of 100 ka climatic cycling – about 6 glacial-interglacial stages before present. (Moseley, G.E. et al. 2021. Speleothem record of mild and wet mid-Pleistocene climate in northeast Greenland. Science Advances, v. 7, online article eabe1260; DOI: 10.1126/sciadv.abe1260). Roughly half the layer formed during an interglacial, the rest under glacial conditions that followed. Detailed oxygen-isotope studies revealed that air temperatures during which calcium carbonate was precipitated were at least 3.5°C above those prevailing in the area at present; warm enough to melt local permafrost and to increase the summer extent of ice-free conditions in the Arctic Ocean, thereby encouraging greater rainfall. These warm and wet conditions correlate with increased solar heating over the North Atlantic region at that time, as suggested by modelling based on Milankovich astronomical forcing.
Unfortunately, the climate record derived from cores through the Greenland ice sheet only reaches back to about 120 ka, during the last interglacial period. So it is not possible to match the speleothem results to an alternative data set. Yet, thanks to the rediscovery of dirt cored from the very base of the deepest part of the ice sheet (beneath Camp Century) in a freezer in Denmark – it was discarded as interest focused on the record preserved in the ice itself – there is now evidence for complete melting of the ice sheet at some time in the past. The dirt contains abundant fossil plants. Analysing radioactive isotopes of aluminium and beryllium that formed in associated quartz grains as a result of cosmic ray bombardment when the area was ice-free suggests two periods of complete melting followed by glaciation , the second being within the last million years.
The onshore Arctic climate is clearly more unstable than previously believed.