How vulnerable are coastal zones to sea-level rise?

These days only a fool or a scoundrel would deny anthropogenic global warming and its primary outcome of inevitable sea-level rise. Yet no agency, either national or international, has set out to attempt a detailed global assessment of coastal vulnerability. There is no shortage of relevant data to do that – from remote sensing, digital elevation models, simulations of tides and wave height from meteorological data and much else. Thankfully, a team of geomorphologists, climate scientists, sociologists and economists from The Netherlands and France, led by Vindhya Basnayake of the University of Twente, The Netherlands, have taken up the challenge (Basnayake, V. et al. 2026. A global assessment of coastal vulnerability and dominant contributors. Nature Communications, in-press manuscript; DOI: 10.1038/s41467-025-67275-6).

About 10% of the world’s population – a bit less than a billion – live in coastal zones at less than 10 m elevation above mean sea level, and two-fifths that may bear the brunt of future rise. Coastal flooding and erosion threaten landforms, ecosystems and built infrastructure. Both physical effects of sea-level rise potentially may disrupt population centres, livelihoods and marine and coastal industries. More frequent and severe storms driven by global warming are also expected to increase the frequency and intensity of coastal hazards over time. Basnayake  et al. have developed a Coastal Vulnerability Index (CVI) to express the hazard presented by future flooding and erosion to all coastal areas. The CVI is based on geomorphology, geology, coastal slope, coastal relief, wave height, and relative sea level change. It also integrates the local adaptive capacity and community resilience from socioeconomic and geopolitical data. Importantly CVI values are calculated at 1 km intervals along the global coastline at over 350 thousand locations. The approach used by the team incorporates from previous analyses time series for wave and tide heights and for changing sediment supply. The fine spatial resolution of data allows for identification of critical micro-regions – even within generally less vulnerable countries. Such a nuanced approach shows up the complexity of coastal risk that one-size-fits-all approaches are destined to miss.

Steep coastal slopes are less vulnerable than gentle ones, which allow greater penetration by marine hazards. The more rugged coastal terrain, the less vulnerable the coast is by acting like a large scale breakwater. Mean wave height controls the energy impinging on a coast, and is affected by wave ‘fetch’, so that ocean-facing coasts are more vulnerable than more enclosed locations. Offshore seismicity, as in island arcs, increases vulnerability to tsunamis. Tidal range has a counterintuitive effect, large ranges reducing the time a coast is in direct contact with the sea, whereas low ranges place the sea next to land for much longer. Although global sea level is destined to rise uniformly, some coasts are rising through tectonic or glacio-eustatic uplift, while others are actively subsiding; so relative sea-level change is used to address vulnerability. Other considerations assessed by Basnayake  et al. are subsidence due to coastal groundwater extraction, the presence of protective coastal vegetation such as mangroves, and the influence of deltas and estuaries.
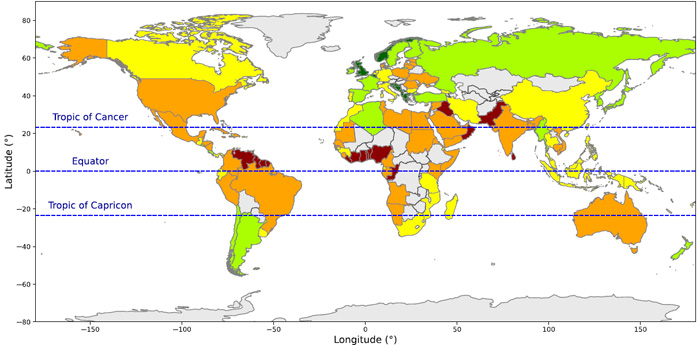
Coastal vulnerability by country: dark blue – very low; green – low; yellow – moderate; orange – high; dark red – very high. (Credit: Basnayake et al. Fig 2a)

The figure above summarises the results of the CVI study on a country-by-country basis. Eurasia is surprisingly the least vulnerable continent in this respect, especially Britain and Norway that are so exposed to the fierce North Atlantic. That is partly due to those countries high adaptive capacity and communal resilience, but mainly to their rugged and deeply indented western coasts; a legacy of glaciation. It’s important to note that coloration on the figure can be misleading. For instance, the higher resolution data pinpoint extremely high vulnerability of stretches of coast dominated by low-lying deltas, such as those of Pakistan, India, Myanmar and SE Asia. Equally surprising is the high vulnerability of North America at similar latitudes; somewhat ironic for the heartland of climate-change denial. High resolution also points to counterintuitive hazards; for instance coastal defences sometimes exacerbate vulnerability by increasing erosion on nearby undefended stretches and by hindering sediment movement. Increased onshore infrastructure boosts runoff and erosion in the coastal realm and displaces natural buffers, such as coastal forest, to storm surges: perhaps partly responsible for the high vulnerability of coasts around the hurricane belt of the Gulf of Mexico and Caribbean. Of the nineteen countries with greatest vulnerability 12 are in West Africa and NE South America and 2 in the Caribbean area. The paper is well worth reading, to get a flavour of the complexity involved and the vast magnitude of the task of ameliorating risk of coastal devastation that lies ahead in the next decades.

See especially: Global Coastal Vulnerability: Key Causes Revealed. Scienmag, 14 January 2026.

Ancient mining pollutants in river sediments reveal details of early British economic history

People have been mining in Britain since Neolithic farmers opened the famous Grimes Graves in Norfolk – a large area dotted with over 400 pits up to to 13 metres deep. The target was a layer of high quality black flint in a Cretaceous limestone known as The Chalk. Later Bronze Age people in Wales and Cornwall drove mine shafts deeper underground to extract copper and tin ores to make the alloy bronze. The Iron Age added iron ore to the avid search for sources of metals. The production and even export of metals and ores eventually attracted the interest of Rome. Roman invasion in 43 CE during the reign of Claudius annexed most of England and Wales to create the province of Britannia. This lasted until the complete withdrawal of Roman forces around 410 CE. Roman imperialism and civilisation depended partly on lead for plumbing and silver coinage to pay its legionaries. Consequently, an important aspect in Rome’s four-century hegemony was mining, especially for lead ore, as far north as the North Pennines. This littered the surface in mining areas with toxic waste. Silver occurs in lead ore in varying proportions. In the Bronze Age early metallurgists extracted silver from smelted, liquid lead by a process known as cupellation. The molten Pb-Ag alloy is heated in air to a much higher temperature than its melting point, when lead reacts with oxygen to form a solid oxide (PbO) and silver remains molten.

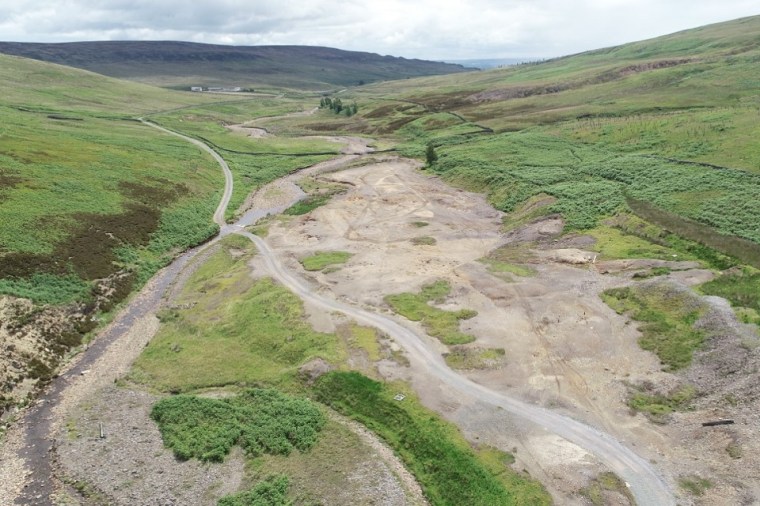
Mine waste in the North Pennine orefield of England. Credit: North Pennines National Landscape

Until recently, historians believed that the fall of the Western Empire brought economic collapse to Britain. Yet archaeologists have revealed that what was originally called the “Dark Ages” (now Early Medieval Period) had a thriving culture among both the remaining Britons and Anglo Saxon immigrants. A means of tracking economic activity is to measure the amount of pollutants from mining waste at successive levels in the alluvium of rivers that flow through orefields. Among the best known in Britain is the North Pennine Orefield of North Yorkshire and County Durham through which substantial rivers flow eastwards, such as the River Ure that flows through the heavily mined valley of Wensleydale. A first attempt at such geochemical archaeology has been made by a British team led by Christopher Loveluck of Nottingham University (Loveluck, C.P. and 10 others 2025. Aldborough and the metals economy of northern England, c. AD 345–1700: a new post-Roman narrative. Antiquity: FirstView, online article; DOI: 10.15184/aqy.2025.10175). Aldborough in North Yorkshire – sited on the Romano-British town of Isurium Brigantum – lies in the Vale of York, a large alluvial plain. The River Ure has deposited sands, silts and muds in the area since the end of the last Ice Age, 11 thousand years ago.

Loveluck et al. extracted a 6 m core from the alluvium on the outskirts of Aldborough, using radiocarbon and optically-stimulated luminescence of quartz grains to calibrate depth to age in the sediments.  The base of the core is Mesolithic in age (~6400 years ago) and extends upwards to modern times, apparently in an unbroken sequence. Samples were taken for geochemical analysis every 2 cm through the upper 1.12 m of the core, which spans the Roman occupation (43 to 410 CE), the early medieval (420 to 1066 CE), medieval (1066 to 1540 CE), post-medieval (1540 to 1750 CE) and modern times (1750 CE to present). Each sample was analysed for 56 elements using mass spectrometry; lead, silver, copper, zinc, iron and arsenic being the elements of most interest in this context. Other data gleaned from the sediment are those of pollen, useful in establishing climate and ecological changes. Unfortunately, the metal data begin in 345 CE, three centuries after the Roman invasion, by which time occupation and acculturation were well established. The authors assume that Romans began the mining in the North Pennines. They say nothing about the pre-mining levels of pollution from the upstream orefield nor mining conducted by the Iron Age Brigantes. For this kind of survey, it is absolutely essential that a baseline is established for the pollution levels under purely natural conditions. The team could have analysed sediment from the Mesolithic when purely natural weathering, erosion and transport could safely be assumed, but they seem not to have done that.

The team has emphasised that their data suggest that mining for lead continued and even increased through the ‘Dark Ages’ rather than declining, in an economic ‘slump’ once the Romans left, as previous historians have suggested. Lead pollution continued at roughly the same levels as during the Roman occupation through the Early Medieval Period and then rose to up to three times higher after the late 14th century. The data for silver are different. The Ag data from Aldborough show a large ‘spike’ in 427 to 427 CE. Interestingly this is after the Roman withdrawal. Its level in alluvium then ‘flatlines’ at low abundances until the beginning of the 14th century when again there is a series of ‘booms’. This seems to me to mark sudden spells of coining, after the Romans left perhaps first to ensure a money economy remained possible, and then as a means of funding wars with the French in the 14th century. The authors also found changing iron abundances, which roughly double from low Roman levels to an Early Medieval peak and then fall in the 11th century: a result perhaps of local iron smelting. The overall patterns for zinc and copper differ substantially from those of lead, as does that for arsenic which roughly follows the trend for iron. That might indicate that local iron production was based on pyrite (FeS2) which can contain arsenic at moderate concentrations: pyrite is a common mineral in the ore bodies of the North Pennines’ The paper by Loveluck et al. is worth reading as a first attempt to correlate stratigraphic geochemistry data with episodes in British and, indeed, wider European history. But I think it has several serious flaws, beyond the absence of any pre-Roman geochemical baseline, as noted above. No data are presented for barium (Ba) and fluorine (F) derived from the gangue minerals baryte (BaSO4) and fluorite (CaF2), which outweigh lead and zinc sulfides in North Pennine ore bodies, yet had no use value until the Industrial Revolution. They would have made up a substantial proportion of mine spoil heaps – useful ores would have been picked out before disposal of gangue – whose erosion, comminution and transport would make contributions to downstream deposition of alluvium consistent with the pace of mining. That is: Ba and F data would be far better guides to industrial activity. There is a further difficulty with such surveys in northern Britain. The whole of the upland areas were subjected to repeated glaciation, which would have gathered exposed ore and gangue and dumped it in till, especially in the numerous moraines exposed in valleys such as Wensleydale. Such sources may yield sediment in periods of naturally high erosion during floods. Finally, the movement of sediment downstream is obviously not immediate, especially when waste is disposed in large dumps near mines Therefore phases of active mining may not contribute increased toxic waste far downstream until decades or even centuries later. These factors could easily have been clarified by a baseline study from earlier archaeological periods when mining was unlikely, into which the Aldborough alluvium core penetrates

Human interventions in geological processes

During the Industrial Revolution not only did the emission of greenhouse gases by burning fossil fuels start to increase exponentially, but so too did the movement of rock and sediment to get at those fuels and other commodities demanded by industrial capital. In the 21st century about 57 billion tons of geological materials are deliberately moved each year. Global population followed the same trend, resulting in increasing expansion of agriculture to produce food. Stripped of its natural cover on every continent soil began to erode at exponential rates too. The magnitude of human intervention in natural geological cycles has become stupendous, soil erosion now shifting on a global scale about 75 billion tons of sediment, more than three times the estimated natural rate of surface erosion. Industrial capital together with society as a whole also creates and dumps rapidly growing amounts of solid waste of non-geological provenance. The Geological Society of America’s journal Geology recently published two research papers that document how capital is transforming the Earth.

Dust Bowl conditions on the Minnesota prairies during the 1930s.

One of the studies is based on sediment records in the catchment of a tributary of the upper Mississippi River. The area is surrounded by prairie given over mainly to wheat production since the mid 19th century. The deep soil of the once seemingly limitless grassland developed by the prairie ecosystem is ideal for cereal production. In the first third of the 20th century the area experienced a burst of erosion of the fertile soil that resulted from the replacement of the deep root systems of prairie grasses by shallow rooted wheat. The soil had formed from the glacial till deposited by the Laurentide ice sheet than blanketed North America as far south as New York and Chicago. Having moved debris across almost 2000 km of low ground, the till is dominated by clay- and silt-sized particles. Once exposed its sediments moved easily in the wind. Minnesota was badly affected by the ‘Dust Bowl’ conditions of the 1930s, to the extent that whole towns were buried by up to 4.5 metres of aeolian sediment. For the first time the magnitude of soil erosion compared with natural rates has been assessed precisely by dating layers of alluvium deposited in river terraces of one of the Mississippi’s tributaries  (Penprase, S.B. et al. 2025. Plow versus Ice Age: Erosion rate variability from glacial–interglacial climate change is an order of magnitude lower than agricultural erosion in the Upper Mississippi River Valley, USA. Geology, v. 53, p. 535-539; DOI: 10.1130/G52585.1).

Shanti Penprase of the University of Minnesota and her colleagues were able to date the last time sediment layers at different depths in terraces were exposed to sunlight and cosmic rays, by analysing optically stimulated luminescence (OSL) and cosmogenic 10Be content of quartz grains from the alluvium. The data span the period since the Last Glacial Maximum 20 thousand years ago during which the ecosystem evolved from bare tundra through re-vegetation to pre-settlement prairie. They show that post-glacial natural erosion had proceeded at around 0.05 mm yr-1 from a maximum of 0.07 when the Laurentide Ice Sheet was at its maximum extent. Other studies have revealed that after the area was largely given over to cereal production in the 19th century erosion rates leapt to as high as 3.5 mm yr-1 with a median rate of 0.6 mm yr-1, 10 to 12 times that of post-glacial times. It was the plough and single-crop farming introduced by non-indigenous settlers that accelerated erosion. Surprisingly, advances in prairie agriculture since the Dust Bowl have not resulted in any decrease in soil erosion rates, although wind erosion is now insignificant. The US Department of Agriculture considers the loss of one millimetre per year to be ‘tolerable’: 14 times higher than the highest natural rate in glacial times.

The other paper has a different focus: how human activities may form solid rock. The world over, a convenient means of disposing of unwanted material in coastal areas is simply to dump waste in the sea. That has been happening for centuries, but as for all other forms of anthropogenic waste disposal the volumes have increased at an exponential rate. The coast of County Durham in Britain began to experience marine waste disposal when deep mines were driven into Carboniferous Coal Measures hidden by the barren Permian strata that rest unconformably upon them. Many mines extended eastwards beneath the North Sea, so it was convenient to dump 1.5 million tons of waste rock annually at the seaside. The 1971 gangster film Get Carter starring Michael Caine includes a sequence showing ‘spoil’ pouring onto the beach below Blackhall colliery, burying the corpse of Carter’s rival. The nightmarish, 20 km stretch of grossly polluted beach between Sunderland and Hartlepool also provided a backdrop for Alien 3. Historically, tidal and wave action concentrated the low-density coal in the waste at the high-water mark, to create a free resource for locals in the form of ‘sea coal’ as portrayed in Tom Scott Robson’s 1966 documentary Low Water. Closure of the entire Duham coalfield in the 1980s and ‘90s halted this pollution and the coast is somewhat restored – at a coast of around £10 million.

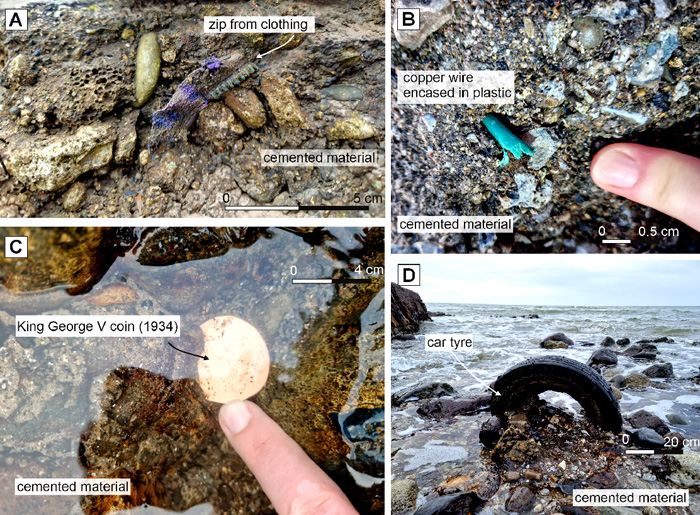
‘Anthropoclastic’ conglomerate formed from iron-smelting slag dumped on the West Cumbrian coast. It incorporates artefacts as young as the 1980s, showing that it was lithified rapidly. Credit: Owen et al, Supplementary Figure 2

On the West Cumbrian coast of Britain another industry dumped millions of tons of waste into the sea. In the case it was semi-molten ‘slag’ from iron-smelting blast furnaces poured continuously for 130 years until steel-making ended in the 1980s. Coastal erosion has broken up and spread an estimated 27 million cubic metres of slag along a 2 km stretch of beach. Astonishingly this debris has turned into a stratum of anthropogenic conglomerate sufficiently well-bonded to resist storms (Owen, A., MacDonald, J.M. & Brown, D.J 2025. Evidence for a rapid anthropoclastic rock cycle. Geology, v. 53, p. 581–586; DOI: 10.1130/G52895.1). The conglomerate is said by the authors to be a product of ‘anthropoclastic’ processes. Its cementation involves minerals such as goethite, calcite and brucite. Because the conglomerate contains car tyres, metal trouser zips, aluminium ring-pulls from beer cans and even coins lithification has been extremely rapid. One ring-pull has a design that was not used in cans until 1989, so lithification continued in the last 35 years.

Furnace slag ‘floats’ on top of smelted iron and incorporates quartz, clays and other mineral grains in iron ore into anhydrous calcium- and magnesium-rich aluminosilicates. This purification is achieved deliberately by including limestone as a fluxing agent in the furnace feed. The high temperature reactions are similar to those that produce aluminosilicates when cement is manufactured. Like them, slag breaks down in the presence of water to recrystallis in hydrated form to bond the conglomerate. This is much the same manner as concrete ‘sets’ over a few days and weeks to bind together aggregate. There is vastly more ‘anthropoclastic’ rock in concrete buildings and other modern infrastructure. Another example is tarmac that coats millions of kilometres of highway.

See also: Howell, E. 2025. Modern farming has carved away earth faster than during the ice age. Science, v. 388

Did the Meteor Crater impact in Arizona dam the Grand Canyon 56 thousand years ago?

Meteor Crater, Arizona, USA. Credit: Travel in USA

Meteor Crater, 60 km east of Flagstaff in Arizona, USA, is probably the most visited site of an impact by an extraterrestrial object. At 1.3 km across it isn’t especially big, but it is exceptionally well preserved, having formed a mere 55.6 ka ago. Apart from its shape its impact origin is proved by its rim, which shows overturning and inversion of strata that it penetrated. The 40 metre  diameter nickel-iron object that did the damage arrived at a speed around 13 km s-1 and delivered kinetic energy equivalent to an explosion of 10 million tons of TNT. This was sufficient to vaporise the body, except for a few fragments. Impressive as that is, the impact was tiny compared with others known on Earth, such as the Chicxulub impact that ended the Mesozoic Era 60 Ma ago. Nevertheless, the surface blast would have sterilised an area up to 1000 km2 around the impact, i.e. up to 17 km in all directions. Yet, most of the impact energy would have affected the surrounding crust. It’s a place worth visiting.

The other must-see site in northern Arizona is the Grand Canyon, some 100 km north of Flagstaff by train, and about 320 km by road. Unlike Meteor Crater, whose origins were well established  more than 50 years ago, the Grand Canyon still draws research teams to study the geology of the rock formations through which it cuts and the geomorphological processes that formed it. Several expeditions have examined caves high above the level of the Colorado River that has cut the Canyon since the start of the Pliocene Epoch, some 5 Ma ago. One objective of this research has been to document past flooding, due to the massive landslides and rock falls that must have occurred as cliffs became unstable during canyon formation. One cave – Stanton’s Cave – is 45 m above the present level of the Colorado: about the height of a 16 storey block of flats. The cave floor is made of well-bedded sand that contains driftwood logs, as do other caves along the canyon. Dating the logs from cave to cave should give at least an idea of the history of flooding and thus cliff collapses. In the case of Stanton’s Cave early radiocarbon dating yielded results close to the maximum that the rapid decay of 14C makes possible. Such dating at the limit of the technique is imprecise. The oldest existing radiocarbon age in this case is 43.5 ± 1.5 ka from a 1984 study. Since then, this dating technique has advanced considerably.

Fig Remnants of a landslide, subsequently breached, in the Grand Canyon downstream of Stanton’s Cave. Credit: Richard Hereford

Karl Karlstrom – whose father was also entranced by cave deposits in the Grand Canyon in the 1960s – together with colleagues from the US managed to persuade radiocarbon specialists from Australia and New Zealand to improve the sediment dating (Karlstrom, K.E and 11 others 2025. Grand Canyon landslide-dam and paleolake triggered by the Meteor Crater impact at 56 ka. Geology, v. 53, online article; DOI: 10.1130/G53571.1). The new 14Cage of the logs is  55.25 ± 2.44 ka, confirmed by infrared stimulated luminescence (IRSL) dating of feldspar grains in the cave sand at  56.00 ± 6.39 ka  Combined with a new cosmogenic nuclide exposure age of 56.00 ± 2.40 ka  for the Meteor Crater ejecta the results are exciting. It looks as if the cliff fall that dammed the Colorado River to fill the cave with sediment coincided with the impact. Crater formation is estimated to have resulted in a seismic event of magnitude 5.4. In such a teetering terrain as the Grand Canyon cliffs, the impact-induced earthquake about 100 km away, even if attenuated to an effective magnitude estimated at 3.5  may have been sufficient to topple part of the cliffs. With cliffs that average 1.6 km high, such a collapse would have displaced sufficient debris to create a substantial barrier to flow of the Colorado River, which is tightly constrained between cliffs. The chaotic debris at the suggested dam site is now partly covered by round river cobbles, suggesting that it was soon overtopped, probably within a thousand years of the cliff collapse.

Because all the dates have substantial imprecision, it is not possible to claim that the authors have proved conclusively a direct connection between impact and cliff collapse. But neither do the age data disprove what is a plausible causal connection.

See also: UNM study finds link between Grand Canyon landslide and Meteor Crater impact. University of New Mexico News 15 July 2025

A cure for the Great British Pothole Plague?

Anyone who read the manifestos of the mainstream political parties in the UK – there may not be many who did – would have been amused to see that all promised to resolve the plague of potholes in the countries roads, both major and minor. For decades road users have been alarmed when hitting a pothole and in some cases had damage inflicted on their vehicles, and in the case of those on two wheels, on themselves. The RAC (Royal Automobile Club) has estimated that there are, on average, six potholes per mile on Britain’s roads: the greatest density in Europe. The AA (Automobile Association) estimated that almost £0.6 billion was spent in 2024 repairing pothole-damaged vehicles. This is not a new phenomenon. Before the advent of turnpike trusts in the late 18th century, which maintained roads travelled by Britain’s mail coach services, it was not uncommon to encounter potholes up to two metres deep. Legend has it that on one such route through northern Nottinghamshire two coach horses fell into a pothole and drowned. Scottish engineer, John Loudon McAdam invented a solution around 1820: crushed stone laid on the road surface in slightly convex layers, the topmost being bonded with stone dust. This ‘macadam’ surface created cambered highways that drained rainwater to the sides and downwards. Modern roads are still based on that principle, with the addition of tar or bitumen to the top layer to produce a hard, impermeable surface, which also prevents aggregate and dust being sucked from the surface by fast moving vehicles.

A spore of the club moss Lycopodium

So, why the potholes? Several reasons: increased traffic; heavier vehicles; less maintenance; patching rather than resurfacing. Most important: the materials and the weather. Dry, hot weather softens the bitumen and drives out volatile hydrocarbons making the bitumen less plastic. The pounding of tyres in cooler weather fractures the now stiffened bitumen, mainly at microscopic scales. Wetting of the tarmac seeps water into the microfractures. The formation of ice films jacks opens the microfractures and produces more in the cold stiff bitumen, eventually to separate the particles of aggregate in the asphalt. The wearing course begins to crumble so that aggregate grains escape and scatter. Thus weakened, the top layer breaks up into larger fragments and a pit forms to join up with others so that a pothole forms and grows. Wheels of traffic bounce when they cross a pothole, the shock of which causes the centre of degradation to shift and create more cavities. Simply filling the existing potholes merely serves to create new ones: a vicious cycle that can only be broken by complete resurfacing: the traffic cones come out!.

All this has been known for well over a century by civil engineers. Around the start of the 21st century – maybe slightly earlier – it dawned on engineers that the critical problem was degradation of bitumen. A petroleum derivative, occurring naturally as surface seeps in some oilfields, bitumen is chemically complex: a combination of asphaltenes and maltenes (resins and oils). Deterioration of bitumen through evaporation, oxidation and exposure to ultraviolet radiation decreases the maltene content and stiffens the binding agent in asphalt. So the earliest attempts at reducing pothole formation centred on rejuvenation by periodically adding substitutes for maltenes to road surfaces. Diesel (gas-oil) works, but is obviously hazardous. More suitable are vegetable oils such as waste cooking oils or those produced by pyrolysis of cotton, straw, wood waste and even animal manure. The problem is getting the rejuvenators into existing asphalt surfaces: clearly, simply spraying them on the surface seems a recipe for disaster! A solution that dawned on engineers around 2005 was to make bitumen that is ‘self-healing’.

Schematic of the production of microcapsules from club moss spores to contain sunflower oil to be used in self-healing asphalt (Credit: Alpizar-Reyes, E. et al. 2022)

Simply mixing rejuvenators into bitumen during asphalt manufacture will not do the trick, for the result would be a weakened binding agent at the outset. For the last 15 years researchers have sought means of adding rejuvenators in  porous capsules, to release them as microfractures begin to form: on demand, as it were. There have been dozens of publications about experiments that found ‘sticking points’. However, in early 2025 what seems to be a viable breakthrough splashed in the British press. It was made by an interdisciplinary team of scientists from King’s College London and Swansea University, in collaboration with scientists in Chile. They chemically treated spores of Lycopodium club mosses to perforate their cell walls and clear out their contents to be replaced by sunflower oil, an effective bitumen rejuvenator. Experiments showed that such microcapsules released the oil to heal cracks in aged  bitumen samples in around an hour. Mixed into bitumen to be added to asphalt they would remain ‘dormant’ until a microfracture formed in their vicinity released it, thereby making the asphalt binder self healing.

Will such an advance finally resolve the pothole plague? It may take a while …

See: Alpizar-Reyes, E. et al. 2022. Biobased spore microcapsules for asphalt self-healing. ACS Applied Materials & Interfaces, v. 14, p. 31296-31311; DOI: 10.1021/acsami.2c07301

A fully revised edition of Steve Drury’s book Stepping Stones: The Making of Our Home World can now be downloaded as a free eBook

A major breakthrough in carbon capture and storage?

Carbon capture and storage is in the news most weeks and is increasingly on the agenda for some governments. But plans to implement the CCS approach to reducing and stopping global warming increasingly draws scorn from scientists and environmental campaigners. There is a simple reason for their suspicion. State engagement, in the UK and other rich countries, involves major petroleum companies that developed the oil and gas fields responsible for unsustainably massive injection of CO2 into the atmosphere. Because they have ‘trousered’ stupendous profits they are a tempting source for the financial costs of pumping CO2 into porous sedimentary rocks that once contained hydrocarbon reserves. Not only that, they have conducted such sequestration over decades to drive out whatever petroleum fluids remaining in previously tapped sedimentary strata. For that second reason, many oil companies are eager and willing to comply with governmental plans, thereby seeming to be environmentally ‘friendly’. It also tallies with their ambitions to continue making profits from fossil-fuel extraction. But isn’t that simply a means of replacing the sequestered greenhouse gas with more of it generated by burning the recovered oil and natural gas; i.e. ‘kicking the can down the road’? Being a gas – technically a ‘free phase’ – buried CO2 also risks leaking back to the atmosphere through fractures in the reservoir rock. Indeed, some potential sites for its sequestration have been deliberately made more gas-permeable by ‘fracking’ as a means of increasing the yield of petroleum-rich rock. Finally, a litre of injected gas can drive out pretty much the same volume of oil. So this approach to CCS may yield a greater potential for greenhouse warming than would the sequestered carbon dioxide itself.

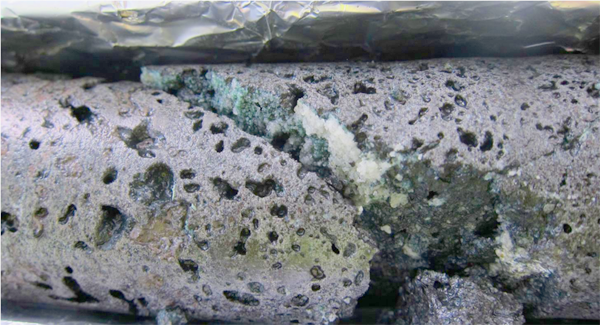
Image of calcite (white) and chlorite (cyan) formed in porous basalt due to CO2-charged water-rock interaction at the CarbFix site in Iceland. (Credit: Sandra Ósk Snæbjörnsdóttir)

Another, less widely publicised approach is to geochemically bind CO2 into solid carbonates, such as calcite (CaCO­3), dolomite (CaMgCO3), or magnesite (MgCO3). Once formed such crystalline solids are unlikely to break down to their component parts at the surface, under water or buried. One way of doing this is by the chemical weathering of rocks that contain calcium- and magnesium-rich minerals, such as feldspar (CaAl2Si2O8), olivine ([Fe,Mg]2SiO4) and pyroxene ([Fe,Mg]CaSi2O6) . Mafic and ultramafic rocks, such as basalt and peridotite are commonly composed of such minerals. One approach involves pumping the gas into a Icelandic borehole that passes through basalt and letting natural reactions do the trick. They give off heat and proceed quickly, very like those involved in the setting of concrete. In two experimental field trials 95% of injected CO2 was absorbed within 18 months. Believe it or not, ants can do the trick with crushed basalt and so too can plant roots. There have been recent experiments aimed at finding accelerants for such subsurface weathering (Wang, J. et al. 2024. CO2 capture, geological storage, and mineralization using biobased biodegradable chelating agents and seawater. Science Advances, v. 10, article eadq0515; DOI: 10.1126/sciadv.adq0515). In some respects the approach is akin to fracking. The aim is to connect isolated natural pores to allow fluids to permeate rock more easily, and to release metal ions to combine with injected CO2.

Chelating agents are biomolecules that are able to dissolve metal ions; some are used to remove toxic metals, such as lead, mercury and cadmium, from the bodies of people suffering from their effects. Naturally occurring ones extract metal ions from minerals and rocks and are agents of chemical weathering; probably used by the aforesaid ants and root systems. Wang and colleagues, based at Tohoku University in Japan, chose a chelating agent GLDA (tetrasodium glutamate diacetate –  C9H9NNa4O8) derived from plants, which is non-toxic, cheap and biodegradable. They injected CO2 and seawater containing dissolved GDLA into basaltic rock samples. The GDLA increases the rock’s porosity and permeability by breaking down its minerals so that Ca and Mg ions entered solution and were thereby able to combine with the gas to form carbonate minerals. Within five days porosity was increased by 16% and the rocks permeability increased by 26 times. Using electron microscopy the authors were able to show fine particles of carbonate growing in the connected pores. In fact these carbonate aggregates become coated with silica released by the induced mineral-weathering reactions. Calculations based on the previously mentioned field experiment in Iceland suggest that up to 20 billion tonnes of CO2 could be stored in 1.3 km3 of basalt treated in this way: about 1/25000 of the active rift system in Iceland (3.3 x 10⁴ km2 covered by 1 km of basalt lava). In 2023 fossil fuel use emitted an estimated 36.6 bllion tons of CO2 into the atmosphere.

So, why do such means of efficiently reducing the greenhouse effect not receive wide publicity by governments or the Intergovernmental Panel on Climate Change? Answers on a yellow PostIt™ please . . .

The prospect of climate chaos following major volcano eruptions

It hardly needs saying that volcanoes present a major hazard to people living in close proximity. The inhabitants of the Roman cities of Herculaneum and Pompeii in the shadow of Vesuvius were snuffed out by an incandescent pyroclastic during the 79 CE eruption of the volcano. Since December 2023 long-lasting eruptions from the Sundhnúksgígar crater row on the Reykjanes Penisula of Iceland have driven the inhabitants of nearby Grindavík from their homes, but no injuries or fatalities have been reported. Far worse was the 1815 eruption of Tambora on Sumbawa, Indonesia, when at least 71,000 people perished. But that event had much wider consequences, which lasted into 1817 at least. As well as an ash cloud the huge plume from Tambora injected 28 million tons of sulfur dioxide into the stratosphere. In the form of sulfuric acid aerosols, this reflected so much solar energy back into space that the Northern Hemisphere cooled by 1° C, making 1816 ‘the year without a summer’. Crop failures in Europe and North America doubled grain prices, leading to widespread social unrest and economic depression. That year also saw unusual weather in India culminate in a cholera outbreak, which spread to unleash the 1817 global pandemic. Tambora is implicated in a global death toll in the tens of millions. Thanks to the record of sulfur in Greenland ice cores it has proved possible to link past volcanic action to historic famines and epidemics, such as the Plague of Justinian in 541 CE. If they emit large amounts of sulfur gases volcanic eruptions can result in sudden global climatic downturns.

The ash plume towering above Pinatubo volcano in the Philippines on 12 June 1991, which rose to 40 km (Credit: Karin Jackson U.S. Air Force)

With this in mind Markus Stoffel, Christophe Corona and Scott St. George of the University of Geneva, Switzerland, CNRS, Grenoble France and global insurance brokers WTW, London, respectively, have published a Comment in Nature warning of this kind of global hazard (Stoffel, M., Corona, C. & St. George, S. 2024.  The next massive volcano eruption will cause climate chaos — we are unprepared. Nature v. 635, p. 286-289; DOI: 10.1038/d41586-024-03680-z). The crux of their argument is that there has been nothing approaching the scale of Tambora for the last two centuries. The 1991 eruption of Pinatubo fed the stratosphere with just over a quarter of Tambora’s complement of SO2, and decreased global temperatures by around 0.6°C during 1991-2. Should one so-called Decade Volcanoes – those located in densely populated areas, such as Vesuvius – erupt within the next five years actuaries at Lloyd’s of London estimate economic impacts of US$ 3 trillion in the first year and US$1.5 trillion over the following years. But that is based on just the local risk of ash falls, lava and pyroclastic flows, mud slides and lateral collapse, not global climatic effects. So, a Tambora-sized or larger event is not countenanced by the world’s most famous insurance underwriter: probably because its economic impact is incalculable. Yet the chances of such a repeat certainly are conceivable. A 60 ka record of sulfate in the Greenland ice cores allows the probability of eruptions on the scale of Tambora to be estimated. The data suggest that there is a one-in-six chance that one will occur somewhere during the 21st century, but not necessarily at a site judged by volcanologists to be precarious . Nobody expected the eruption from the Pacific Ocean floor of the Hunga Tonga-Hunga Ha’apai volcano on January 15, 2022: the largest in the last 30 years.

The authors insist that climate-changing eruptions now need to be viewed in the context of anthropogenic global warming. Superficially, it might seem that a few volcanic winters and years without a summer could be a welcome, albeit short-term, solution. However, Stoffel, Corona and St. George suggest that the interaction of a volcano-induced global cooling with climatic processes would probably be very complex. Global warming heats the lower atmosphere and cools the stratosphere. Such steady changes will affect the height to which explosive volcanic plumes may reach. Atmospheric circulation patterns are changing dramatically as the weather of 2024 seems to show. The same may be said for ocean currents that are changing as sea-surface temperatures increase. Superimposing volcano-induced cooling of the sea surface adds an element of chaos to what is already worrying. What if a volcanic winter coincided with an el Niño event? The Intergovernmental Panel on Climate Change that projects climate changes is ‘flying blind’ as regards volcanic cooling. Another issue is that our knowledge of the effects in 1815 of Tambora concerned a very different world from ours: a global population then that was eight times smaller than now; very different patterns of agriculture and habitation; a world with industrial production on a tiny proportion of the continental surface. Stoffel, Corona and St. George urge the IPCC to shed light on this major blind spot. Climate modellers need to explore the truly worst-case scenarios since a massive volcanic eruption is bound to happen one day. Unlike global warming from greenhouse-gas emission, there is absolutely nothing that can be done to avert another Tambora.

A 9-day seismic reverberation set off by a giant tsunami in a Greenland fjord

In September 2023 the global network of seismic recorders detected a sequence of low-strength earth movements. It resembled the reverberation of a church bell albeit one that lasted for 9 days. rising and falling in strength every 90 seconds. For months this strange event on seismograms baffled geophysicists. All they could tell was that the signals did not show signs of having been generated by earthquakes; they were too regular. It was, however, possible to triangulate the position of the source of each individual event. There turned out to be only a single location for the seismic ‘campanology’ – at about 73° N on the eastern coast of Greenland, in Dickson Fjord and isolated branch of the enormous Kong Oscar Fjord system. Greenland is not noted for volcanic activity, ruling out the rumblings of a magma chamber that sometimes presages major eruptions. Whatever the cause, there were no human witnesses at the time. The only real clue lay at the start of the signal: the very long-period (VLP) signal was preceded by a sharp, high energy signal that could be matched with some kind of landslide.

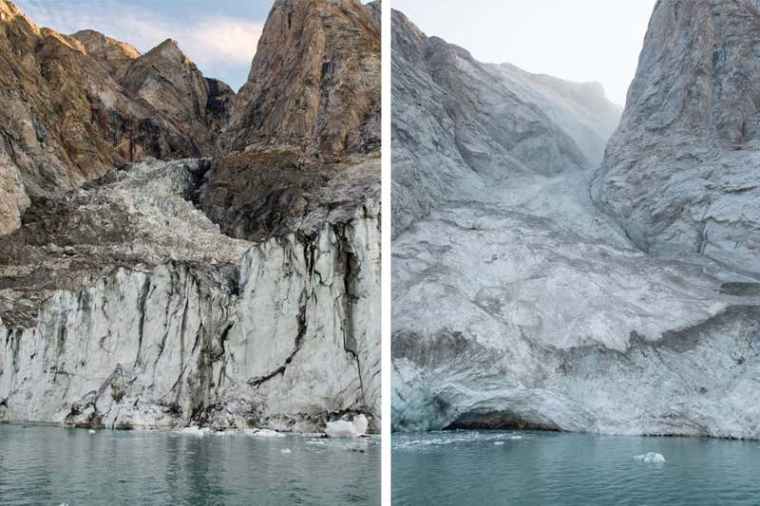
View of a side glacier on Dickson Fjord, East Greenland where the tsunami occurred. Left – August 2023; right – 19 September 2023. The rocky peak at top centre on the left fell onto the glacier below to generate a rock-ice slide into the fjord. (Credit: Søren Rysgaard/Danish Army)

On 16 September 2023 the military base for the famous Sirius Dog Sled Patrol on Ella Island was smashed by a tsunami – fortunately it had been closed for the coming winter. When the Danish Navy patrolled Dickson Fjord some days later they found clear signs that the shores opposite the site of a recent colossal rock and ice slide (see images) had been scoured to a height of 200 m. For 5 km either side shoreline scouring averaged 60 m. The initial tsunami was gigantic, yet the fjord was able to contain its worst effects because the outlet to the rest of the system was at right angles to its trend. Some energy obviously was released to reach Ella Island near the mouth of the system to destroy the Danish Army post. The bizarre seismic signal was probably a result of the displaced water sloshing around in the fjord to dissipate the enormous energy released by the collapse of a mountain peak and a substantial amount of a valley glacier. Such behaviour is known as a seiche. Topographic analysis of Dickson Fjord enabled the researchers to calculate its resonant frequency: at 11 millihertz it matched that of the fluctuating seismic signal. (Svennevig, K. and 67 others 2024. A rockslide-generated tsunami in a Greenland fjord rang Earth for 9 days. Science, v. 385, p. 1196-1205; DOI: 10.1126/science.adm9247).

Valley glaciers in Greenland bolster their rocky flanks against collapse. With climatic warming being much faster there than for the rest of the world, its almost innumerable valley glaciers are shrinking. Yet they have been eroding the crust for tens of thousand years. The fjords that they occupied at the height of the last glacial maximum have very steep sides. Likewise, the remaining glaciers have carved U-shaped valleys. So when the glaciers retreat their exposed flanks become gravitationally unstable. Despite the fact that much of Greenland is underpinned by very hard crystalline rocks, that presents a major hazard for water craft. East Greenland’s spectacular scenery draws many tourist cruisers and Innuit fishing boats each summer. Moreover, removal of the ice load allows elastic strain that had built up in the upper crust to be released along joint systems that further weaken resistance to collapse.

A great deal of publicity has been given to the rapid melting of the huge ice sheet that covers most of Greenland. That is currently the biggest contributor to sea-level rise: a few millimetres per year. The Dickson Fjord event highlights the potential deadly threat of deglaciation, although the extremely complex nature of most of its fjord systems may prevent regional tsunamis from escaping their damping effect. Bu there are increasing dangers from the largest, more open fjords, such as Scoresby Sund, which conceivably might blurt catastrophic tsunamis towards Iceland, Svalbard and the west coast of Norway. Even small ones could wreak havoc on wildlife, such as seal and walrus nurseries.

See also: Carrillo-Ponce, A. et al. 2024. The 16 September 2023 Greenland Megatsunami: Analysis and Modeling of the Source and a Week‐Long, Monochromatic Seismic Signal. The Seismic Record, v. 4, p. 172-183; DOI: 10.1785/0320240013; Le Page, M. 2024. Greenland landslide caused freak wave that shook Earth for nine days. New Scientist 12 September 2024

Earthquakes and flooding in the Ganges Basin

Floods pose a huge threat to the large populations of West Bengal, India and the state of Bangladesh, particularly in the highly fertile fluvio-deltaic plains of the Ganges and Brahmaputra. The two river systems drain 2 million km2 of the Eastern Himalaya of annual monsoon rains and snow melt, the first flowing west to east and the latter from east to west at the apex of the low-lying Bengal Basin. The 400 million people subsisting in the 105 thousand km2 onshore basin make it the world’s most populous delta plain with one of the highest population densities, averaging 1,100 per square kilometre in 2019. The risk of catastrophic flooding is generally ascribed to unusually high monsoonal precipitation and snow melt, combined with storm surges from the Bay of Bengal that funnels tropical cyclones. But either can bring inundation. Another factor has recently been proposed as an addition to flood hazard: earthquakes near the basin (Chamberlain, E.L and 12 others 2024. Cascading hazards of a major Bengal basin earthquake and abrupt avulsion of the Ganges River. Nature Communications, v. 15, online article 4975; DOI: 10.1038/s41467-024-47786-4). It seems they can completely and suddenly change the flow networks in such a complex system of major channels.

Using remotely sensed data Elizabeth Chamberlain, currently at Wageningen University in the Netherlands, and colleagues from Bangladesh, the US, Germany and Austria have detected an immense abandoned channel in the Ganges River. They reckon that it resulted from a sudden change in the river’s course. Such avulsions in the sluggish lower parts of a river system are generally caused by the flow becoming elevated above the flood plain by levees. When they burst free the channel may be abandoned. This one is 1.0 to 1.7 km wide and may have been the main Ganges channel at the time of avulsion. The main channel now flows about 45 km north of the abandoned relic. The event must have been sudden and irreversible as the relic channel contains a much thinner layer of fine mud deposited by stagnant water than in other abandoned channels that became ox-bow lakes. That implies rapid uplift and complete drainage from the channel. Throughout the Bengal Basin the immense high-water discharge and heavy sediment load seems generally to have infilled most abandoned channels, so this one is an anomaly.

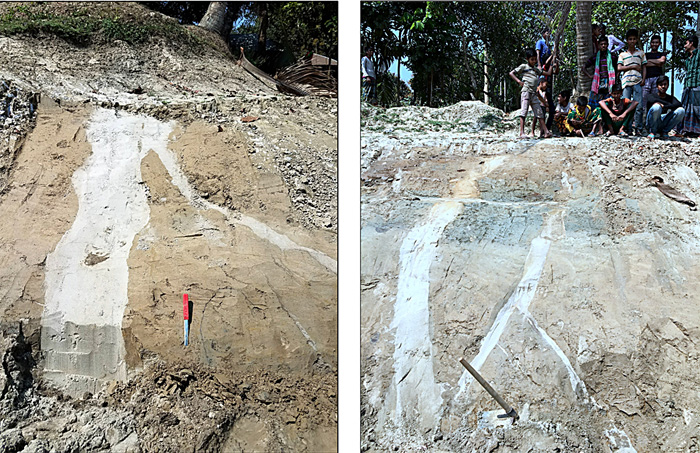
Sand dykes along fractures in river alluvium of the Bengal Basin. (Credit: Chamberlain et al. Figs 3c and 3d)

Fieldwork near the old channel reveals fracturing of earlier riverbed sediments some of which are filled by intrusions of sand in the form of dykes up to 40 cm wide. Sand dykes are produced by liquefaction of sandy alluvium by seismic waves to slurry that can be injected into fractures pulled apart by seismic movements. The channel is now about 3 m below the level of the floodplain, suggesting subsidence since the avulsion event. Optically stimulated luminescence dating of sediment grains from the uppermost channel sands yielded ages averaging around 2.5 ka, marking the time when the sudden event took place. The authors consider that it marked a major reorganisation of the Ganges River system, involving catastrophic flooding. The nearest seismically active area is about 180 to 300 km to the east and northeast. Seismic modelling suggests that for liquefaction and fracturing to have affected the area of the abandoned channel the earthquake must have been of magnitude 7.5–8.0, possibly in the subduction zone that roughly follows the Bangladesh-Myanmar border. It may have had similar, yet to be demonstrated, effects throughout the eastern Bengal Basin.

There are no historic records of more recent massive earthquake-induced flooding of the Bengal Basin. However, global warming and growing human intervention in the Ganges-Brahmaputra river systems, such as large-scale dredging and industrialisation could make such events more likely. Other basins close to seismically active fault systems, such as the Yangtze and Yellow River basins of China, also face such risks.

Many thanks to  Piso Mojado for giving me the tip about this paper

How did African humans survive the 74 ka Toba volcanic supereruption?

The largest volcanic eruption during the 2.5 million year evolution of the genius Homo, about 74 thousand years (ka) ago, formed a huge caldera in Sumatra, now filled by Lake Toba. A series of explosions lasting just 9 to 14 days was forceful enough to blast between 2,800 to 6,000 km3 of rocky debris from the crust. An estimated 800 km3 was in the form of fine volcanic ash that blanketed South Asia to a depth of 15 cm. Thin ash layers containing shards of glass from Toba occur in marine sediments beneath the Indian Ocean, the Arabian and South China Seas. Some occur as far off as sediments on the floor of Lake Malawi in southern Africa. A ‘spike’ of sulfates is present at around 74 ka in a Greenland ice core too. Stratospheric fine dust and sulfate aerosols from Toba probably caused global cooling of up to 3.5 °C over a modelled 5 years following the eruption. To make matters worse, this severe ‘volcanic winter’ occurred during a climatic transition from warm to cold caused by changes in ocean circulation and falling atmospheric CO2 concentration, known as a Dansgaard-Oeschger event.

There had been short-lived migrations of modern humans out of Africa into the Levant since about 185 ka. However, studies of the mitochondrial DNA (mtDNA) of living humans in Eurasia and Australasia suggest that permanent migration began about 60 ka ago. Another outcome of the mtDNA analysis is that the genetic diversity of living humans is surprisingly low. This suggests that human genetic diversity may have been sharply reduced globally roughly around the time of the  Toba eruption. This implies a population bottleneck with the number of humans alive at the time to the order of a few tens of thousands (see also: Toba ash and calibrating the Pleistocene record; December 2012). Could such a major genetic ‘pruning’ have happened in Africa? Over six field seasons, a large team of geoscientists and archaeologists drawn from the USA, Ethiopia, China, France and South Africa have excavated a rich Palaeolithic site in the valley of the Shinfa River, a tributary of the Blue Nile in western Ethiopia. Microscopic studies of the sediments enclosing the site yielded glass shards whose chemistry closely matches those in Toba ash, thereby providing an extremely precise date for the human occupation of the site: during the Toba eruption itself (Kappelman, Y. and 63 others 2024. Adaptive foraging behaviours in the Horn of Africa during Toba supereruption. Nature, v. 627; DOI: 10.1038/s41586-024-07208-3).

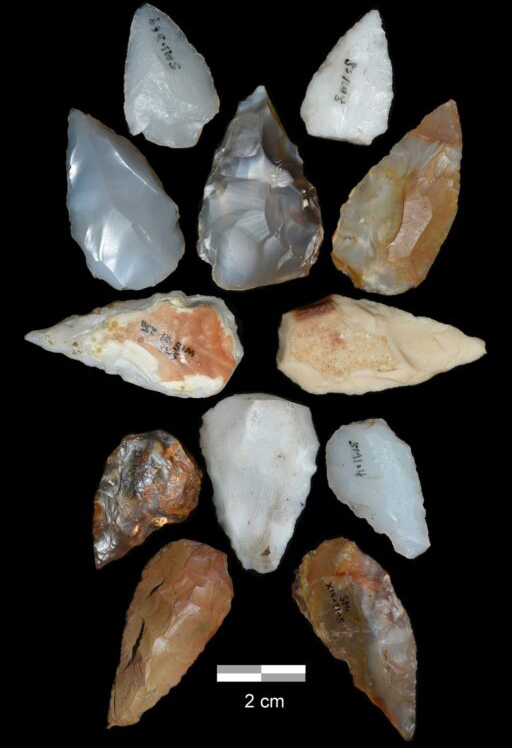
Selection of possible arrowheads from the Shinfa River site (Credit: Kappelman et al.; Blue Nile Survey Project)

The artifacts and bones of what these modern humans ate suggest a remarkable scenario for how they lived. Stone tools are finely worked from local basalt lava, quartz and flint-like chalcedony found in cavities in lava flows. Many of them are small, sharp triangular points, some of which show features consistent with their use as projectile tips that fractured on impact; they may be arrowheads, indeed the earliest known. Bones found at the site are key pointers to their diet. They are from a wide variety of animal, roughly similar to those living in the area at present: from monkeys to giraffe, guinea fowl to ostrich, and even frogs. There are remains of many fish and freshwater molluscs. Although there are no traces of plant foods, clearly those people who loved through the distant effects of Toba were well fed. Although a period of global cooling may have increased aridity at tropical latitudes in Africa, the campers were able to devise efficient strategies to obtain victuals. During wet seasons they lived off terrestrial prey animals, and during the driest times ate fish from pools in the river valley. These are hardly conditions likely to devastate their numbers, and the people seem to have been technologically flexible. Similar observations were made at the Pinnacle Point site in far-off South Africa in 2018, where Toba ash is also present. Both sites refute any retardation of human cultural progress 74 ka ago. Rather the opposite: people may have been spurred to innovation, and the new strategies may have allowed them to migrate more efficiently, perhaps along seasonal drainages. In this case that would have led them or their descendants to the Nile and a direct route to Eurasia; along ‘blue highway’ corridors as Kappelman et al. suggest.

Yet the population bottleneck implied by mtDNA analyses is only vaguely dated: it may have been well before or well after Toba. Moreover, there is a 10 ka gap between Toba and the earliest accurately dated migrants who left Africa – the first Australians at about 65 ka. However, note that there is inconclusive evidence that modern humans may have occupied Sumatra by the time of the eruption.  Much closer to the site of the eruption in southeast India, stone artifacts have been found below and above the 74 ka datum marked by the thick Toba Ash. Whether these were discarded by anatomically modern humans or earlier migrants such as Homo erectus remains unresolved. Either way, at that site there is no evidence for any mass die-off, even though conditions must have been pretty dreadful while the ash fell. But that probably only lasted for little more than a month. If the migrants did suffer very high losses to decrease the genetic diversity of the survivors, it seems just as likely to have been due to attrition on an extremely lengthy trek, with little likelihood of tangible evidence surviving. Alternatively, the out-of-Africa migrants may have been small in number and not fully representative of the genetic richness of the Africans who stayed put: a few tens of thousand migrants may not have been very diverse from the outset.

The ‘Anthropocene Epoch’ bites the dust?

The International Commission on Stratigraphy (ICS) issues guidance for the division of geological history that has evolved from the science’s original approach: that was based solely on what could be seen in the field. That included: variations in lithology and the law of superposition; unconformities that mark interruptions through deformation, erosion and renewed deposition; the fossil content of sediments and the law of faunal succession; and more modern means of division, such as geomagnetic changes detected in rock over time. That ‘traditional’ approach to relative time is now termed chronostratigraphy, which has evolved since the 19th century from the local to the global scale as geological research widened its approach. Subsequent development of various kinds of dating has made it possible to suggest the actual, absolute time in the past when various stratigraphic boundaries formed – geochronology. Understandably, both are limited by the incompleteness of the geological record – and the whims of individual geologists. For decades the ICS has been developing a combination of both approaches that directly correlates stratigraphic units and boundaries with accurate geochronological ages. This is revised periodically, the ICS having a detailed protocol for making changes.  You can view the Cenozoic section of the latest version of the International Chronostratigraphic Chart and the two systems of units below. If you are prepared to travel to a lot of very remote places you can see a monument – in some cases an actual Golden Spike – marking the agreed stratigraphic boundary at the ICS-designated type section for 80 of the 93 lower boundaries of every Stage/Age in the Phanerozoic Eon. Each is a sonorously named Global Boundary Stratotype Section and Point or GSSP (see: The Time Lords of Geology, April 2013). There are delegates to various subcommissions and working groups of the ICS from every continent, they are very busy and subject to a mass of regulations

Chronostratigraphic Chart for the Cenozoic Era showing the 5 tiers of stratigraphic time division. The little golden spikes mark where a Global Boundary Stratotype Section and Point monument has been erected at the boundary’s type section.

On 11 May 2011, the Geological Society of London hosted a conference, co-sponsored by the British Geological Survey, to discuss evidence for the dawn of a new geological Epoch: the Anthropocene, supposedly marking the impact of humans on Earth processes. There has been ‘lively debate’ about whether or not such a designation should be adopted. An Epoch is at the 4th tier of the chronostratigraphic/geochronologic systems of division, such as the Holocene, Pleistocene, Pliocene and Miocene, let alone a whole host of such entities throughout the Phanerozoic, all of which represent many orders of magnitude longer spans of time and a vast range of geological events. No currently agreed Epoch lasted less than 11.7 thousand years (the Holocene) and all the others spanned 1 Ma to tens of Ma (averaged at 14.2 Ma). Indeed, even geological Ages (the 5th tier) span a range from hundreds of thousands to millions of years (averaged at 6 Ma). Use ‘Anthropocene’ in Search Earth-logs to read posts that I have written on this proposal since 2011, which outline the various arguments for and against it.

In the third week of May 2019 the 34-member Anthropocene Working Group (AWG) of the ICS convened to decide on when the Anthropocene actually started. The year 1952 was proposed – the date when long-lived radioactive plutonium first appears in sediments before the 1962 International Nuclear Test-Ban Treaty. Incidentally, the AWG proposed a GSSP for the base of the Anthropocene in a sediment core through sediments in the bed of Crawford Lake an hour’s drive west of Toronto, Canada.   After 1952 there are also clear signs that plastics, aluminium, artificial fertilisers, concrete and lead from petrol began to increase in sediments. The AWG accepted this start date (the Anthropocene ‘golden spike’) by a 29 to 5 vote, and passed it into the vertical ICS chain of decision making. This procedure reached a climax on Monday 4 March 2024, at a meeting of the international Subcommission on Quaternary Stratigraphy (SQS): part of the ICS. After a month-long voting period, the SQS announced a 12 to 4 decision to reject the proposal to formally declare the Anthropocene as a new Epoch. Normally, there can be no appeals for a losing vote taken at this level, although a similar proposal may be resubmitted for consideration after a 10 year ‘cooling off’ period. Despite the decisive vote, however, the chair of the SQS, palaeontologist Jan Zalasiewicz of the University of Leicester, UK, and one of the group’s vice-chairs, stratigrapher Martin Head of Brock University, Canada have called for it to be annulled, alleging procedural irregularities with the lengthy voting procedure.

Had the vote gone the other way, it would marked the end of the Holocene, the Epoch when humans moved from foraging to the spread of agriculture, then the ages of metals and ultimately civilisation and written history. Even the Quaternary Period seemed under threat: the 2.5 Ma through which the genus Homo emerged from the hominin line and evolvd. Yet a pro-Anthropocene vote would have faced two more, perhaps even more difficult hurdles: a ratification vote by the full ICS, and a final one in August 2024 at a forum of the International Union of Geological Sciences (IUGS), the overarching body that represents all aspects of geology.  

There can be little doubt that the variety and growth of human interferences in the natural world since the Industrial Revolution poses frightening threats to civilisation and economy. But what they constitute is really a cultural or anthropological issue, rather than one suited to geological debate. The term Anthropocene has become a matter of propaganda for all manner of environmental groups, with which I personally have no problem. My guess is that there will be a compromise. There seems no harm either way in designating the Anthropocene informally as a geological Event. It would be in suitably awesome company with the Permian and Cretaceous mass extinctions, the Great Oxygenation Event at the start of the Proterozoic, the Snowball Earth events and the Palaeocene–Eocene Thermal Maximum. And it would require neither special pleading nor annoying the majority of geologists. But I believe it needs another name. The assault on the outer Earth has not been inflicted by the vast majority of humans, but by a tiny minority who wield power for profit and relentless growth in production. The ‘Plutocracene’ might be more fitting. Other suggestions are welcome …

See also: Witze, A. 2024. Geologists reject the Anthropocene as Earth’s new epoch — after 15 years of debate. Nature, v. 627, News article; DOI: 10.1038/d41586-024-00675-8; Voosen, P. 2024. The Anthropocene is dead. Long live the Anthropocene. Science, v. 383, News article, 5 March 2024.

 Using lasers to map landslide risk

As radar stands for radio detection and ranging, so lidar signifies light detection and ranging. In one respect the two are related: they are both active means of remote sensing and illuminate the surface, rather than passively monitoring solar radiation reflected from the surface or thermal radiation emitted by it. The theory and practice of imaging radar that beams microwaves at a surface and analyses the returning radiation are fiendishly complex. For a start microwave beams are directed at an angle towards the surface. Lidar is far simpler being based on an aircraft -mounted laser that sends pulses vertically downwards and records the time taken for them to be reflected from the surface back to the aircraft. The method measures the distance from aircraft to the ground surface and thus its topographic elevation. Lidar transmits about 100 thousand pulses per, so the resulting digital elevation model has remarkably good spatial resolution (down to 25 cm) and can measure surface elevation to the nearest centimetre. The technique is becoming popular: the whole of England and much of the nations of Scotland, Wales and Northern Ireland now have lidar coverage with 1 metre resolution.

The first thing the laser pulses encounter is the vegetation canopy, from which some are reflected back to the instrument. Others penetrate gaps in the canopy, to be reflected by the ground surface, so they take slightly longer to return. If the penetrating pulses are digitally separated from those reflected by vegetation, they directly map the elevation of the solid ground surface or the terrain. These data produce a  digital terrain model (DTM) whereas the more quickly returning pulses map the height and structure of the ground cover, if there is any. Both products are useful, the first to map topographic and geological features, the details of which are hidden to conventional remote sensing, the second to assess vegetation. The great advantage of a DTM is that image processing software can simulate illumination and shading of the terrain from different directions and angles to improve interpretation. Aerial photography has but a single direction and angle of solar illumination, depending on the time of day, the season and the area’s latitude. Stereoscopic viewing of overlapping photographic images does yield topographic elevation, and photogrammetric analysis produces a digital elevation model, but its usefulness is often compromised  by ground cover in vegetated terrain and by shadows. Also its vertical resolution is rarely better than 1 m. Another factor that limits terrain analysis using aerial photographs and digital images from satellites is the ‘patchwork-quilt’ appearance of farmed land that results from sharp boundaries between fields that contain different crops, bare ploughed soil and grassland. Together with spatial variation of natural vegetation, both ‘camouflage’ physical features of the landscape.

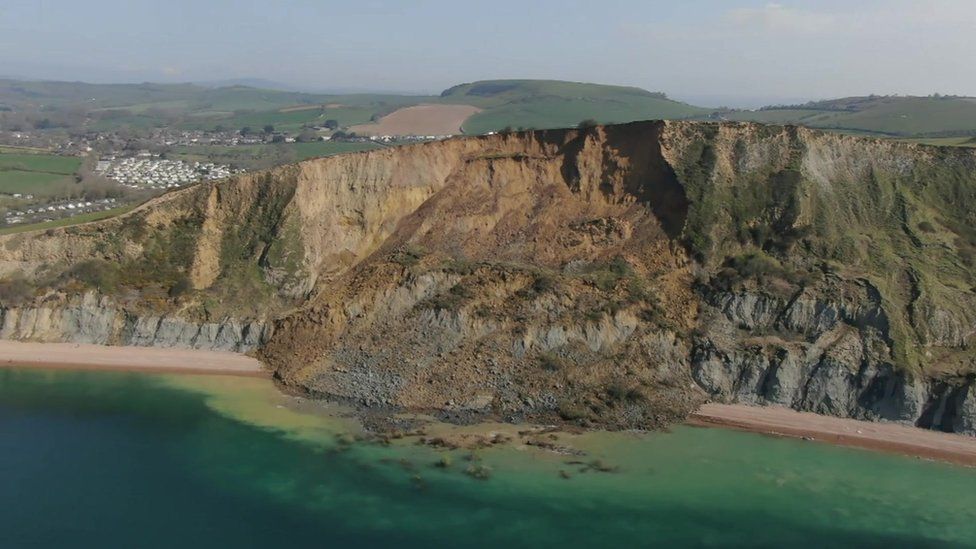
A cliff collapse in July 2023 at Seatown, Dorset England

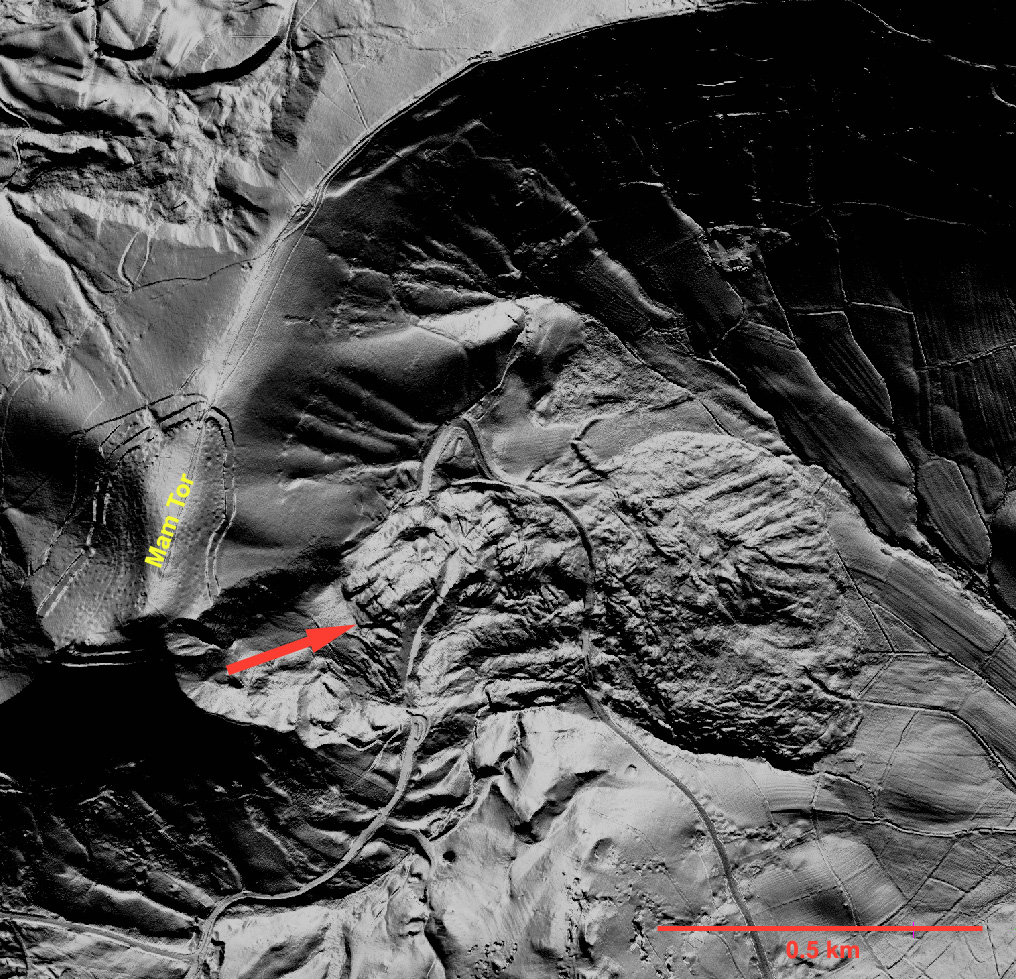
In the field, areas of what is known as ‘mass wasting’, such as landslides, landslips, rockfalls, debris flows and solifluction, show topographic features that are characteristic of the processes involved.  They can be mapped by careful geological surveys. But are overlooked, being masked by vegetation cover such as woodland or because slower downslope movement of soil has smoothed out their original landforms. Potentially devastating mass wasting is encouraged by increased moisture content of soils and rocks that lie beneath steep slopes. Moisture provides lubrication that gravitational forces can exploit to result in sudden disruption of slopes and the movement of huge masses of Earth materials. Large areas of upland Britain show evidence of having experienced such mass wasting in the past. Some continue to move, such as that in the Derbyshire Peak District on the slopes of Mam Tor, as do cases on rugged parts of Britain’s coast where underlying rocks are weak and coastal erosion is intense (see image above).

It is thought that many of the mass-wasting features in Britain were initiated at the start of the Holocene. Prior to that, during the Younger Dryas cooling event, near-surface Earth materials were gripped solid by permafrost. Sudden warming at about 11.7 ka ago melted deeply frozen ground to create ideal conditions for mass wasting. In the last eleven thousand years the surface has come to a more or less stable gravitational balance. Yet heavy, sustained rainfall may reactivate some of the structures or trigger new ones. The likelihood of increased annual rainfall as the climate warms will undoubtedly increase the risk of more and larger instances of mass wasting. Indeed such an acceleration is happening now.

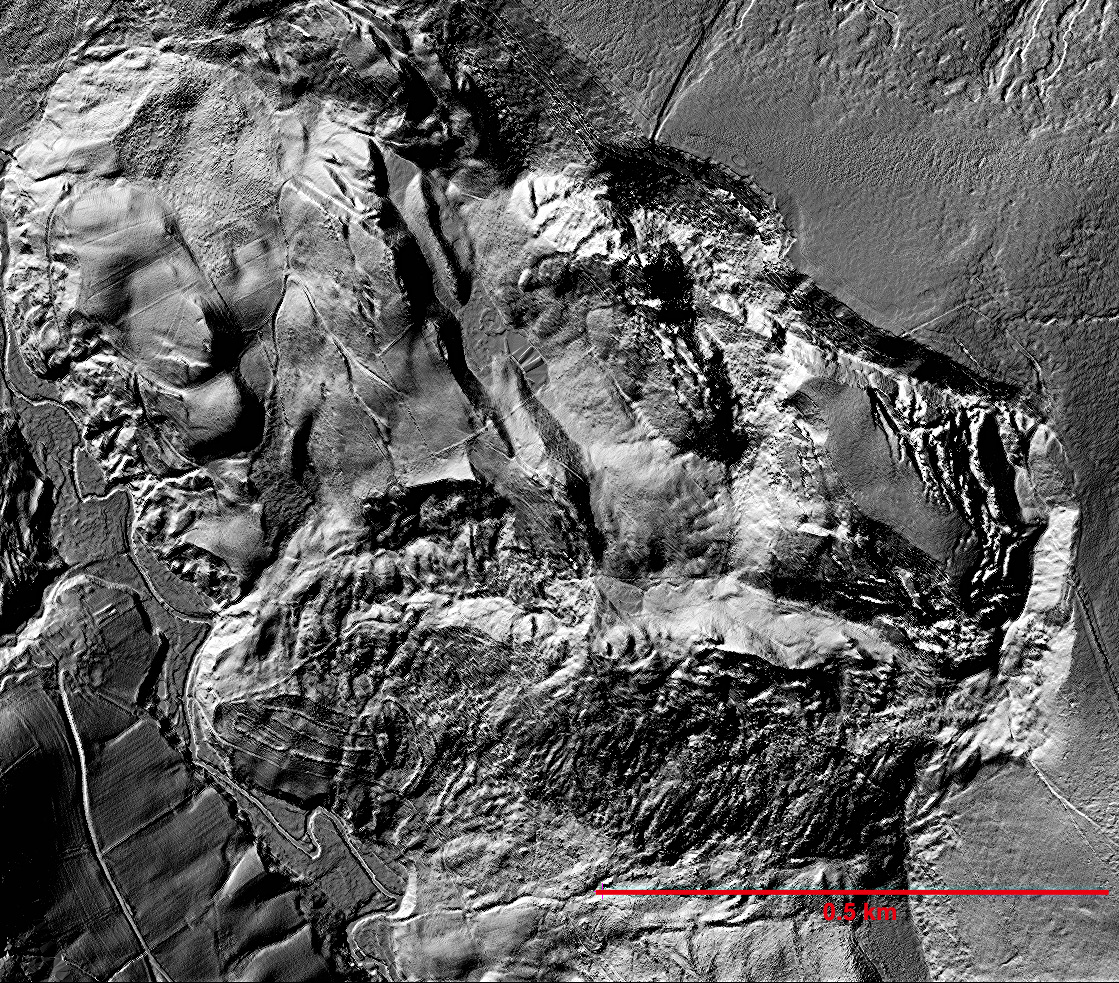
The most risky places are those with a history of landslides etc. So detailed mapping of such risk-prone ground is clearly needed. The UK has a large number of sites where mass wasting has been recorded, and below are lidar images of three of the most spectacular. Undoubtedly, there are other areas where no recent movements have been recorded, but which may ‘go off’ under changed climatic conditions. One of the best documented risky areas is in the English West Midlands within the new city of Telford. It follows the flanks of the River Severn as it passes through the Ironbridge Gorge that was cut by subglacial meltwater after the last glacial maximum. This area is also recognised as having been the birthplace of the Industrial Revolution. In 1714 Abraham Darby pioneered the use of coke in iron smelting and mass production of cast iron at Coalbrookdale a few kilometres to the east. The Severn also powered numerous forges and other heavy industries in the 18th and 19th centuries.  Industrial activity and townships in the Gorge have been plagued by large-scale mass wasting throughout subsequent history and no doubt long before. An excellent illustrated guide to the area has been produced by the Shropshire Geological Society (Rayner, C. et al. 2007. A Geological Trail through the landslides of Ironbridge Gorge, Proceedings of the Shropshire Geological Society, v. 12, p. 39-52; ISSN 1750-8568)

Lidar DTM illuminated from the west for the Severn Gorge near Ironbridge, Telford, Shropshire, UK. Lips of four major landslides shown by ‘No Entry’ signs. Initiated at the beginning of the Holocene, they continue to be active to this day, the southernmost slide having obliterated a tile factory and workers’ dwellings at Jackfield in 1952
Lidar DTM illuminated from the NW for the Alport Valley in the Peak District of North Derbyshire, UK. This includes the largest landslide complex in England, known as Alport Castles from the huge displaced sandstone blocks in the area of mass wasting.
An active landslide near Castleton, Derbyshire, UK. Note the defences of an Iron Age hillfort on Mam Tor that have been cut as the head of the landslide retreated westwards, as have medieval field walls. The relics of a major road that has been repeatedly disrupted and then destroyed following decades of maintenance can also be seen in the debris flow: it was abandoned in the 1970s.

Water in unexpected places. 1: Atmosphere

As a liquid, solid or in gaseous form water is everywhere in the human environment: even in the driest deserts it rains at some time and they may become tangibly humid. Water vapour moves most quickly in the atmosphere because of continual circulation. But 99% of all the Earth’s gaseous water resides in the lowest part, the troposphere. In that layer temperature decreases upwards to around -70°C, reflected by the lapse rate, so that water vapour condenses out as liquid or ice at low altitudes in the tangible form of clouds. So as altitude increases the air becomes increasingly cold and dry until it reaches what is termed the tropopause, the boundary between the troposphere and the stratosphere. This lies at altitudes between 6 km at the poles and 18 km in the tropics. Higher still, counter intuitively, the stratospheric air temperature rises. This is due to the production of ozone (O3) as oxygen (O2) interacts with UV radiation. Ozone absorbs UV thereby heating the thin stratospheric air. The tropopause is therefore an efficient ‘cold trap’ for water vapour, thereby preventing Earth from losing its surface water. Any that does pass through rises to the outer stratosphere where solar radiation dissociates it into oxygen and hydrogen, the latter escaping to space. So for most of the time the stratosphere is effectively free of water.

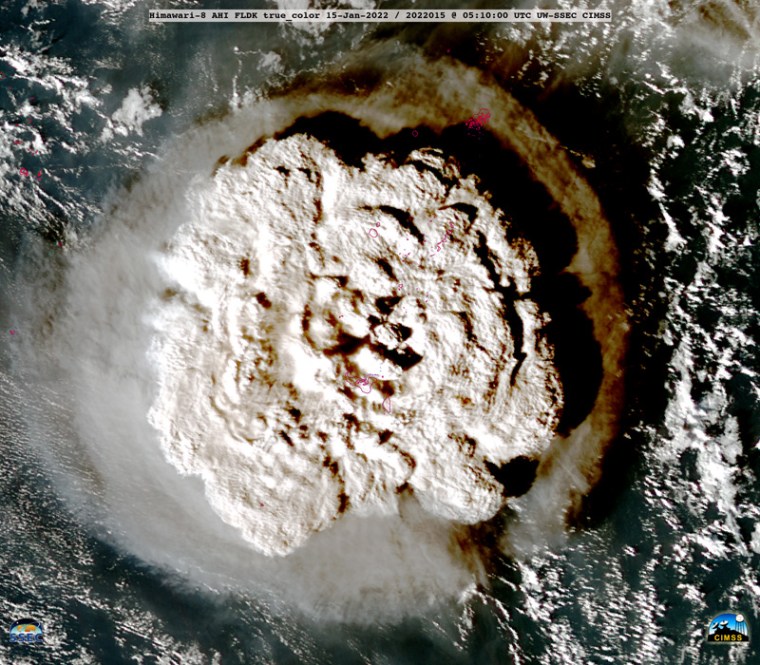
57 km high eruption plume and surrounding shock wave of Hunga Tonga-Hunga Ha’apai volcano one hour after explosion began on 15 January 2022: from the Himawari-8 satellite. The image is about 350 km across. Islands in red, the main island of Tonga being slightly to the south of the centre.

On 14 to 15 January 2022 the formerly shallow submarine Hunga Tonga-Hunga Ha’apai volcano in the Tonga archipelago of the South Pacific underwent an enormous explosive eruption (see an animation of the event captured by the Japanese weather satellite Himawari-8). The explosion was the largest in the atmosphere ever recorded by modern instruments, dwarfing even nuclear bomb tests, and the most powerful witnessed since that of Krakatoa in 1883. But, as regards global media coverage, it was a one-trick pony, trending for only a few days. It did launch tsunami waves that spanned the whole of the Pacific Ocean, but resulted in only 6 fatalities and 19 people injured. However, Hunga Tonga-Hunga Ha’apai managed to punch through the tropopause and in doing so, it changed the chemistry and dynamics of the stratosphere during the following year. A group of researchers from Harvard University and the University of Maryland used data from NASA’s Aura satellite to investigate changes in stratigraphic chemistry after the eruption (Wilmouth, D.M. et al. 2023. Impact of the Hunga Tonga volcanic eruption on stratospheric composition. Proceedings of the National Academy of Sciences, v. 120, article e23019941; DOI: 10.1073/pnas.2301994120). The Microwave Limb Sounder (MLS) carried by Aura measures thermal radiation emitted in the microwave region from the edge of the atmosphere, as revealed by Earth’s limb – seen at the horizon from a satellite. Microwave spectra from 0.12 to 2.5 mm in wavelength enable the concentrations of a variety of gases present in the atmosphere to be estimated along with temperature and pressure over a range of altitudes.

The team used MLS data for the months of February, April, September and December following the eruption to investigate its effects on the stratosphere n from 30°N to the South Pole. These data were compared with the averages over the previous 17 years. What emerged was a highly anomalous increase in the amount of water vapour between 0 and 30°S (the latitude band that includes the volcano) beginning in February 2022 and persisting until December 2023, the last dates of measurements. By April the peak showed up and persisted north of the Equator and at mid latitudes of the Southern Hemisphere and by December over Antarctica. It may well be present still. The estimated mass of water vapour that the eruption jetted into the stratosphere was of the order of 145 million tons along with about 0.4 million tons of SO2, the excess water helping accelerate the formation of highly reflective sulfate aerosols. Associated chemical changes were decreases in ozone (~ -14%) and HCl (~ -22%) and increases in ClO (>100%) and HNO3 (43%). Hunga Tonga-Hunga Ha’apai therefore changed the stratosphere’s chemistry and a variety of chemical reactions. As regards the resulting physical changes, extra water vapour together with additional sulfate aerosols should have had a cooling effect, leading to changes in its circulation with associated decrease in ozone in the Southern Hemisphere and increased ozone in the tropics. Up to now, the research has not attempted to match the chemical changes with climatic variations. The smaller 15 June 1991 eruption of Mount Pinatubo on the Philippine island of Luzon predated the possibility of detailed analysis of its chemical effects on the stratosphere. Nevertheless the material that is injected above the tropopause resulted in a global ‘volcanic winter’, and a ‘summer that wasn’t’ in the following year. The amount of sunlight reaching the surface fell by up to 10%, giving a 0.4 decrease in global mean temperature. Yet there seem to have been no media stories about such climate disruption in the aftermath of Hunga Tonga-Hunga Ha’apai. That is possibly because the most likely effect is a pulse of global warming in the midst of general alarm about greenhouse emissions, the climatically disruptive effect of the 2023 El Niño and record Northern Hemisphere temperature highs in the summer of 2023. Volcanic effects may be hidden in the welter of worrying data about anthropogenic global climate change.   David Wilmouth and colleagues hope to follow through with data from 2023 and beyond to track the movement of the anomalies, which are expected to persist for several more years. Their research is the first of its kind, so quite what its significance will be is hard to judge.

Aftershocks of ancient earthquakes

Any major earthquake is likely to be followed by aftershocks. Survivors of seismic devastation live in dread of them for weeks, even months. In reality the fault responsible for the initial event continues to move for longer than that. Commonly, aftershock activity dies down in magnitude and frequency over time, sometimes after a few weeks and in other cases much later to reach ‘normal background seismicity’ for the associated tectonic setting. Near a major plate boundary, such as the San Andreas Fault system in coastal California or the mid-Atlantic Ridge in Iceland, there is a continual risk of damaging seismic events, but the area around each major event becomes less risky a few tens of years afterwards. For instance, the Loma Prieta area on the San Andreas became quiescent sixteen years after the October 1989 Magnitude 6.9 earthquake that wrought havoc in San Francisco – and interrupted a Major League baseball match in the city. The December 1954, Magnitude 7.3 Dixie Valley earthquake in the active extensional zone of Nevada had a longer period of instability: 48 years. There is no fixed period for the aftermath, seismicity ‘stops when it stops’.

Earthquakes of greater than Magnitude 2.5 in eastern North America (see key to magnitudes at lower right). Those shown in blue date from 1568 to 1979, those in red between 1980 and 2016. (Credit: Chen & Liu, Fig 1)
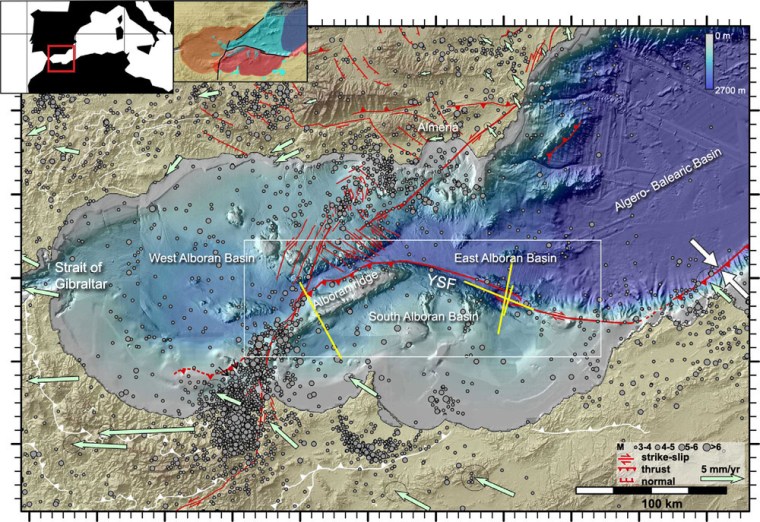
Sometimes devastating earthquakes take place in what seem to be the least likely places: in tectonically ‘stable’ continental plate interiors. A Magnitude 7.9 earthquake in Sichuan Province, central China on 12 May 2008 left 86 thousand dead or missing, 374 thousand injured and 4.2 million homeless. It occurred in a region whose ancient fault systems had had little if any historic activity. One of the best studied records of seismic events in the middle of a continent is in the Mississippi River valley at the Missouri-Kentucky border, USA, near the town of New Madrid. This experienced three major earthquakes in 1811 and 1812 at Magnitudes estimated from 7.0 to 7.4. Seismicity there has continued ever since. Others that occurred long ago in the ‘stable’  North American continental crust were in South Carolina (1886) and southern Quebec, Canada (1663). They and the subsequent, lesser earthquakes that define clusters up to 250 km around them have been studied using spatial statistics (Chen, Y. & Liu, M. 2023. Long-Lived Aftershocks in the New Madrid seismic Zone and the Rest of Stable North America. Journal of Geophysics Research: Solid Earth, v. 128; DOI: 10.1029/2023JB026482). Yuxuan Chen and Mian Lui of Wuhan University, China and the University of Missouri, USA considered the dates of historic events, their estimated magnitudes and their proximity to other events in each cluster. The closer two events are the greater the chance that the later one is an aftershock of the first, although the relationship may also indicate a long-lived deformation process responsible for both. The authors suggest that this ‘nearest-neighbour’ approach may reveal that up to 65% of earthquakes in the New Madrid zone between 1980 and 2016 are aftershocks of the 1811-1812 major earthquake cluster, and a significant number of modern events in South Carolina could similarly relate to the 1886 Charleston earthquake. On the other hand, small modern earthquakes in Quebec are more likely to be part of the regional seismic background than to have any relationship to the large 17th century event.

Earthquakes are manifestations of deep-seated processes, most usually the build-up and release of strain in the lithosphere. If such processes persist they can result in long-lived earthquake swarms. So both delayed aftershocks and a high background of seismicity can contribute to the mapped clusters of historic events: a blend of relics of the past and modern deformation. They are yet to be detected in earthquake records associated with tectonic plate boundaries. A long history of movements within continents suggests that it is possible that long-delayed aftershocks may masquerade as foreshocks that presage greater events that are pending. Chen and Liu’s nearest-neighbour approach may therefore distinguish false alarms from real risk of major seismic motions.

See also: Some of today’s earthquakes may be aftershocks from quakes in the 1800s. Eureka|Alert, 13 November 2023

Flash: Huge rockslide imminent in Swiss village of Brienz

The rockslide above Brienz in eastern Switzerland marked by a white surface bare of vegetation. Credit CHRISTOPH NÄNNI, TIEFBAUAMT GR, SWITZERLAND via the BBC

On 9 May 2023 the authorities of the Albula/Alvra municipality in the Swiss canton of Graubünden informed people living in the small village of Brienz that they must evacuate the area by 18 May as the threat of rock falls from the mountain beneath which they live had triggered a red alert. By 13 May all 130 dwellings had been abandoned.

The danger is posed by an estimated 5 million tons of rock associated with a developing landslide that is now estimated to be moving at around 32 m per year. The village itself had long been creeping down slope at a few centimetres each year, but recently its church spire had begun to tilt and buildings became riven by cracks. Seemingly, engineering attempts to mitigate the hazards have been unsuccessful, and large boulders have already tumbled into the vicinity of Brienz.

Being situated beneath a crumbling scree slope devoid of vegetation that had been developing since the last glaciation, the geological risk to the village comes as no surprise to its population and local authority. The local geology has a thick limestone resting on the thinly bedded Flysch – a metamorphosed sequence of fine-grained turbidites – from which groundwater escapes very slowly, thereby becoming lubricated. A curved (listric) failure zone has developed beneath the exposed mountainside, hence the danger. Acceleration on the listric surface began about 20 years ago.

At least the people of Brienz have been moved to safety, unlike 144 school children and adults in the mining village of Aberfan in South Wales. On 21 October 1966 they were crushed to death by coal-mining waste that suddenly flowed from waste tips on the steep valley side above the village. In that case no warning was given by the National Coal Board authorities who allowed  the tipping witout a thought for its geological consequences.

See also: Petley, D. 2023. The very large incipient rockslide at Brienz in Switzerland. The Landslide Blog (10 May 2023)

British government fracking fan fracked

In November 2019 the Conservative government of Boris Johnson declared a moratorium on development of shale gas by hydraulic fracturing (‘fracking’) in England. This followed determined public protests at a number of potential fracking sites, the most intransigent being residents of Lancashire’s Fylde peninsula. They had been repeatedly disturbed since mid 2017 by low-magnitude earthquakes following drilling and hydraulic-fluid injection tests by Cuadrilla Resources near Little Plumpton village. Their views were confirmed in a scientific study by the British Geological Survey for the Oil and Gas Authority that warned of the impossibility of predicting the magnitude of future earthquakes that future fracking might trigger. The shale-gas industry of North America, largely in areas of low population and simple geology, confirmed the substantial seismic hazard of this technology by regular occurrences of earthquakes up to destructive magnitudes greater than 5.0. The Little Plumpton site was abandoned and sealed in February 2022.

Cuadrilla’s exploratory fracking site near Little Plumpton in Fylde, Lancashire. (Credit: BBC)

On 22 September 2022 the moratorium was rescinded by Jacob Rees-Mogg, Secretary of State for Business, Energy and Industrial Strategy in the new government of Liz Truss, two weeks after his appointment. This was despite the 2019 Conservative manifesto pledging not to lift the moratorium unless fracking was scientifically proven to be safe. His decision involved suggesting that the seismicity threshold for pausing fracking operations be lifted from magnitude 0.5 to 2.5, which Rees-Mogg claimed without any scientific justification to be ‘a perfectly routine natural phenomenon’.  He further asserted that opposition to fracking was based around ‘hysteria’ and public ignorance of seismological science, and that some protestors had been funded by Vladimir Putin. In reality the Secretary of State’s decision was fuelled by the Russian Federation’s reducing gas supplies to Europe following its invasion of Ukraine, the soaring world price of natural gas and an attendant financial crisis. There was also a political need to be seen to be ‘doing something’, for which he has a meagre track record in the House of Commons. Rees Mogg claimed that lifting the moratorium would bolster British energy security. That view ignored the probable lead time of around 10 years before shale gas can become an established physical resource in England. Furthermore, an August 2018 assessment of the potential of UK shale-gas, by a team of geoscientists, including one from the British Geological Survey, suggested that shale-gas potential would amount to less than 10 years supply of UK needs: contrary to Rees-Mogg’s claim that England has ‘huge reserves of shale’. Indeed it does, but the vast bulk of these shales have no commercial gas potential.

Ironically, the former founder of Cuadrilla Resources, exploration geologist Chris Cornelius, and its former public affairs director, Mark Linder, questioned the move to unleash fracking in England, despite supporting shale-gas operations where geologically and economically appropriate. Their view is largely based on Britain’s highly complex geology that poses major technical and economic challenges to hydraulic fracturing. Globally, fracking has mainly been in vast areas of simple, ‘layer-cake’ geology. A glance at large-scale geological maps of British areas claimed to host shale-gas reserves reveals the dominance of hundreds of faults, large and small, formed since the hydrocarbon-rich shales were laid down. Despite being ancient, such faults are capable of being reactivated, especially when lubricated by introduction of fluids. Exactly where they go beneath the surface is unpredictable on the scales needed for precision drilling.  Many of the problems encountered by Cuadrilla’s Fylde programme stemmed from such complexity. Over their 7 years of operation, hundreds of millions of pounds were expended without any commercial gas production. Each prospective site in Britain is similarly compartmentalised by faulting so that much the same problems would be encountered during attempts to develop them. By contrast the shales fracked profitably in the USA occur as horizontal sheets deep beneath entire states: entirely predictable for the drillers. In Britain, tens of thousands of wells would need to be drilled on a ‘compartment-by-compartment’ basis at a rate of hundreds each year to yield useful gas supplies. Fracking in England would therefore present unacceptable economic risks to potential investors. Cornelius and Linder have moved on to more achievable ventures in renewables such as geothermal heating in areas of simple British geology.

Jacob Rees-Mogg’s second-class degree in history from Oxford and his long connection with hedge-fund management seem not to be appropriate qualifications for making complex geoscientific decisions. Such a view is apparently held by several fellow Conservative MPs, one of whom suggested that Rees-Mogg should lead by example and make his North East Somerset constituency the ‘first to be fracked’, because it is underlain by potentially gas-yielding shales. The adjoining constituency, Wells, has several sites with shale-gas licences but none have been sought within North East Somerset. Interestingly, successive Conservative governments since 2015, mindful of a ‘not-in-my-backyard’ attitude in the party’s many rural constituencies, have placed a de-facto ban on development of onshore wind power.

Sun, sand and sangria on the Mediterranean Costas – and tsunamis?

You can easily spot a tourist returning from a few summer weeks on the coast of the western Mediterranean, especially during 2022’s record-breaking heat wave and wildfires: sunburnt and with a smoky aroma that expensive après-sun lotion can’t mask. Judging from the seismic records, they may have felt the odd minor earthquake too, perhaps putting it down to drink, lack of sleep and an overdose of trance music. Data from the last 100 years show that southern Spain and north-west Africa have a generally uniform distribution of seismic events, mostly less than Magnitude 5. Yet there is a distinct submarine zone running NNE to SSW from Almeria to the coast of western Algeria. It crosses the Alboran Basin, and reveals significantly more events greater than M 5. Most earthquakes in the region occurred at depths less than 30 km mainly in the crust. Five geophysicists from Spain and another two from Algeria and Italy have analysed the known seismicity of the region in the light of its tectonics and lithospheric structure (Gómez de la Peña, L., et al. 2022. Evidence for a developing plate boundary in the western Mediterranean. Nature Communications, v. 13, article 4786; DOI: 10.1038/s41467-022-31895-z).

Topography of the Alboran Basin beneath the western Mediterranean. The colours grey through blue to purple indicate increasing depth of seawater. Grey circles indicate historic earthquakes, the smallest being M 3 to 4, the largest greater than M 6. Green arrows show plate motions in the area measured using GPS. Active faults are marked in red (see key for types of motion). (Credit: based on Fig 1 of Gómez de la Peña et al.)

The West Alboran Basin is underlain by thinner continental crust (orange on the inset to the map) than beneath southern Spain and western Algeria. Normal crust underpins the Southern Alboran Basin. To the east are the deeper East Alboran and Algero-Balearic Basins, the floor of the latter being true oceanic crust and that of the former created in a now extinct island arc. Running ENE to WSW across the Alboran Basin are two ridges on the sea floor. Tectonic motions determined using the Global Positioning System reveal that the African plate is moving slowly westwards at up to 1 cm yr-1, about 2 to 3 times faster than the European plate. This reflected by the dextral strike-slip along the active ~E-W Yusuf Fault (YSF). This bends southwards to roughly parallel the Alboran Ridge, and becomes a large thrust fault that shows up on ship borne seismic reflection sections. The reflection seismic survey also shows that the shallow crust beneath the Alboran Ridge is being buckled under compression above the thrust. The thrust extends to the base of the African continental crust, which is beginning to override the arc crust of the East Alboran basin. Effectively, this system of major faults seems to have become a plate boundary between Africa and Europe in the last 5 million years and has taken up about 25 km of convergence between the two plates. An estimated 16 km of this has taken place across the Alboran Ridge Thrust which has detached the overriding African crust from the mantle beneath.

The authors estimate an 8.5 to 10 km depth beneath the Alboran fault system at which the overriding crust changes from ductile to brittle deformation – the threshold for strains being taken up by earthquakes. By comparison with other areas of seismic activity, they reckon that there is a distinct chance of much larger earthquakes (up to M 8) in the geologically near future. A great earthquake in this region, where the Mediterranean narrows towards the Strait of Gibraltar, may generate a devastating tsunami. An extension of the Africa-Europe plate boundary into the Atlantic is believed to have generated a major earthquake that launched a tsunami to destroy Lisbon and batter the Atlantic coasts of Portugal, Spain and NW Africa on 1st November 1755. The situation of the active plate boundary in the Alboran Basin may well present a similar, if not worse, risk of devastation.

The dangers of rolling boulders

Field work in lonely and spectacular places is a privilege. Though it can be great, boredom sometimes sets in, which is hard for the lone geologist. Today, I guess a cell phone would help, especially in high places where the signal is good. That means of communication and entertainment only emerged in the 1980s and did not reach wild places until well into the 90s. Pre-cellnet boredom could be relieved by what remains a dark secret: lone geologists once rolled large boulders down mountains and valley sides, shouting ‘Below!’ as a warning to others. Their excuse to themselves for this unique thrill (bounding boulders reach speeds of up to 40 m s-1) was vaguely scientific: sooner or later a precarious rock would fall anyway. This week it emerged that Andrin Caviezel of the Institute for Snow and Avalanche Research in Davos, Switzerland, an Alpine geoscientist, rolls boulders for a living (Caviezel, A. 2022. The gravity of rockfalls. Where I work, Nature, v. 607, p. 838; DOI: 10.1038/d41586-022-02044-9). He finds that ‘…flinging giant objects down a mountain is still super fun’. The serious part of his job attempts to model how rockfalls actually move downslope, as an aid to risk assessment (Caviezel, A. and 23 others 2021. The relevance of rock shape over mass – implications for rockfall hazard assessments. Nature Communications, v. 12, article 5546; DOI: 10.1038/s41467-021-25794-y)

Caviezel’s team (@teamcaviezel) don’t use actual rocks but garishly painted, symmetrical blocks of reinforced concrete weighing up to 3 tonnes, which are more durable than most outcropping rock and can be re-used. A Super Puma helicopter shifts a block to the top of a slope, from which it is levered over the edge (watch video). The team deploys two types of block, one equant and resembling a giant garnet crystal, the other wheel-shaped with facets. The first represents boulders of rock types with uniform properties throughout, such as granite. The wheel type mimics boulders formed from rocks that are bedded or foliated, which are usually plate-like or spindly.

Vertical aerial photograph of a uniform, south-facing slope in the Swiss Alps used to roll concrete ‘boulders’. The red X marks the release point; the blue symbols show the points of rest of equant ‘boulders, the sizes of which are shown in the inset, the wheel-shaped ones are magenta. Coloured circles with crosses show the mean rest position of each category (the lighter the colour the smaller the set of ‘boulders’). The coloured ellipses indicate the standard deviation for each category. (Credit: Caviezel et al., Fig 2)

Unlike other gravity-driven hazards, such as avalanches and mudflows, the directions that rockfalls may follow by are impossible to predict. Rather than hugging the surface, boulders interact with it, bouncing and being deflected, and they spin rapidly. To follow each experiment’s trajectory a block contains a motion sensor, measuring speed and acceleration, and a gyroscope that shows rotation, wobbling and motion direction, while filming records jump heights – up to 11 m in the experiments. Despite the similarity of the blocks, the same release point for each roll and a uniform mountainside slope, with one cliff line, the final resting places are widely spread. That hazard zone of rockfalls is distinctly wider than that of snow avalanches; observing a boulder once it starts to move gives a potential victim little means of knowing a safe place to shelter.

The most important conclusion from the experiments is that the widest spread of tumbling ‘boulders’ is shown by the wheel-shaped ones. So, slopes made from bedded or foliated sedimentary and metamorphic rocks may pose wider hazards from rockfalls than do those underpinned by uniform rocks. However, plate-like or spindly boulders are more stable at rest than are equant ones. Yet boulders rarely fall as a result of being pushed (except in avalanches). On moderate slopes they are undermined by erosion, and on steep slopes or cliffs winter ice wedges open joints allowing blocks to fall during a thaw.

A Bronze Age catastrophe: the destruction of Sodom and Gomorrah?

“…The sun was risen upon the earth when Lot entered into Zoar. Then the Lord rained upon Sodom and Gomorrah brimstone and fire from the Lord out of heaven. And overthrew those cities, and all the plain, and all the inhabitants of the cities, and that which grew upon the ground. But his wife looked back from behind him, and she became a pillar of salt …”

This is the second catastrophe recorded in the Old Testament of the King James Bible (Genesis 19:23-26), after the Noachian Flood (Genesis 7 and 8). The Flood is now regarded by many geoscientists to be a passed-down and mythologised account of the rapid filling of the Black Sea when the Bosporus was breached around 7600 years ago, as global see level rose in the early Neolithic. Eleven Chapters and a great many begotten people later comes the dramatic punishment of the ‘sinners’ of Sodom and Gomorrah. The two legendary settlements are now considered to have been in the Lower Jordan Valley near the Dead Sea. Being on the major strike-slip fault that defines the Jordan Rift, related to the long-active spreading of the Red Sea, the most obvious rationalisation of the myth is a major earthquake. The sedimentary sequence contains sulfide-rich clays and silts, as well as thick salt beds. Major seismicity would have liquidised saturated sediments full of supersaturated salt water and the release of large volumes of hydrogen sulfide gas. There are also remains of early settlements in the form of large mounds known locally as ‘talls’. The largest  and archaeologically  most productive of these is Tall el Hammam in Jordan, whose excavation has proceeded since 2005. It lies just to the north of the Dead Sea on the eastern flank of the Jordan valley, 15 km from Jericho on the occupied West Bank.

The Tall el Hammam mound is formed from layers of debris, mainly of mud bricks, dwellings being built again and again on the remains of earlier ones. It seems to have been continuously occupied for three millennia after 6650 ka ago (4700 BCE) at the core of a presumably grain-based city state with upwards of 10 thousand inhabitants. The site was destroyed around 3600 Ka (1650 BCE). The catastrophic earthquake hypothesis can be neither confirmed nor refuted, but the destruction toppled structures with walls up to 4 m thick.. Whatever the event, 15 years of excavation have revealed that it was one of extremely high energy. There is evidence for pulverisation of mud bricks and at some dwellings they were apparently blown off-site: a possibility in a large magnitude earthquake. Unusually, however, mud bricks and clay used in pottery and roofing had been partially melted during the final destruction. Various analyses suggest temperatures were as high as 2000 °C.

Top – oblique aerial view of the mound at Tal el Hammam looking to the south-west; Bottom – the Lower Jordan Valley and Bronze age talls superimposed by the extent of the area devastated by the 1908 Tunguska air-burst. (credit: Bunch et al. 2021, Figs 1b and 52)

A detailed summary of results from the Tall el Hammam site has just appeared (Bunch T.E., and 20 others 2021. A Tunguska sized airburst destroyed Tall el-Hammam a Middle Bronze Age city in the Jordan Valley near the Dead SeaNature Scientific Reports, v. 11, article 18632; DOI: 10.1038/s41598-021-97778-3). As the title indicates, it comes to an astonishing conclusion, which rests on a large range of archaeological and geochemical data that go well beyond the earlier discovery of the tall’s destruction at very high temperatures. Radiocarbon dates of 26 samples from the destruction layer reveal that it happened in 1661±21 BCE – the mid- to late Bronze Age, as also suggested by the styles of a variety of artefacts. The most revealing data have emerged from the debris that caps the archaeological section, particularly fine-grained materials in it. There are mineral grains indicating that sand-sized grains were melted, some to form spherules or droplets of glass. Even highly refractory minerals such as zircon and chromite were melted. Mixed in with the resulting glasses are tiny nuggets of metals, including platinum-group metals. As well as high temperatures the event involved intense mechanical shock that produced tell-tale lamellae in quartz grains, familiar from sites of known extraterrestrial impacts. One specimen shows a micro-crater produced by a grain of carbonaceous material, which is now made up of ~ 1 μm diamond-like carbon (diamondoids) crystals. There is abundant evidence of directionality in the form of linear distributions of ceramic shards and carbonised cereal grains that seem to have been consistently transported in a SW to NE direction: a kind of high-speed ‘blow-over’. In the debris are also fragments of pulverised bone, most too small to assign to species. But among them are two highly damaged human skulls and isolated and charred human limb- and pelvic bones. Forensic analysis suggests at least two individuals were decapitated, dismembered and incinerated during the catastrophe. Isolated scatters of recognisable human bones indicate at least 10 people who suffered a similar death. Finally the destruction layer is marked by an unusually high concentration of salt, some of which has been melted.

Such a range of evidence is difficult to reconcile by hypotheses citing warfare, accidental burning, tornadoes or earthquakes. However, the diversity of phenomena associated with the destruction of Tall el Hammam has been compared with data from nuclear explosion sites, suggesting the huge power of the event. The authors turned to evidence linked to the air-burst detonation of a cosmic body over Tunguska, Siberia in 1908 which had a power estimated at between 12- to 23 megatonnes of TNT equivalent. Such an event seems to fit the fate of Tall el Hammam. The Tunguska event devastated an area of 2200 km2. The tall and another at Jericho lies within such an area. Perhaps not coincidentally, the destruction of Jericho was also in the mid- to late Bronze Age sometime between 1686 and 1626 BCE: i.e. statistically coeval with that of Tall el Hammam.

Archaeologists working in the Lower Jordan Valley have examined 15 other talls and more than a hundred lesser inhabited sites and have concluded that all of them were abandoned at the end of the Middle Bronze Age. The whole area is devoid of evidence for agricultural settlements for the following three to six centuries, although there are traces of pastoralist activity. The high amount of salt in the Tall el Hammam debris, if spread over the whole area would have rendered its soils infertile until it was eventually flushed out by rainfall and runoff. If, indeed, the event matches the biblical account of Sodom and Gomorrah, then Lot and his remmaing companions would have found it difficult to survive without invading the lands of other people who had escaped, much as recorded later in Genesis. Of more concern is what will become of Ted Bunch and his 20 US colleagues? Will they be charged with blasphemy?

See also: Tunguska-Sized Impact Destroyed Jordan Valley City 3,670 Years Ago, SciNews, 29 September 2021; Did an impact affect hunter gatherers at the start of the Younger Dryas? Earth-logs, 3 July 2020.

Anthropocene more an Event than an Epoch.

The Vattenfall lignite mine in Germany; the Anthropocene personified

The issue of whether or not to assign the time span during which human activities have been significantly affecting the planet and its interwoven Earth Systems has been dragging on since the term ‘Anthropocene’ was first proposed more than two decades ago. A suggestion that may resolve matters, both amicably and with a degree of scientific sense, has emerged in a short letter to the major scientific journal Nature, written by six eminent scientists (Bauer, A.M. et al. 2021. Anthropocene: event or epoch? Nature, v. 597, p. 332; DOI: 10.1038/d41586-021-02448-z). The full text is below

The concept of the Anthropocene has inspired more than two decades of constructive scholarship and public discussion. Yet much of this work seems to us incompatible with the proposal to define the Anthropocene as an epoch or series in the geological timescale, with a precise start date and stratigraphic boundary in the mid-twentieth century. As geologists, archaeologists, environmental scientists and geographers, we have another approach to suggest: recognize the Anthropocene as an ongoing geological event.

The problems with demarcating the Anthropocene as a globally synchronous change in human–environment relations, occurring in 1950 or otherwise, have long been evident (P. J. Crutzen and E. F. Stoermer IGBP Newsletter 41, 17–18; 2000). As an ongoing geological event, it would be analogous to other major transformative events, such as the Great Oxidation Event (starting around 2.4 billion years ago) or the Great Ordovician Biodiversification Event (around 500 million years ago).

Unlike formally defined epochs or series, geological events can encompass spatial and temporal heterogeneity and the diverse processes — environmental and now social — that interact to produce global environmental changes. Defining the Anthropocene in this way would, in our view, better engage with how the term has been used and criticized across the scholarly world.”

AUTHORS: Andrew M. Bauer, Stanford University, Stanford, California, USA; Matthew Edgeworth, University of Leicester, Leicester, UK;  Lucy E. Edwards, Florence Bascom Geoscience Center, Reston, Virginia, USAErle C. Ellis, University of Maryland, Baltimore County, Maryland, USA ; Philip Gibbard, Scott Polar Research Institute, University of Cambridge, Cambridge, UK;  Dorothy J. Merritts, Franklin and Marshall College, Lancaster, Pennsylvania, USA.

I have been grousing about the attempt to assign Epoch/Series status to the Anthropocene for quite a while (you can follow the development of my personal opinions by entering ‘Anthropocene’ in the Search Earth-logs box). In general I believe that the proposal being debated is scientifically absurd, and a mere justification for getting a political banner to wave. What the six authors of this letter propose seems eminently sensible. I hope it is accepted by International Commission on Stratigraphy as a solution to the increasingly sterile discussions that continue to wash to and fro in our community. Then perhaps the focus can be on action rather than propaganda.

As things have stood since 21 May 2019, a proposal to accept the Anthropocene as a formal chrono-stratigraphic unit defined by a GSSP at its base around the middle of the 20th century is before the ICS and the International Union of Geological Sciences (IUGS) for ratification. It was accepted by 88% of the 34-strong Anthropocene Working Group of the ICS Subcommission on Quaternary Stratigraphy. But that proposal has yet to be ratified by either the ICS or IUGS. Interestingly, one of the main Anthropocene proponents was recently replaced as chair of the Working Group.

How flowering plants may have regulated atmospheric oxygen

Ultimately, the source of free oxygen in the Earth System is photosynthesis, but that is the result of a chemical balance in the biosphere and hydrosphere that operates at the surface and just beneath it in sediments. Burial of dead organic carbon in sedimentary rocks allows free oxygen to accumulate whereas weathering and oxidation of that carbon, largely to CO2, tends to counteract oxygen build-up. The balance is reflected in the current proportion of 21% oxygen in the atmosphere. Yet in the past oxygen levels have been much higher. During the Carboniferous and Permian periods it rose dramatically to an all-time high of 35% in the late Permian (about 250 Ma ago). This is famously reflected in fossils of giant dragonflies and other insects from the later part of the Palaeozoic Era.  Insects breathe passively by tiny tubes (trachea) through whose walls oxygen diffuses, unlike active-breathing quadrupeds that drive air into lung alveoli to dissolve O2 directly in blood. Insect size is thus limited by the oxygen content of air; to grow wing spans of up to 2 metres a modern dragon fly’s body would consist only of trachea with no room for gut; it would starve.

Woman holding a reconstructed Late Carboniferous dragonfly (Namurotypus sippeli)

During the early Mesozoic oxygen fell rapidly to around 15% during the Triassic then rose through the Jurassic and Cretaceous Periods to about 30%, only to fall again to present levels during the Cenozoic Era. Incidentally, the mass extinction at the end of the Cretaceous (the K-Pg boundary event) was marked in the marine sedimentary record by unusually high amounts of charcoal. That is evidence for the Chixculub impact being accompanied by global wild fires that a high-oxygen atmosphere would have encouraged. The high oxygen levels of the Cretaceous marked the emergence of modern flowering plants – the angiosperms. Six British geoscientists have analysed the possible influence on the Earth System of this new and eventually dominant component of the terrestrial biosphere. (Belcher, C.M. et al. The rise of angiosperms strengthened fire feedbacks and improved the regulation of atmospheric oxygenNature Communications, v. 12, article 503; DOI 10.1038/s41467-020-20772-2)

The episodic occurrence of charcoal in sedimentary rocks bears witness to wildfires having affected terrestrial ecosystems since the decisive colonisation of the land by plants at the start of the Devonian 420 Ma ago. Fire and vegetation have since gone hand in hand, and the evolution of land plants has partly been through adaptations to burning. For instance the cones of some conifer species open only during wildfires to shed seeds following burning. Some angiosperm seeds, such as those of eucalyptus, germinate only after being subject to fire . The nature of wildfires varies according to particular ecosystems: needle-like foliage burns differently from angiosperm leaves; grassland fires differ from those in forests and so on. Massive fires on the Earth’s surface are not inevitable, however. Evidence for wildfires is absent during those times when the atmosphere’s oxygen content has dipped below an estimated 16%. The current oxygen level encourages fires in dry forest during drought, as those of Victoria in Australia and California in the US during 2020 amply demonstrated. It is possible that with oxygen above 25% dry forest would not regenerate without burning in the next dry season. Wet forest, as in Brazil and Indonesia, can burn under present conditions but only if set alight deliberately. Evidence of a global firestorm after the K-Pg extinction implies that tropical rain forest burns easily when oxygen is above 30%. So, how come the dominant flora of Earth’s huge tropical forests – the flowering angiosperms – evolved and hung on when conditions were ripe for them to burn on a massive scale?

Early angiosperms had small leaves suggesting small stature and growth in stands of open woodland [perhaps shrubberies] that favoured the fire protection of wetlands. ‘Weedy’ plants regenerate and reach maturity more quickly than do those species that are destined to produce tall trees. With endemic wildfires, tree-sized plants – e.g. the gymnosperms of the Mesozoic – cannot attain maturity by growing above the height of flames. Diminutive early angiosperms in a forest understory would probably outcompete their more ancient companions.  Yet to become the mighty trees of later rain forests angiosperms must somehow have regulated atmospheric oxygen so that it declined well below the level where wet forest is ravaged by natural wild fires. The oldest evidence for angiosperm rain forest dates to 59 Ma, when perhaps more primitive tropical trees had been almost wiped-out by wildfires. Did angiosperms also encourage wildfires, that consumed oxygen on a massive scale, as well as evolving to resist their affects on plant growth? Claire Belcher et al. suggest that they did, through series of evolutionary steps. Key to their stabilising oxygen levels at around 21%, the authors allege, was angiosperms’ suppression of weathering of phosphorus from rocks and/or transfer of that major nutrient from the land to the oceans. On land nitrogen is the most important nutrient for biomass, whereas phosphorus is the limiting factor in the ocean. Its reduction by angiosperm dominance on land thereby reduces carbon burial in ocean sediments. In a very roundabout way, therefore, angiosperms control the key factor in allowing atmospheric build-up of oxygen; by encouraging mass burning and suppressing carbon burial.  Today, about 84 percent of wildfires are started by anthropogenic activities. As yet we have little, if any, idea of how such disruption of the natural flora-fire system is going to affect future ecosystems. The ‘Pyrocene’ may be an outcome of the ‘Anthropocene’ …

Tsunami risk in East Africa

The 26 December 2004 Indian Ocean tsunami was one of the deadliest natural disasters since the start of the 20th century, with an estimated death toll of around 230 thousand. Millions more were deeply traumatised, bereft of homes and possessions, rendered short of food and clean water, and threatened by disease. Together with that launched onto the seaboard of eastern Japan by the Sendai earthquake of 11 March 2011, it has spurred research into detecting the signs of older tsunamis left in coastal sedimentary deposits (see for instance: Doggerland and the Storegga tsunami, December 2020). In normally quiet coastal areas these tsunamites commonly take the form of sand sheets interbedded with terrestrial sediments, such as peaty soils. On shores fully exposed to the ocean the evidence may take the form of jumbles of large boulders that could not have been moved by even the worst storm waves.

Sand sheets attributed to a succession of tsunamis, interbedded with peaty soils deposited in a swamp on Phra Thong Island, Thailand. Note that a sand sheet deposited by the 2004 Indian Ocean tsunami is directly beneath the current swamp surface (Credit: US Geological Survey)

Most of the deaths and damage wrought by the 2004 tsunami were along coasts bordering the Bay of Bengal in Indonesia, Thailand, Myanmar, India and Sri Lanka, and the Nicobar Islands. Tsunami waves were recorded on the coastlines of Somalia, Kenya and Tanzania, but had far lower amplitudes and energy so that fatalities – several hundred – were restricted to coastal Somalia. East Africa was protected to a large extent by the Indian subcontinent taking much of the wave energy released by the magnitude 9.1 to 9.3 earthquake (the third largest recorded) beneath Aceh at the northernmost tip of the Indonesian island of Sumatra. Yet the subduction zone that failed there extends far to the southeast along the Sunda Arc. Earthquakes further along that active island arc might potentially expose parts of East Africa to far higher wave energy, because of less protection by intervening land masses.

This possibility, together with the lack of any estimate of tsunami risk for East Africa, drew a multinational team of geoscientists to the estuary of the Pangani River  in Tanzania (Maselli, V. and 12 others 2020. A 1000-yr-old tsunami in the Indian Ocean points to greater risk for East Africa. Geology, v. 48, p. 808-813; DOI: 10.1130/G47257.1). Archaeologists had previously examined excavations for fish farming ponds and discovered the relics of an ancient coastal village. Digging further pits revealed a tell-tale sheet of sand in a sequence of alluvial sediments and peaty silts and fine sands derived from mangrove swamps. The peats contained archaeological remains – sherds of pottery and even beads. The tsunamite sand sheet occurs within the mangrove facies. It contains pebbles of bedrock that also litter the open shoreline of this part of Tanzania. There are also fossils; mainly a mix of marine molluscs and foraminifera with terrestrial rodents fish, birds and amphibians. But throughout the sheet, scattered at random, are human skeletons and disarticulated bones of male and female adults, and children. Many have broken limb bones, but show no signs of blunt-force trauma or disease pathology. Moreover, there is no sign of ritual burial or weaponry; the corpses had not resulted from massacre or epidemic. The most likely conclusion is that they are victims of an earlier Indian Ocean tsunami. Radiocarbon dating shows that it occurred at some time between the 11th and 13th centuries CE. This tallies with evidence from Thailand, Sumatra, the Andaman and Maldive Islands, India and Sri Lanka for a major tsunami in 950 CE.

Computer modelling of tsunami propagation reveals that the Pangani River lies on a stretch of the Tanzanian coast that is likely to have been sheltered from most Indian Ocean tsunamis by Madagascar and the shallows around the Seychelles Archipelago. Seismic events on the Sunda Arc or the lesser, Makran subduction zone of eastern Iran may not have been capable of generating sufficient energy to raise tsunami waves at the latitudes of the Tanzanian coast much higher than those witnessed there in 2004, unless their arrival coincided with high tide – damage was prevented in 2004 because of low tide levels. However, the topography of the Pangani estuary may well amplify water level by constricting a surge. Such a mechanism can account for variations of destruction during the 2011 Tohoku-Sendai tsunami in NE Japan.

If coastal Tanzania is at high risk of tsunamis, that can only be confirmed by deeper excavation into coastal sediments to check for multiple sand sheets that characterise areas closer to the Sunda Arc. So far, that in the Pangani estuary is the only one recorded in East Africa

Thawing permafrost, release of carbon and the role of iron

Projected shrinkage of permanently frozen ground i around the Arctic Ocean over the next 60 years

Global warming is clearly happening. The crucial question is ‘How bad can it get?’ Most pundits focus on the capacity of the globalised economy to cut carbon emissions – mainly CO2 from fossil fuel burning and methane emissions by commercial livestock herds. Can they be reduced in time to reverse the increase in global mean surface temperature that has already taken place and those that lie ahead? Every now and then there is mention of the importance of natural means of drawing down greenhouse gases: plant more trees; preserve and encourage wetlands and their accumulation of peat and so on. For several months of the Northern Hemisphere summer the planet’s largest bogs actively sequester carbon in the form of dead vegetation. For the rest of the year they are frozen stiff. Muskeg and tundra form a band across the alluvial plains of great rivers that drain North America and Eurasia towards the Arctic Ocean. The seasonal bogs lie above sediments deposited in earlier river basins and swamps that have remained permanently frozen since the last glacial period. Such permafrost begins at just a few metres below the surface at high latitudes down to as much as a kilometre, becoming deeper, thinner and more patchy until it disappears south of about 60°N except in mountainous areas. Permafrost is melting relentlessly, sometimes with spectacular results broadly known as thermokarst that involves surface collapse, mudslides and erosion by summer meltwater.

Thawing permafrost in Siberia and associated collapse structures

Permafrost is a good preserver of organic material, as shown by the almost perfect remains of mammoths and other animals that have been found where rivers have eroded their frozen banks. The latest spectacular find is a mummified wolf pup unearthed by a gold prospector from 57 ka-old permafrost in the Yukon, Canada. She was probably buried when a wolf den collapsed. Thawing exposes buried carbonaceous material to processes that release CO, as does the drying-out of peat in more temperate climes. It has long been known that the vast reserves of carbon preserved in frozen ground and in gas hydrate in sea-floor sediments present an immense danger of accelerated greenhouse conditions should permafrost thaw quickly and deep seawater heats up; the first is certainly starting to happen in boreal North America and Eurasia. Research into Arctic soils had suggested that there is a potential mitigating factor. Iron-3 oxides and hydroxides, the colorants of soils that overlie permafrost, have chemical properties that allow them to trap carbon, in much the same way that they trap arsenic by adsorption on the surface of their molecular structure (see: Screening for arsenic contamination, September 2008).

But, as in the case of arsenic, mineralogical trapping of carbon and its protection from oxidation to CO2 can be thwarted by bacterial action (Patzner, M.S. and 10 others 2020. Iron mineral dissolution releases iron and associated organic carbon during permafrost thaw. Nature Communications, v. 11, article 6329; DOI: 10.1038/s41467-020-20102-6). Monique Patzner of the University of Tuebingen, Germany, and her colleagues from Germany, Denmark, the UK and the US have studied peaty soils overlying permafrost in Sweden that occurs north of the Arctic Circle. Their mineralogical and biological findings came from cores driven through the different layers above deep permafrost. In the layer immediately above permanently frozen ground the binding of carbon to iron-3 minerals certainly does occur. However, at higher levels that show evidence of longer periods of thawing there is an increase of reduced iron-2 dissolved in the soil water along with more dissolved organic carbon – i.e. carbon prone to oxidation to carbon dioxide. Also, biogenic methane – a more powerful greenhouse gas – increases in the more waterlogged upper sediments. Among the active bacteria are varieties whose metabolism involves the reduction of insoluble iron in ferric oxyhdroxide minerals to the soluble ferrous form (iron-2). As in the case of arsenic contamination of groundwater, the adsorbed contents of iron oxyhydroxides are being released as a result of powerful reducing conditions.

Applying their results to the entire permafrost inventory at high northern latitudes, the team predicts a worrying scenario. Initial thawing can indeed lock-in up to tens of billion tonnes of carbon once preserved in permafrost, yet this amounts to only a fifth of the carbon present in the surface-to-permafrost layer of thawing, at best. In itself, the trapped carbon is equivalent to between 2 to 5 times the annual anthropogenic release of carbon by burning fossil fuels. Nevertheless, it is destined by reductive dissolution of its host minerals to be emitted eventually, if thawing continues. This adds to the even vaster potential releases of greenhouse gases in the form of biogenic methane from waterlogged ground. However, there is some evidence to the contrary. During the deglaciation between 15 to 8 thousand years ago – except for the thousand years of the Younger Dryas cold episode – land-surface temperatures rose far more rapidly than happening at present. A study of carbon isotopes in air trapped as bubbles in Antarctic ice suggests that methane emissions from organic carbon exposed to bacterial action by thawing permafrost were much lower than claimed by Patzner et al. for present-day, slower thawing (see: Old carbon reservoirs unlikely to cause massive greenhouse gas release, study finds. Science Daily, 20 February 2020) – as were those released by breakdown of submarine gas hydrates.

Doggerland and the Storegga tsunami

Britain is only an island when sea level stands high; i.e. during interglacial conditions. Since the last ice age global sea level have risen by about 130 m as the great northern ice sheets slowly melted. That Britain could oscillate between being part of Europe and a large archipelago as a result of major climatic cycles dates back only to between 450 and 240 ka ago. Previously it was a permanent part of what is now Europe, as befits its geological identity, joined to it by a low ridge buttressed by Chalk across the Dover Strait/Pas de Calais. All that remains of that are the white cliffs on either side. The drainage of what became the Thames, Seine and Rhine passed to the Atlantic in a much larger rive system that flowed down the axis of the Channel. Each time an ice age ended the ridge acted as a dam for glacial meltwater to form a large lake in what is now the southern North Sea. While continuous glaciers across the northern North Sea persisted the lake remained, but erosion during interglacials steadily wore down the ridge. About 450 ka ago it was low enough for this pro-glacial lake to spill across it in a catastrophic flood that began the separation. Several repeats occurred until the ridge was finally breached (See: When Britain first left Europe; September 2007). Yet sufficient remained that the link reappeared when sea level fell. What remains at present is a system of shallows and sandbanks, the largest of which is the Dogger Bank roughly halfway between Newcastle and Denmark. Consequently the swamps and river systems that immediately followed the last ice age have become known collectively as Doggerland.

The shrinkage of Doggerland since 16,000 BCE (Credit: Europe’s Lost Frontiers Project, University of Bradford)

Dredging of the southern North Sea for sand and gravel frequently brings both the bones of land mammals and the tools of Stone Age hunters to light – one fossil was a skull fragment of a Neanderthal. At the end of the Younger Dryas (~11.7 ka) Doggerland was populated and became a route for Mesolithic hunter-gatherers to cross from Europe to Britain and become transient and then permanent inhabitants. Melting of the northern ice sheets was slow and so was the pace of sea-level rise. A continuous passage across Dogger Land  remained even as it shrank. Only when the sea surface reached about 20 m below its current level was the land corridor breached bay what is now the Dover Strait, although low islands, including the Dogger Bank, littered the growing seaway. A new study examines the fate of Doggerland and its people during its final stage (Walker, J. et al. 2020. A great wave: the Storegga tsunami and the end of Doggerland? Antiquity, v. 94, p. 1409-1425; DOI: 10.15184/aqy.2020.49).

James Walker and colleagues at the University of Bradford, UK, and co-workers from the universities of Tartu, Estonia, Wales Trinity Saint David and St Andrews, UK, focus on one devastating event during Doggerland’s slow shrinkage and inundation. This took place around 8.2 ka ago, during the collapse of a section of the Norwegian continental edge. Known as the Storegga Slides (storegga means great edge in Norse), three submarine debris flows shifted 3500 km3 of sediment to blanket 80 thousand km2 of the Norwegian Sea floor, reaching more than half way to Iceland.  Tsunami deposits related to these events occur along the coast western Norway, on the Shetlands and the shoreline of eastern Scotland. They lie between 3 and 20 m above modern sea level, but allowing for the lower sea level at the time the ‘run-up’ probably reached as high as 35 m: more than the maximum of both the 26 December 2004 Indian Ocean tsunami and that in NW Japan on 11 March 2011. Two Mesolithic archaeological sites definitely lie beneath the tsunami deposit, one close to the source of the slid, another near Inverness, Scotland. At the time part of the Dogger Bank still lay above the sea, as did a wide coastal plain and offshore islands along England’s east coast. This catastrophic event was a little later than a sudden cooling event in the Northern Hemisphere. Any Mesolithic people living on what was left of Doggerland would not have survived. But quite possibly they may already have left as the climate cooled substantially

A seabed drilling programme financed by the EU targeted what lies beneath more recent sediments on the Dogger Bank and off the embayment known as The Wash of Eastern England. Some of the cores contain tsunamis deposits, one having been analysed in detail in a separate paper (Gaffney, V. and 24 others 2020. Multi-Proxy Characterisation of the Storegga Tsunami and Its Impact on the Early Holocene Landscapes of the Southern North Sea. Geosciences, v. 10, online; DOI: 10.3390/geosciences10070270). The tsunami washed across an estuarine mudflat into an area of meadowland with oak and hazel woodland, which may have absorbed much of its energy. Environmental DNA analysis suggests that this relic of Doggerland was roamed by bear, wild boar and ruminants. The authors also found evidence that the tsunamis had been guided by pre-existing topography, such as the river channel of what is now the River Great Ouse. Yet they found no evidence of human occupation. Together with other researchers, the University of Bradford’s Lost Frontiers Project have produced sufficient detail about Doggerland to contemplate looking for Mesolithic sites in the excavations for offshore wind farms.

See also: Addley, E. 2020.  Study finds indications of life on Doggerland after devastating tsunamis. (The Guardian, 1 December 2020); Europe’s Lost Frontiers website

Human impact on surface geological processes

I last wrote about sedimentation during the ‘Anthropocene’ a year ago (See: Sedimentary deposits of the ‘Anthropocene’, November 2019). Human impact in that context is staggeringly huge: annually we shift 57 billion tonnes of rock and soil, equivalent to six times the mass of the UKs largest mountain, Ben Nevis. All the world’s rivers combined move about 35 billion tonnes less. I don’t particularly care for erecting a new Epoch in the Stratigraphic Column, and even less about when the ‘Anthropocene’ is supposed to have started. The proposal continues to be debated 12 years after it was first suggested to the IUGS International Commission on Stratigraphy. I suppose I am a bit ‘old fashioned’, but the proposals is for a stratigraphic entity that is vastly shorter than the smallest globally significant subdivision of geological time (an Age) and the duration of most of the recorded mass extinctions, which are signified by horizontal lines in the Column. By way of illustration, the thick, extensive bed of Carboniferous sandstone on which I live is one of many deposited in the early part of the Namurian Age (between 328 and 318 Ma). Nonetheless, anthropogenic sediments of, say, the last 200 years are definitely substantial. A measure of just how substantial is provided by a paper published online this week (Kemp, S.B. et al. 2020. The human impact on North American erosion, sediment transfer, and storage in a geologic context. Nature Communications, v. 11, article 6012; DOI: 10.1038/s41467-020-19744-3).

‘Badlands’ formed by accelerated soil erosion.

Anthropogenic erosion, sediment transfer and deposition in North America kicked off with its colonisation by European immigrants since the early 16th century. First Americans were hunter-gatherers and subsistence farmers and left virtually no traces in the landscape, other than their artefacts and, in the case of farmers, their dwellings. Kemp and colleagues have focussed on late-Pleistocene alluvial sediment, accumulation of which seems to have been pretty stable for 40 ka. Since colonisation began the rate has increased to, at present, ten times that previously stable rate, mainly during the last 200 years of accelerated spread of farmland. This is dominated by outcomes of two agricultural practices – ploughing and deforestation. Breaking of the complex and ancient prairie soils, formerly held together by deep, dense mats of grass root systems, made even flat surfaces highly prone to soil erosion, demonstrated by the ‘dust bowl’ conditions of the Great Depression during the 1930s. In more rugged relief, deforestation made slopes more likely to fail through landslides and other mass movements. Damming of streams and rivers for irrigation or, its opposite, to drain wetlands resulted in alterations to the channels themselves and their flow regimes. Consequently, older alluvium succumbed to bank erosion. Increased deposition behind an explosion of mill dams and changed flow regimes in the reaches of streams below them had effects disproportionate to the size of the dams (see: Watermills and meanders, March 2008). Stream flow beforehand was slower and flooding more balanced than it has been over the last few hundred years. Increased flooding, the building of ever larger flood defences and an increase in flood magnitude, duration and extent when defences were breached form a vicious circle that quickly transformed the lower reaches of the largest American river basins.

North American rates of alluvium deposition since 40 Ka ago – the time axis is logarithmic. (Credit: Kemp et al., 2020; Fig. 2)

All this deserves documentation and quantification, which Kemp et al. have attempted at 400 alluvial study sites across the continent, measuring >4700 rates of sediment accumulation at various times during the past 40 thousand years. Such deposition serves roughly as a proxy for erosion rate, but that is a function of multiple factors, such as run-off of rain- and snow-melt water, anthropogenic changes to drainage courses and to slope stability. The scale of post-settlement sedimentation is not the same across the whole continent. In some areas, such as southern California, the rate over the last 200 years is lower than the estimated natural, pre-settlement rate: this example may be due to increased capture of surface water for irrigation of a semi-arid area so that erosion and transport were retarded. In others it seems to be unchanged, probably for a whole variety of reason. The highest rates are in the main areas of rain-fed agriculture of the mid-west of the US and western Canada.

In a nutshell, during the last century the North American capitalism shifted as much sediment as would be moved naturally in between 700 to 3000 years. No such investigation has been attempted in other parts of the world that have histories of intense agriculture going back several thousand years, such as the plains of China, northern India and Mesopotamia, the lower Nile valley, the great plateau of the Ethiopian Highlands, and Europe. This is a global problem and despite its continent-wide scope the study by Kemp et al. barely scratches the surface. Despite earnest endeavours to reduce soil erosion in the US and a few other areas, it does seem as if the damage has been done and is irreversible.