Climate and tectonics since 250 Ma

A central feature of the Earth’s climate system is the way that carbon bound in two gases – carbon dioxide (CO2) and methane (CH4) – controls the amount of incoming solar energy that is retained by the atmosphere. Indeed, without one or the other our home world would have been locked in frigidity since shortly after its formation: a sterile, ice-covered planet. The ‘greenhouse effect’ has been ever-present because the material from which the Earth accreted contained carbon as well as every other chemical element from hydrogen to uranium. Naturally reactive, it readily combines with hydrogen and oxygen to form methane and carbon dioxide, which would have escaped the inner Earth as gases to enter the earliest atmosphere as a ‘comfort blanket’, along with water vapour, another greenhouse gas.  Their combined effects have remained crudely balanced so that neither inescapable frigidity nor surface temperatures high enough to boil-off the oceans have ever occurred in the last 4.5 billion years. Earth has remained like the wee bear’s porridge in the Goldilocks story! Even so, global climate has fluctuated again and again from that akin to a steamy greenhouse, through long periods of moderation to extensive glacial conditions, including three that extended from pole-to-pole – ‘Snowball’ Earths –  during in the Precambrian. During the Phanerozoic the Earth has entered three long periods of generally low global temperatures, in the Ordovician, the Carboniferous and during the last 2.5 Ma  that allowed polar ice caps and sea-ice to extend a third of the way to the Equator. These were forced back and forth repeatedly by cyclical influences apparently triggered by astronomically controlled changes to Earth’s orbital and rotational parameters – the Milankovich Effect. Anthropogenic emissions of greenhouse gases in vast and increasing amounts now threaten to disrupt natural climate variation, effectively overthrowing the gravitational influences of distant giant planets that have controlled climate changes that shaped our own evolution since the genus Homo first emerged.

Bubbles of air trapped in cores through the ice sheets of Antarctica and Greenland record decreased volumes of land ice as CO2 content increased and the opposite during glacial episodes. Somehow in step with the astronomical forcing the Earth released greenhouse gas to warm the climate and drew it down to bring on cooling. Since all life forms are built from carbon-rich compounds and some extract it from the environment to build carbonate hard parts, climate and life on land and in the oceans are interlinked. In fact life and death are involved, because once dead organisms and their hard parts are buried before being oxidised in sediments on land, as in peat and ultimately coal, and on the ocean floors as limestones or carbonaceous mudstones, atmospheric carbon is sequestered. Exposed to acid water containing dissolved CO2 from the atmosphere or to oxygen, respectively, the two forms of carbon in solid form are released as greenhouse gas once more. Both take place when sedimentary deposits are exhumed as a result of erosion and tectonics. Another factor is the abundance of available nutrients, themselves released and distributed by erosion and agents of transportation. At present surface waters of the most distant parts of the oceans contains plenty of such nutrients, except for a vital one, dissolved iron. So they are wet ‘deserts’. It seems that during the much dustier times of glacial episodes iron in fine form reached far out into the world’s oceans so that phytoplankton at the base of the food chain ‘bloomed ‘and so did planktonic animals. Dead organisms ‘rained’ to the ocean floor so drawing down CO2 from the atmosphere and decreasing the greenhouse effect. The surface parts of the carbon and rock cycles are extremely complex and climatologists have yet to come to grips with modelling its future climates convincingly. Yet the carbon cycle and much deeper parts of the rock cycle are interwoven too.

Carbon in sedimentary rock can be heated by burial, and some can be subducted to great depths at destructive plate margins together. The same applies to in ocean-floor basalts that have been permeated by circulating sea water through hydrothermal circulation to form carbonates in the altered volcanic rock. In both cases carbon stored for hundreds of million years can be released by metamorphism in orogenic belts at zones of continental collision and deep below island arcs. Carbon from mantle depths that has never ‘seen the light of day’ is also added to the atmosphere when magmas form below oceanic constructive margins, hot spots and subduction zones, and where magmas flood the continental surface. Consequently, plate tectonics and deep mantle convection have surely played a long-term role in the evolution of our planet’s climate system. Geoscientists based in Australia and the UK have used geochemical data to reconstruct the stores of carbon in oceanic plates and thermodynamic modelling to track what may have happened to it and the climate through the last 250 Ma (Müller, R.D. et al. 2022. Evolution of Earth’s tectonic carbon conveyor belt. Nature, v. 605, p. 629-639; DOI: 10.1038/s41586-022-04420-x). Their review is an important step in understanding what underpins climate on a geological time scale, onto which much shorter-term surface influences are superimposed.

The amount of carbon being outgassed as CO2 each year along plate boundaries in the early Jurassic (185 Ma) shown in dark purple (low) to yellow (high). Also shown in shades of blue is the accumulation of carbon stored in each square metre of the ocean plates. Plate motions are shown as grey arrows (credit: Müller, R.D. et al. Clip from video in Supplementary Information)

At mid-ocean ridges basaltic magma wells up from mantle depths and loses much of its content of dissolved CO2. The annual outgassing at ridges, which depends on the global rate of plate formation, has varied from 13 to 30 million tonnes of carbon  (MtC yr-1) since the start of the Mesozoic Era 250 Ma ago. Similarly, there is greenhouse-gas escape from volcanic arcs above subduction zones, estimated to have ranged from 0 to 18 MtC yr-1. As an oceanic plate moves away from its source various processes sequester CO2 into the oceanic crust and upper mantle through accumulation of deep-sea sediments and hydrothermal alteration of basaltic crust and peridotite mantle (ranging from 30 to 311 MtC yr-1). Of this influx of carbon into oceanic plates between 36 to 103 MtC yr-1 has gone down subduction zones in descending slabs. Between 0 to 49 MtC yr-1 of that has been outgassed by arc volcanic activity or absorbed into the overriding plate. The rest continues down into the deep mantle, perhaps to form diamonds. Overall, when the rate at which oceanic plates grow is rapid and plate motion speeds up, outgassing should be high. When plate growth slows, so does the rate of CO2 release. Variations in plate growth can be estimated from the magnetic reversal stripes above the ocean floors.  The authors have released an animation of the break-up of Pangaea (well worth watching at full screen – you can skip the ad at the start), with the rate of carbon emission at ridges and volcanic arcs being colour-coded. Also shown is the storage of carbon within oceanic plats plates as time passes.

Length of mid-ocean ridges (orange) and subduction zones (blue) through the last 250 Ma (top). The areas of oceanic crust produced at ridges and consumed by subduction (bottom) (credit: Müller, R.D. et al., Figs 1a, 1c)

Before Pangaea began to break up at the end of the Triassic (200 Ma) the total length of mid-ocean ridges was at a minimum of about 40 thousand km. Through the Jurassic it never exceeded 50,000 km, but rose to a maximum of 80,000 km during the Cretaceous then declined slowly to the current length of 60,000 km. Throughout the last 250 Ma the length of subduction zones stayed roughly the same at about 65 thousand km – not always in the same places – although the overall rate of subduction changed in line with the rate of oceanic plate growth  (the volume that is added must be balanced roughly by the amount that returns to the mantle).  Between the end of the Jurassic and the mid-Cretaceous crustal production and destruction doubled, shown by the bottom plot in the figure above. The very fast  movement of plates and an increase in the global length of ridges during Jurassic to mid-Cretaceous times led to a dramatic increase in CO2 outgassing from ridges so that its content in the atmosphere rose as high as 1200 ppm – more than four times that before the Industrial Revolution. That level resulted in global ‘hothouse’ conditions during the Cretaceous. Another factor behind the Cretaceous climate was a decrease in the global complement of mountains. That led to decreases in erosion and the weathering of silicates by acid rain, thus reducing natural sequestration of carbon.

During the Cenozoic (after 65 Ma) declining ridge outgassing was actually outpaced by that associated with subduction, according to the modelling. That is strange, for by around 35 Ma glaciation had begun  on Antarctica as the Earth was cooling, which implies a major, unexpected sink for excess CO2. The most likely way this might have arisen is through increased erosion and silicate weathering on the exposed continents that consumed CO2 faster than tectonics was releasing the gas. The length of continental arcs shows no sign of a major increase during the Cenozoic, which might have accelerated that kind of sequestration, but a variety of proxies for signs of weathering definitely suggests that there was an upsurge. Also there was increased storage of carbon on the deep ocean floor, shown by the video. Increased calcium released by weathering to enter ocean water in solution would allow more planktonic organisms to secrete calcite (CaCO3) skeletons that would then fall to the ocean floor when they died.

There may be more to be discovered in this hugely complex interplay between tectonics and climate. For instance, when the bottom waters of the oceans are oxygenated by deep currents of cold dense seawater sinking from polar regions, carbon in tissues of sunken dead organism is oxidised to release CO2. If bottom waters are anoxic, this organic carbon is preserved in sediments. The authors mention this as something to be considered in their future work on  the ‘tectonic carbon conveyor belt’.

When Greenland was a warm place

On 14-15 August 2021 it rained for the first time since records began at the highest point on the Greenland ice cap. Summit Camp at 3.216 m is run by the US National Science Foundation, which set it up in 1989, and is famous for climate data gleaned from two deep ice cores there. This odd event came at a time when surface melting of the ice cap covered 870 thousand km2: over half of its total 1.7 million km2 extent: a sure sign of global warming. The average maximum temperature in August at Summit is -14°C, but since the mid 20th century the Arctic has been warming at about twice the global rate. Under naturally fluctuating climatic conditions during the Pleistocene, associated with glacial-interglacial cycles, Greenland may have been ice-free for extended periods, perhaps as long as a quarter of a million years around 1.1 Ma ago. If 75% of the up to 3 km thick ice on Greenland melted that would add 5 to 6 m to global sea level, perhaps as early as 2100 if current rates of climate warming persist.

The edge of the ice cap in NE Greenland (credit: Wikipedia)

The worst scenario is runaway warming on the scale of that which took place 56 Ma ago during the Palaeocene-Eocene Thermal Maximum (PETM) when global mean temperature rose by between 5 to 8°C at a rate comparable with what the planet is experiencing now as a result of growth in the world economy. In fact, the CO2 released during the PETM emerged at a rate that was only about tenth of modern anthropogenic emissions  Sediments that span the Palaeocene-Eocene boundary occur in NE Greenland, a study of which was recently published by scientists from Denmark, Greenland, the UK, Australia and Poland (Hovikoski, J. and 13 others 2021. Paleocene-Eocene volcanic segmentation of the Norwegian-Greenland seaway reorganized high-latitude ocean circulation. Communications Earth & Environment, v. 2, article 172; DOI: 10.1038/s43247-021-00249-w). The greenhouse world of NE Greenland that lay between 70 and 80°N then, as it still does, was an area alternating between shallow marine and terrestrial conditions, the latter characterised by coastal plain and floodplain sediments deposited in estuaries, deltas and lakes. They include coals derived from lush, wooded swamps, inhabited by hippo-like ungulates, primates and reptiles.

At that time the opening of the northern part of the North Atlantic had barely begun, with little chance for an equivalent of the Gulf Stream to have had a warming influence on the Arctic. Shortly after the PETM volcanism began in earnest, to form the flood basalts of the North Atlantic Igneous Province. Each lava flow is capped by red soil or bole: further evidence for a warm, humid climate and rapid chemical weathering. As well as lava build-up, tectonic forces resulted in uplift, effectively opening migration routes for animals and land plants to colonise the benign – for such high latitudes – conditions and perhaps escape the far hotter conditions further south.

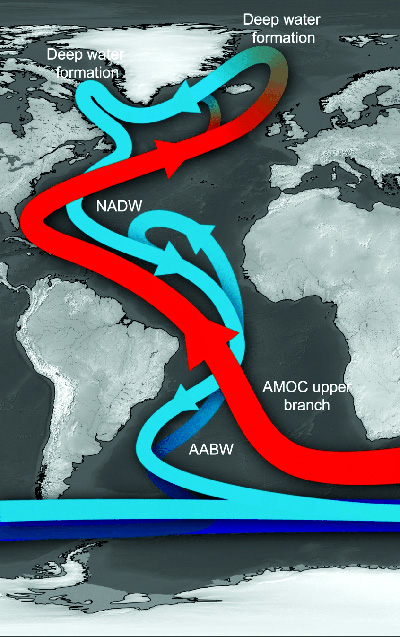
The situation now is much different, with the potential for even more rapid melting of the Greenland ice cap to flood freshwater into the North Atlantic, as is currently beginning. Diluting surface seawater reduces its density and thus its tendency to sink, which is the main driving force that pulls warmer water towards high-latitudes in the form of the Gulf Stream. Slowing and even shutting down its influence may have an effect that contradicts the general tendency for global warming – a cooling trend at mid- to high latitudes with chaotic effects on atmospheric pressure systems, the jet stream and weather in general.

See also: Barham, M. et al. 2021. When Greenland was green: rapid global warming 55 million years ago shows us what the future may hold. The Conversation, 23 August 2021.

Soluble iron and global climate

The environment that humans inhabit is better described as the Earth System, for a good reason. Every part of our planet, the living and the seemingly inert, from the core to the outermost atmosphere, is and always has been interacting with all the others in one way or another. Earth-logs aims to express that, as does my recently revised and now free book Stepping Stones. The vagaries of the Earth’s climate present good examples, the most obvious being the role of chemistry in the form of atmospheric greenhouse gases, especially carbon dioxide, and their interaction with other parts of the Earth System.

Carbon and oxygen atoms that make up CO2 are also present in dissolved form in rain, freshwater and the oceans as the dissolved gas itself, carbonic acid (H2CO­3­) and the soluble bicarbonate ion HCO3, in proportions that depend on water temperature and acidity (pH). Those forms make the oceans an extremely large ‘sink’ for carbon; i.e. CO2 in dissolved form is removed from the atmospheric greenhouse effect. In the short term, there is a rough balance because water bodies also emit CO2, particularly when they heat up.

Phytoplankton bloom in the Channel off SW England (Landsat image)

Carbon dioxide enters more resilient forms through the marine part of the biosphere, at the base of which is photosynthesising phytoplankton. Photosynthesisers ‘sequester’ CO2 from the oceans as various carbohydrates in their soft tissue. Some of them use bicarbonate ions to form calcium carbonate in shells or tests. Once the organisms die both their soft and hard parts may end up buried in ocean-floor sediments: a longer-term sink. How much carbon is buried in these two forms depends on whether bacteria break down the soft tissues by oxidation and on the acidity of water that tends to dissolve the carbonate. Both processes ultimately yield dissolved CO2 that returns to the atmosphere.

Even the simplest phytoplankton cannot live on carbon dioxide and water alone: they need nutrients. The most familiar to any gardener are nitrogen, phosphorus and potassium. These are mainly supplied in runoff from the continents; although marine upwellings supply large amounts where deep ocean water is forced to the surface. Large tracts in the central parts of the oceans are, in effect, marine deserts whose biological productivity is very low. Surprisingly this is not because of severe shortages of N, P and K. This is because a key nutrient, albeit a minor one, is missing; dissolved iron that phytoplankton and ocean fertility in general depend on. This was discovered in the 1970s by US oceanographer John Martin. Just how important iron is to fertility of the oceans and to global climate emerged from studies of ice cores from the Antarctic ice sheet. Air bubbles in the myriad annual layers reveal that their CO2 content falls with each change in oxygen isotopes related to the periodic build up of polar ice caps during cold periods. The greenhouse effect diminished as a result during each stadial, for the simple reason that up to a third of all atmospheric carbon dioxide – about 200 billion tonnes – was withdrawn. The clearest of these are at the last glacial maximum and during the rapid build up glacial ice between 70 and 60 thousand years ago; a time of low sea level when a major ‘out-of-Africa’ human migration took place. A possible candidate for achieving this could have been massively increased ocean fertility and the burial of dead phytoplankton and their shells.

Analyses of Antarctic ice cores record fluctuations in atmospheric CO2 trapped in bubbles during the last ice age (top) and how iron-rich dust deposition onto the ice increased hugely during two major cold periods (bottom) – the last glacial maximum (35 to 18 ka) and between 70 and 60 ka. (Credit, Stoll; Fig. 1)

During stadials the ice cores also reveal that a great deal more dust found its way from the continents to the polar ice sheets. Analysing the dusty layers showed that to have included lots of iron. Falling into the cold ocean-surface waters around the polar regions would have added this crucial nutrient to a medium already rich in CO2 – the colder water is the more gas it will dissolve. These distant oceans bloomed with phytoplankton, speeding up the sequestration of carbon into ocean-floor sediments. Iron may have triggered a biological pump of gargantuan proportions that amplified ice-age cooling. Today the remotest parts of the world’s oceans are starved of iron so the pump only functions in a few places where iron is supplied by rivers or upwellings of deep ocean water

The marine biosphere is clearly a very important active component in the Earth’s climate subsystem. Climate’s continually changing interactions with the rest of the Earth System make climate change hugely complex. It is difficult to predict but growing understanding of its past behaviour is helpful. The late John Martin’s hypothesis of the effects on climate of changing iron concentrations in surface ocean water has a corollary: the stronger the biological pump the more oxygen in deep water must be used up in bacterial decay of descending organic matter. Indeed it was as recent estimates of the degree of oxygenation in ocean-sediment layers correlate with changes in climate that they also reveal.

So, would deliberate iron-fertilisation of polar oceans help draw down greenhouse warming? When several small patches of the Southern Ocean were injected with a few tonnes of dissolved iron they did indeed respond with phytoplankton blooms. However, it is impossible to tell if that had any effect on the atmosphere. ‘Going for broke’ with a massive fertilisation of this kind has been proposed, but this ventures dp into the political swamp that currently surrounds global warming and the wider environment. It is becoming possible to model such a strategy by using the data from the experiments and from ice cores, and early results seem to confirm the role of iron and the biological pump in CO2 sequestration by suggesting that half the known draw-down during ice ages can be explained in this way.

Based on a review by: Heather Stoll in February 2020. (30 years of the iron hypothesis of ice ages. Nature, v. 578, p. 370-371; DOI: 10.1038/d41586-020-00393-x}

Chaos and the Palaeocene-Eocene thermal maximum

The transition from the Palaeocene to Eocene Epochs (56 Ma) was marked by an abrupt increase in global mean temperature of about 5 to 8°C within about 10 to 20 thousand years. That is comparable to a rate of warming similar to that currently induced by human activities. The evidence comes from the oxygen isotopes and magnesium/calcium ratios in the tests of both surface- and bottom dwelling foraminifera. The event is matched by a similarly profound excursion in the δ13C of carbon-rich strata of that age, whose extreme negative value marks the release of a huge mass of previously buried organic carbon to the atmosphere. The Epoch-boundary coincides with the beginning of rapid diversification among mammals and plants that had survived the end-Cretaceous mass extinction some 10 Ma beforehand. The most likely cause was the release of methane, a more potent greenhouse gas than CO2, from gas hydrate buried just beneath the surface of sea-floor sediments on continental shelves. An estimated mass of 1.5 trillion tonnes of released methane has been suggested. Methane rapidly oxidizes to CO2 in the atmosphere, which dissolves to make rainwater slightly acid so that the oceans also become more acid; a likely cause for the mass extinction of foraminifera species at the boundary.

Since the discovery of the Palaeocene-Eocene Thermal Maximum (PETM) in the late-1990s a range of possible causes have been suggested. Releasing methane suddenly from sea-floor gas hydrates needs some kind of trigger, such as a steady increase in the temperature of ocean-bottom water to above the critical level for gas-hydrate stability. The late-Palaeocene witnessed slow global warming by between 3 to 5°C over 4 to 5 Ma. There are several hypotheses for this precursor warming, such as a direct CO2 release from the mantle by volcanic activity for which there are several candidates in the geological record of the Palaeocene. Such surface warming would have had to be transferred to the sea floor on continental shelves to destabilise gas hydrates, which implicates a change in oceanic current patterns. An extraterrestrial cause has also been considered (see Impact linked to the Palaeocene-Eocene boundary event, Earth-logs October 2016). Sediment cores from the North Atlantic off the eastern seaboard of the US have revealed impact debris including glass spherules and shocked mineral grains at the same level as the PETM, together with iridium in terrestrial sediments onshore of the same age: there are no such global signatures). But apart from two small craters in Texas and Jordan (12 and 5 km across, respectively) of roughly the same age, no impact event of the necessary magnitude for truly global influence is known. However, there may have been an altogether different triggering mechanism.

Since the confirmation of the Milanković-Croll hypothesis to explain the cyclical shifts in climate during the Pleistocene Epoch in terms of changes in Earth’s orbital characteristics induced by varying gravitational forces in the solar system, the findings have been used as an alternative means of dating other stratigraphic events that show cyclicity. In essence, the varying forces at work are inherently chaotic in a formally mathematical sense. Although Milanković cycles sometimes pop-up when ancient, repetitive stratigraphic sequences are analysed, consistently using the method as a tool to calibrate the geological record to an astronomical timescale breaks down for sediments older than about 50 Ma. Calculations disagree markedly beyond that time. Richard Zeebe and Lucas Lourens of the Universities of Hawaii and Utrecht tried an opposite approach, using the known geological records from deep-sea cores to calibrate the astronomical predictions and, in turn, used the solution to take the astronomical time scale further back than 50 Ma (Zeebe, R.E. & Lourens, L.J. 2019. Solar System chaos and the Paleocene–Eocene boundary age constrained by geology and astronomy. Science, v. 365, p. 926-929; DOI: 10.1126/science.aax0612). They reached back about 8 Ma, so putting the PETM in focus. As well as refining its age (56.01 ± 0.05 Ma) they showed that the PETM coincided with a 405 ka maximum in Earth’s orbital eccentricity lasting around 170 ka: a possible orbital trigger for the spike in temperature and δ13C together, with evidence for a period of chaos in the Solar System about 50 Ma ago. But, what did that chaos actually do, other than mess up orbital dating? To me it seems to suggest something narsty happening to the behaviour of the Giant Planets that are the Lords of the astronomical dance…

See also: Grabowski, M. 2019. Deep-sea sediments reveal solar system chaos: an advance in dating geologic archives. SOEST News

Odds and ends about Milankovitch and climate change

It is some 40 years since the last explosive development in understanding the way the world works. In 1976 verification of Milutin Milanković’s astronomical theory to explain cyclical climate change as expressed by surface processes has had a similar impact as the underpinning of internal processes by the emergence of plate tectonics in the preceding decade. Signals that match the regularity of changes in the Earth’s orbital eccentricity and the tilt and precession of its axis of rotation, with periods of roughly 96 and 413 ka, 41 ka, 21 and 26 ka respectively, were found in climate change proxies in deep-sea sediment cores (oxygen isotope sequences from benthonic foraminifera) spanning the last 2.6 Ma. The findings seemed as close to proof as one might wish, albeit with anomalies. The most notable of these was that although Milanković’s prediction of a dominant 41 ka effect of changing axial tilt, the strongest astronomical forcing, had characterised cooling and warming cycles in the early Pleistocene, since about a million years ago a ~100 ka periodicity took over – that of the weakest forcing from changing orbital obliquity. Analysis of sedimentary cycles from different episodes in earlier geological history, as during Carboniferous to Permian global frigidity, seemed to confirm that gravitational fluctuations stemming from the orbits of other planets, Jupiter and Saturn especially, had been a continual background to climate change.

All manner of explanations have been offered to explain why tiny, regular and predictable changes in Earth’s astronomical behaviour produce profound changes in the highly energetic and chaotic climate system. Much attention has centred on the mathematically based concept of stochastic resonance. That is a phenomenon where weak signals may be induced to show themselves if they are mixed with a random signal – ‘white noise’ spanning a great range of frequencies. The two resonate at the hidden frequencies thereby strengthening the weak, non-random signal. Noise is already present in the climate system because of the random and highly complex nature of the components of climate itself and the surface processes that it induces.

The latest development along these lines suggests that something quite simple may be at the root of inner complexities in the climatic history of the Pleistocene Epoch: the larger an ice sheet becomes and the longer it lasts the easier it is to cause it to melt away (Tzedakis, P.C. et al. 2017. A simple rule to determine which insolation cycles lead to interglacials. Nature, v. 542, p. 427-432; doi:10.1038/nature21364). The gist of the approach taken in the investigation lies in analysing the degree to which the onsets of major ice-cap melting match astronomically predicted peaks in summer insolation north of 65° N. It also subdivides O-isotope signals of periods of sea level rise into full interglacials, interstadials during periods of climate decline and a few cases of extended interglacials. Through time it is clear that there has been an  increase in the number of interstadials that interrupt cooling between interglacials. Plotting the time of peaks in predicted summer warming closest to major glacial melting events against their insolation energy is revealing.

Before 1.5 Ma the peak energy of summer insolation in the Northern Hemisphere exceeded a threshold leading to full interglacials rather than interstadials more often than it did during the period following 1 Ma. Although Milanković’s 41 ka periodicity remained recognisable throughout, from about 1.5 Ma ago more and more of the energy peaks resulted in only the partial ice melting of interstadial events. The energy threshold for the full deglaciation of interglacials seems to have increased between 1.5 to 1.0 Ma and then settled to a ‘steady state’. The balance between glacial growth and melting increasingly ‘skipped’ 41 ka peaks in insolation so that ice caps grew bigger with time. Deglaciation then required additional forcing. But considering the far larger extent of ice sheets, the tiny additional insolation due to shifts in  orbital eccentricity every ~100 ka surprisingly tipped truly savage ice ages into warm interglacials.

Resolving this paradox may lie with three simple, purely terrestrial factors associated with great ice caps: thicker and more extensive ice becomes warmer at its base and more prone to flow; climate above and around large ice caps becomes progressively colder and drier, so reducing their growth rate; the more sea level falls as land ice builds up, the more the vertical structure and flow of ocean water change. The first of these factors leads to periodic destabilisation when ice sheets surge outwards and increase the rate of iceberg calving into the surrounding oceans. Such ‘iceberg armadas’ characterised the last Ice Age to result in sudden irregularly spaced changes in ocean dynamics and global climate to return to metastable ice coverage, as did earlier ones of similar magnitude. The second factor results in dust lingering at the surface of ice caps that reduced the ability of ice to reflect solar radiation back to space, which enhances summer melting. The third and perhaps most profound factor reduces the formation of ocean bottom water into which dissolved carbon dioxide has accumulated from thermohaline sinking of surface water. This leads to more CO2 in the atmosphere and a growing greenhouse effect. Comforting as finding simplicity within huge complexity might seem, that orbital eccentricity’s weak effect on climatic warming – an order of magnitude less than any other astronomical forcing – can tip climate from one extreme to the other should be a grave warning: climate is chaotic and responds unpredictably to small changes …

Ancient CO2 estimates worry climatologists

Concerns about impending, indeed actual, anthropogenic climate change brought on by rapidly rising levels of the greenhouse gas carbon dioxide have spurred efforts to quantify climates of the distant past. Beyond the CO2 record of the last 800 ka established from air bubbles trapped in glacial ice palaeoclimate researchers have had to depend on a range of proxies for the greenhouse effect. Those based on models linking plate tectonic and volcanic CO2 emissions with geological records of the burial of organic matter, weathering and limestone accumulation are imprecise in the extreme, although they hint at considerable variation during the Phanerozoic. Other proxies give a better idea of the past abundance of the main greenhouse gas, one using the curious openings or stomata in leaves that allow gases to pass to and fro between plant cells and the atmosphere. Well preserved fossil leaves show stomata nicely back to about 400 Ma ago when plants first colonised the land.


Embed from Getty Images
Stomata on a rice leaf (credit: Getty images)

Stomata draw in CO2 so that it can be combined with water during photosynthesis to form carbohydrate. So the number of stomata per unit area of a leaf surface is expected to increase with lowering of atmospheric CO2 and vice versa. This has been observed in plants grown in different air compositions. By comparing stomatal density in fossilised leaves of modern plants back to 800 ka allows the change to be calibrated against the ice-core record. Extending this method through the Cenozoic, the Mesozoic and into the Upper Palaeozoic faces the problems of using fossils of long-extinct plant leaves. This is compounded by plants’ exhalation of gases to the atmosphere – some CO2 together with other products of photosynthesis, oxygen and water vapour. Increasing stomatal density when carbon dioxide is at low concentration risks dehydration. How extinct plant groups coped with this problem is, unsurprisingly, unknown. So past estimates of the composition of the air become increasingly reliant on informed guesswork rather than proper calibration. The outcome is that results from the distant past tend to show very large ranges of CO2 values at any particular time.

An improvement was suggested some years back by Peter Franks of the University of Sydney with Australian, US and British co-workers (Franks, P.J. et al. 2014. New constraints on atmospheric CO2 concentration for the Phanerozoic. Geophysical Research Letters, v. 41, p. 4685-4694; doi:10.1002/2014GL060457). Their method included a means of assessing the back and forth exchange of leaf gases with the atmosphere from measurements of the carbon isotopes in preserved organic carbon in the fossil leaves, and combined this with stomatal density and the actual shape of stomata. Not only did this narrow the range of variation in atmospheric CO2 results for times past, but the mean values were dramatically lessened. Rather than values ranging up to 2000 to 3000 parts per million (~ 10 times the pre-industrial value) in the Devonian and the late-Triassic and early-Jurassic, the gas-exchange method does not rise above 1000 ppm in the Phanerozoic.

The upshot of these findings strongly suggests that the Earth’s climate sensitivity to atmospheric CO2 (the amount of global climatic warming for a doubling of pre-industrial CO2 concentration) may be greater than previously thought; around 4° rather than the currently accepted 3°C. If this proves to be correct it forebodes a much higher global temperature than present estimates by the Intergovernmental Panel on Climate Change (IPCC) for various emission scenarios through the 21st century.

See also: Hand, E. 2017. Fossil leaves bear witness to ancient carbon dioxide levels. Science, v. 355, p. 14-15; DOI: 10.1126/science.355.6320.14.

Kelly, H. 2017. How did plants evolve stomata.

Out of Africa: a little less blurred?

DNA from the mitochondria of humans who live on all the habitable continents shows such a small variability that all of us must have had a common maternal ancestor, and she lived in Africa about 160 ka ago. Since this was first suggested by Rebecca Cann, Mark Stoneking and Allan Wilson of the University of California, Berkeley in 1987 there has been a stream of data and publications – subsequently using Y-chromosome DNA and even whole genomes – that both confirm an African origin for Homo sapiens and illuminate it. Analyses of the small differences in global human genetics also chart the routes and – using a ‘molecular clock’ technique – the timings of geographic and population branchings during migration out of Africa. As more and better quality data emerges so the patterns change and become more intricate: an illustration of the view that ‘the past is always a work in progress’. The journal Nature published four papers online in the week ending 25 September 2016 that demonstrate the ‘state of the art’.

Three of these papers add almost 800 new, high-quality genomes to the 1000 Genomes Project that saw completion in 2015. The new data cover 270 populations from around the world including those of regions that have previously been understudied for a variety of reasons: Africa, Australia and Papua-New Guinea. All three genomic contributions are critically summarized by a Nature News and Views article (Tucci, S & Akey, J.L. 2016. A map of human wanderlust. http://dx.doi.org/10.1038/nature19472). The fourth paper pieces together accurately dated fossil and archaeological findings with data on climate and sea-level changes derived mainly from isotopic analyses of marine sediments and samples from polar ice sheets (Timmermann, A & Friedrich, T. 2016. Late Pleistocene climate drivers of early human migration. Nature, doi:10.1038/nature19365). Axel Timmermann and Tobias Friedrich of the University of Hawaii have attempted to simulate the overall dispersal of humans during the last 125 ka according to how they adapted to environmental conditions; mainly the changing vegetation cover as aridity varied geographically, together with the opening of potential routes out of Africa via the Straits of Bab el Mandab and through what is now termed the Middle East or Levant. They present their results as a remarkable series of global maps that suggest both the geographic spread of human migrants and how population density may have changed geographically through the last glacial cycle. Added to this are maps of the times of arrival of human populations across the world, according to a variety of migration scenarios. Note: the figure below estimates when AMH may have arrived in different areas and the population densities that environmental conditions at different times could have supported had they done so. Europe is shown as being possibly settled at around 70-75 ka, and perhaps having moderately high densities for AMH populations. Yet no physical evidence of European AMH is known before about 40 ka. Anatomically modern humans could have been in Europe before that time but failed to diffuse towards it, or were either repelled by or assimilated completely into its earlier Neanderthal population: perhaps the most controversial aspect of the paper.

timmermann
Estimated arrival time since the last continuous settlement of anatomically modern human migrants from Africa (top); estimated population densities around 60 thousand years ago. (Credit: Axel Timmermann University of Hawaii)

The role of climate change and even major volcanic activity – the 74 ka explosion of Toba in Indonesia – in both allowing or forcing an exodus from African homelands and channelling the human ‘line of march’ across Eurasia has been speculated on repeatedly. Now Timmermann and Friedrich have added a sophisticated case for episodic waves of migration across Arabia and the Levant at 106-94, 89-73, 59-47 and 45-29 ka. These implicate the role of Milankovich’s 21 ka cycle of Earth’s axial precession in opening windows of opportunity for both the exodus and movement through Eurasia; effectively like opening and closing valves for the flow of human movement. The paper is critically summarised by a Nature News and Views article (de Menocal, P.B. & Stringer, C. 2016. Climate and peopling of the world. Nature, doi:10.1038/nature19471.

This multiple-dispersal model for the spread of anatomically modern humans (AMH) finds some support from one of the genome papers (Pangani, L. and 98 others 2016. Genomic analyses inform on migration events during the peopling of Eurasia. Nature (online). http://dx.doi.org/10.1038/nature19792). A genetic signature in present-day Papuans suggests that at least 2% of their genome originates from an early and largely extinct expansion of AMH from Africa about 120 ka ago, compared with a split of all mainland Eurasians from African at around 75 ka. It appears from Pangani and co-workers’ analyses that later dispersals out of Africa contributed only a small amount of ancestry to Papuan individuals. The other two genome analyses (Mallick, S. and 79 others 2016. The Simons Genome Diversity Project: 300 genomes from 142 diverse populations. Nature (online) http://dx.doi.org/10.1038/nature18964; Malaspinas, A.-S. and 74 others 2016. A genomic history of Aboriginal Australia. Nature (online). http://dx.doi.org/10.1038/nature18299) suggest a slightly different scenario, that all present-day non-Africans branched from a single ancestral population. In the case of Malaspinas et al. an immediate separation of two waves of AMH migrants led to settlement of Australasia in one case and to the rest of Mainland Eurasia. Yet their data suggest that Australasians diverged into Papuan and Australian population between 25-40 ka ago. Now that is a surprise, because during the lead-up to the last glacial maximum at around 20 ka, sea level dropped to levels that unified the exposed surfaces of Papua and Australia, making it possible to walk from one to the other. These authors appeal to a vast hypersaline lake in the emergent plains, which may have deterred crossing the land bridge. Mallick et al. see an early separation between migrants from Africa who separately populated the west and east of Eurasia, with possible separation of Papuans and Australians from the second group.  These authors also show that the rate at which Eurasians accumulated mutations was about 5% faster than happened among Africans. Interestingly, Mallick et al. addressed the vexed issue of the origin of the spurt in cultural, particularly artistic, creativity after 50 ka that characterizes Eurasian archaeology. Although their results do not rule out genetic changes outside Africa linked to cultural change, they commented as follows:

‘… however, genetics is not a creative force, and instead responds to selection pressures imposed by novel environmental conditions or lifestyles. Thus, our results provide evidence against a model in which one or a few mutations were responsible for the rapid developments in human behaviour in the last 50,000 years. Instead, changes in lifestyles due to cultural innovation or exposure to new environments are likely to have been driving forces behind the rapid transformations in human behaviour …’.

Variations in interpretation among the four papers undoubtedly stem from the very different analytical approaches to climate and genomic data sets, and variations within the individual sets of DNA samples. So it will probably be some time before theoretical studies of the drivers of migration and work on global human genomics and cultural development find themselves unified. And we await with interest the pooling of results from all the different genetics labs and agreement on a common data-mining approach.

Focus on glaciation…and avoid physics envy

About 1.3 billion years ago two small black holes, each weighing in at about 30 solar masses, ran into one another and fused. At that time Earthly life forms had neither mouths nor anuses, nor even a nervous system, and they were not much bigger than a sand grain. The distant collision involved  rapid acceleration of considerable masses. A century ago Albert Einstein predicted that the movement of any matter in the universe should perturb space-time in a wave-like form that travels at the same speed as light. Well, he was right for, at 9:50:45 universal time on 14 September 2015, four exquisitely engineered mirrors deployed in the two set-ups of a Laser Interferometer Gravitational-Wave Observatory (LIGO) in Louisiana and Washington states in the US minutely shuddered, first in the Deep South and 0.007 seconds later in the Pacific Northwest. The signal lasted 0.25 seconds and, when rendered as sound, comprised a sort of chirrup starting at 35 Hz and rising to 250 Hz before an abrupt end. Five months later, and silent internationally shared theoretical verification, the story was released to the back slapping, stamping and pawing the air that we have come to expect from clever, ambitious and persuasive people who have spent a great deal of our money and have something to show for it. So now we know that the universe is probably throbbing – albeit very, very, very quietly – with gravitational waves generated by every single motion that has taken place in the whole of ‘recorded’ history since the Big Bang. Indeed, it is claimed, LIGO-like machines may one day detect the big wave itself if, that is, it hasn’t already passed through the solar system. Recall, 13.7 billion years ago the Big Bang didn’t take much longer than this comparatively mundane collision at 1.3 Ga . Physicists are going to have a lot to ponder on now they have a lever to get yet greater funds. To put all this in perspective, the detected chirrup had been traveling for 1.3 Ga, and so too must the actual place in the universe where it took place: I guess we will never know where it is now or what damage or otherwise may have been visited upon planetary systems in its vicinity, if indeed it had even the slightest recognisable geological or ecological consequence.

So, onto the mundane world of glaciology and climate change.

Tibet is the third greatest repository of glacial ice on the surface of the Earth’s continents. It is the focus of one of the planet’s greatest climatic system, the South Asian. While much of the Plateau hasn’t borne glaciers continuously throughout even the last glacial cycle, it is becoming clear that its western margin has remained cold enough to retain ice throughout an even longer period. In the Kunlun mountains is a 200 km2 ice cap known as the Guliya. At the start of detailed glacial stratigraphic ventures in 1990s, focused mainly on Greenland and Antarctica, analysis of a core from the Guliya ice cap yielded dates extending back to 130 ka, before the start if the last interglacial. This section lies above ice that at the time could not be dated reliably other than to show that it may be older than about 750 ka. This stemmed from its lack of the radioactive 36Cl formed, similarly to 14C, by cosmic-ray interactions with stable 35Cl in atmospheric salt aerosols: such cosmogenic chlorine can be used for radiometric dating of ice younger than 750 ka.

A News Feature in the 29 January issue of Science (Qiu, J. 2016. Tibet’s primeval ice. Science, v. 351, p. 436-439) focused on the preliminary results of an expedition, led by Yao Tandong of the Institute of Tibetan Plateau Research, Beijing and Lonnie Thompson of Ohio State University, Columbus, to drill a further five ice cores at Guliya in September 2015, one of which penetrated ove 300 m of glacial ice. It is now possible to date ice layers back to a million years using argon isotopes. Combined with stable isotope and other measurements through the cores, the dating should provide a huge amount of new information on the evolution of the monsoon, which is currently understood only vaguely. Such information would sharpen models of how the monsoon system works and even hint at how it might change during a period of anthropogenic warming. An estimated 1.4 billion people – a fifth of humanity – who live in the Indian subcontinent, China and SE Asia depend for their food-production on the monsoon.

With less humanitarian urgency but equally fascinating is the discovery that, as well as sea-ice, the central Arctic Ocean once hosted vast ice shelves during the last-but-one glacial episode (Jakobsson, M. and 24 others 2016. Evidence for an ice shelf covering the central Arctic Ocean during the penultimate glaciations. Nature Communications, v. 7, doi:10.1038/ncomms10365. Clues emerged from multibeam sonar bathymetry that created detailed images of topography on the floor of the Arctic Ocean. These revealed sets of parallel ridges on the shallowest parts of the polar basin, thought to have formed when moving ice shelves grounded. The depths of the grooved areas indicate ice thicknesses up to and exceeding 1 km. The grooves look very similar to the large-scale lineaments that formed on the surface of the Canadian Shield when the Laurentide ice sheet ground its way from zones of glacial accumulation. Grounding of an ice shelf would have resulted in its thickening in the upflow direction as a result of plastic deformation of the ice, tending to lock the flow and direct ice escape over the deeper parts of the Arctic basin.

Antarctic Ice Shelf
Antarctic Ice Shelf (credit: Wikipedia)

Back-tracking the grooves defines the ice shelf’s source regions in the northern Canadian islands, north Scandinavia and the lowlands of eastern Siberia as well as regional flow patterns and the extent of floating continental ice. The last is a major surprise: at over 4 million km2 it was four times larger than all modern Antarctic ice shelves. The ice moved to ‘escape’ to the North Atlantic Ocean through the Fram Strait between East Greenland and Svalbard (Spitzbergen). Dating sediment stratigraphy in the grooved areas using magnetic and fossil data shows that the ice shelves existed between 160 and 140 ka during the penultimate glacial maximum. For such a mass of glacial ice to be expelled into the Arctic Ocean implies that a great deal more snow fell on its fringes then than during the last glacial maximum. Another possibility is that the huge mass of floating ice regulated the salinity and density of the upper Atlantic in a different way from the periodic iceberg ‘armadas’ that characterized the last glacial epoch and help account for a whole number of sudden warming and cooling events.

Domack, E. 2016. A great Arctic ice shelf. Nature, v. 530, p. 163-164.

The core’s influence on geology: how does it do it?

Although no one can be sure about the details of processes in the Earth’s core what is accepted by all is that changes in core dynamics cause the geomagnetic field to change in strength and polarity, probably through some kind of physical interaction between core and deep mantle at the core-mantle boundary (CMB). Throughout the last 73 Ma and especially during the Cenozoic Era geomagnetism has been more fickle than at any time since a more or less continuous record began to be preserved in the Jurassic to Recent magnetic ‘stripes’ of the world ocean floor. Moreover, they came in bursts: 5 in a million years at around 72 Ma; 10 in 4 Ma centred on 54 Ma; 17 over 3 Ma around 42 Ma; 13 in 3 Ma at ~24 Ma; 51 over a period of 12 Ma centring on 15 Ma. During the Late Jurassic and Early Cretaceous the core was similarly ‘busy’, the two time spans of frequent reversals being preceded by quiet ‘superchrons’ dominated by the same normal polarity as we have today i.e. magnetic north being roughly around the north geographic pole.

The Cenozoic history of magnetic reversals - black periods were when geomagnetic field polarity was normal and white when reversed. (credit: Wikipedia)
The Cenozoic history of magnetic reversals – black periods were when geomagnetic field polarity was normal and white when reversed. (credit: Wikipedia)

Until recently geomagnetic ‘flips’ between the two superchrons were regarded as random , perhaps suggesting chaotic behaviour at the CMB. But such a view depends on the statistical method used. A novel approach to calculating reversal frequency through time, however, shows peak-trough pairs recurring 5 times through the Cenozoic Era, approximately 13 Ma apart: maybe the chaos is illusory (Chane, J. et al. 2015. The 13 million year Cenozoic pulse of the Earth. Earth and Planetary Science Letters, v. 431, p. 256-263). So, here is a kind of yardstick to see if there may be any connection between core processes and those at the surface, which Chen of the Fujian Normal University, Fushou China and Canadian and Chinese colleagues compared with the very detailed Cenozoic oxygen-isotope (δ18O) record preserved by foraminifera in ocean-floor sediments, which is a well established proxy for changes in climate. Removing the broad trend of cooling through the Cenozoic resulted in a plot of more intricate climatic shifts that matches the geomagnetism record in both shape and timing of peak-trough pairs. It also turns out, or so the authors claim, that both measures correlate with changes in the rate of Cenozoic subduction of oceanic lithosphere (a measure of plate tectonic activity), albeit negative – peaks in magnetism and climate connecting with slowing in the pace of tectonics.

The analyses involved some complicated maths, but taken at face value the correlations beg the questions why and how? Long-term climate change contains an astronomical signal, encapsulated in the Milankovich hypothesis which has been tested again and again with little room for refutation. So is this all to do with gravitational influences in the Solar System. More exotic still is the possibility of 13 Ma cyclicity linking the Milankovich mechanism with the vaster scale of the Sun’s orbit oscillating through the disc of the Milky Way galaxy and theoretical hints of a mysterious role for dark matter in or near the galaxy. Or, is it a relationship in which climate and the magnetic field are modulated by plate tectonics through varying volcanic emissions of greenhouse gases and the deep effect of subduction on processes at the CMB respectively? To me that seems more plausible, but it is still as exceedingly complex as the maths used to reveal the correlations.

Pleistocene megafaunal extinctions – were humans to blame?

Australia and the Americas had an extremely diverse fauna of large beasts (giant wombats and kangeroos in Australia; elephants, bears, big cats, camelids, ground sloths etc in the Americas) until the last glaciation and the warming period that led into the Holocene interglacial. The majority of these megafauna species vanished suddenly during that recent period. To a lesser extent something similar happened in Eurasia, but nothing significant in Africa. Because the last glacial cycle also saw migration of efficient human hunter-gatherers to every other continent except Antarctica, many ecologists, palaeontologists and anthropologists saw a direct link between human predation and the mass extinction (see Earth-Pages of April 2012. Earlier humans had indeed spread far and wide in Eurasia before, and the crude hypothesis that the last arrivals in Australasia and the Americas devoured all the meatiest prey in three continents had some traction as a result: predation in Eurasia and Africa by earlier hominids would have made surviving prey congenitally wary of bipeds with spears. In Australia and the Americas the megafauna species would have been naive and confident in their sheer bulk, numbers, speed and, in some cases, ferocity. Other possibilities emerged, such as the introduction of viruses to which faunas had no immunity or as a result of climate change, but none of the three possibilities has gained incontrovertible proof. But the most popular, human connection has had severe knocks in the last couple of years. A fourth, that the extinctions stemmed from a comet impact proved to have little traction.

English: s were driven to extinction by and hu...
Megafauna in a late-Pleistocene landscape including woolly mammoths and rhinoceroses, horses, and cave lions with a carcass. (credit: Wikipedia)

Since the amazing success of analysing the bulk DNA debris in sea water – environmental DNA or eDNA – to look at the local diversity of marine animals, the analytical and computing techniques that made it possible have been turned to ancient terrestrial materials: soils, permafrost and glacial ice. One of the first attempts revealed mammoth and pre-Columbian horse DNA surviving in Alaskan permafrost, thanks to the herds’ copious urination and dung spreading. Several articles in the 24 July 2015 issue of Science review ancient DNA advances, including eDNA from soils that chart changes in both fauna and flora over the last glacial cycle (Pennisi, E. 2015. Lost worlds found. Science, v. 349, p. 367-369). Combined with a variety of means of dating the material that yield the ancient eDNA, an interesting picture is emerging. The soil and permafrost samples potentially express ancient ecosystems in far more detail than would fossil animals or pollens, many of which are too similar to look at the species level and in any case are dominated by the most abundant plants rather than showing those critical in the food chain.

Nunavut tundra
Plants of the Arctic tundra in Nunavut, Canada (Photo credit: Wikipedia)

The first major success in palaeoecology of this kind came with a 50-author paper using eDNA ‘bar-coding’ of permafrost from 242 sites in Siberia and Alaska IWillerslev, E. and 49 others 2014. Fifty thousand years of Arctic vegetation and megafaunal diet. Nature, v. 506, p. 47-51. doi:10.1038/nature12921). Dividing the samples into 3 time spans – 50-25, 25-15 (last glacial maximum) and younger than 15 ka – the team found these major stages in the last glacial cycle mapped an ecological change from a dry tundra dominated by abundant herbaceous plants (forbs including abundant anemones and forget-me-not), to a markedly depleted Arctic steppe ecosystem then moist tundra with woody plants and grasses dominating. They also analysed the eDNA of dung and gut contents from ice-age megafauna, such as mammoths, bison and woolly rhinos, where these were found, which showed that forbs were the mainstay of their diet. Using bones of large mammals 6 member of the team also established the timing of extinctions in the last 56 ka (Cooper, A. et al. 2015. Abrupt warming events drove Late Pleistocene Holarctic megafaunal turnover. Science, DOI: 10.1126/science.aac4315), showing 31 regional extinction pulses linked to the rapid ups and downs of climate during Dansgaard-Oeschger cycles in the run-up to the last glacial maximum. By the end of the last glacial maximum, the megafauna were highly stressed by purely climatic and ecological factors. Human predation probably finished them off.