Frozen squirrel excrement excites Pleistocene ecologists

An arctic ground squirrel (Urocitellus parryii)

Lately, North American ground squirrels have been observed hunting, dismembering and eating voles. European tree squirrels also have a side that negates their nut-nibbling popular personae. They regularly take fledglings from bird nests. No more Mr Cute Squirrel then! In fact they’ll eat just about anything, including roadkill and even washed-up dead whales. A team of forensic ecologists from Canada, Sweden, Denmark and the US has harnessed this trait into a possibly ground-breaking study of how the Yukon Territory ecosystem evolved during the Pleistocene since 700 ka ago (Murchie, T.J. and 15 others 2026. Ground squirrel coprolites preserve complex archives of ancient environmental DNA over 700,000 yearsNature Communications, v. 17, article 4868; DOI: 10.1038/s41467-026-72977-6). Between 2007 and 2021 Tyler Murchie and colleagues collected ground squirrels’ faecal pellets from 14 latrine chambers or middens in their ancient burrows in a sequence of permafrost layers at the famous Klondike goldfields. The uppermost layers were dated using the 14C method, and for samples from deeper levels – older than 50 ka – using volcanic ash layers in the frozen sediments. Fourteen of the samples spanning 17 to 700 ka ago yielded fragmentary DNA from the squirrels’ diet.

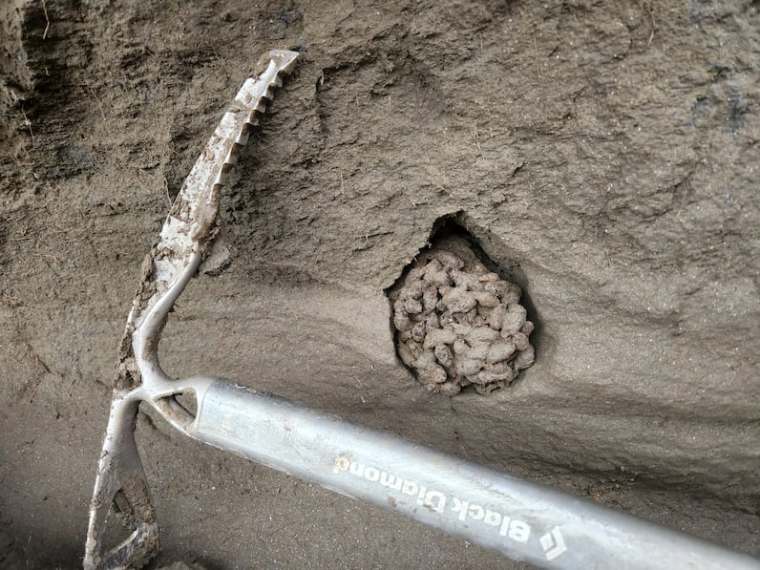
Ground-squirrel midden in tunnelled permafrost. Credit Scott Cocker, University of Alberta)

Obviously this was dominated by their own DNA and gut bacteria, but contained fragments from an astonishing range of organisms that they had eaten. There were signs of at least 200 plant species: trees, shrubs grasses and flowering herbs known from the Pleistocene ‘mammoth steppe’ and tundra. Animal DNA included that from spiders, ants, moths, beetles, and grasshoppers, together with parasitic worms. But the most astonishing range of their appetites covers a great many mammals. As well as small mammals, such as mice, there are also signs of bison, mammoths, horses, sheep, wolves, and big cats having been eaten. It hardly needs to be emphasised that the Pleistocene ground squirrels did not hunt and overwhelm such prey, but they certainly did not reject a free meal of carrion lying on the tundra.

The wealth of species unwittingly archived by ground squirrels’ tendency to hide their droppings within their burrow systems offers a novel means of tracking the evolution of the ecosystem of which they were a part. It seems to outweigh the use of DNA extraction from soil horizons or even fossil bones. But to take matters further would require many more samples spread more evenly through the history of the mammoth steppe and tundra – most of the samples are from the last 90 ka. The Klondike goldfields are not representative of the whole of Arctic North America, being in a rugged terrain. Moreover, the Yukon Territory was repeatedly glaciated, as was the Canadian Shield itself. So, intact permafrost sequences spanning even the last glacial period are rare.

See also: A snapshot in time: Ancient ground squirrel droppings, dating back 700,000 years, reveal rich details about evolutionary history of the Arctic. EurekAlert 9 June 2026.

Surface temperature self-regulated by the Earth System during the Phanerozoic

During the past 539 Ma (the Phanerozoic Eon) Earth’s geological history saw the explosion of rapidly evolving life in the oceans and on the land. The pace of that evolution swung up and down through a complex sequence of extinctions and adaptive radiations. They resulted from many intertwined inorganic changes: tectonics; impacts; igneous events; global climate change; atmosphere and sea-water composition. Although palaeoclimatic knowledge has become ever more detailed over the last few decades, its most important record, the varying temperature of the land surface and oceans, is lacking in precision. The timing of climatic events is not the issue, but the magnitude of changes in global mean surface temperature. The latter is largely down to the main tool in assessing past temperatures: the isotopic composition of oxygen (δ18O) in  marine fossils. In particular, the record for the Lower Palaeozoic has remained stubbornly odd. In the Cambrian and Ordovician Periods it implies that low-latitude seawater temperatures reached levels of 40 to 50 °C, that seem literally life threatening: phytoplankton at the base of modern marine ecosystems die at water temperatures above 35°C. Yet the fossil record is teeming throughout the Lower Palaeozoic at all latitudes. Some manner of imprecision in the oxygen-isotope method gives the impression of wild fluctuations and a dramatic overall cooling of the planet through the Phanerozoic: the temperature record as it stands seems implausible.

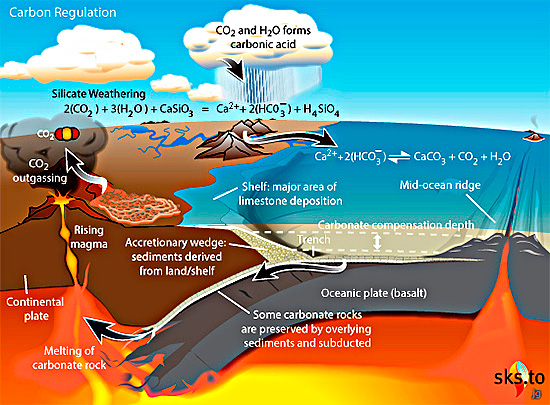
The carbonate-silicate cycle within the longer-term carbon cycle. Source: Wikimedia Commons

A group of palaeoclimatologists from China, the UK, Australia and the US have combined a variety of geochemical proxies, sedimentary records and climate modelling to correct the marine-carbonate δ18O record (Zheng, D. and 12 others 2026. Tight regulation of Earth’s long-term temperature over Phanerozoic timeNature Communications, in press 4 May 2026; DOI: 10.1038/s41467-026-72672-6). Their approach is based on a chemical index of alteration (CIA), i.e. a measure of the degree of chemical weathering of the source for sedimentary rocks. The CIA compares their content of immobile aluminium oxide (Al2O3) with calcium, sodium and potassium oxides that are more easily moved in solution. Analyses of recent river sediments show a positive correlation between CIA and local temperature, so CIA in ancient sedimentary rocks is a potential proxy for the ambient temperature of the region from which those sediments were derived. The CIA also depends on other factors, such as the intensity of physical erosion and transport. However, allowing for these factors in modern environments does not affect the correlation with ambient temperature: the method remains robust. The geochemical data from sedimentary rocks required to use CIA as an independent check on O-isotope derived temperature are available in abundance from all continents for most of the Phanerozoic.

The study by Zheng et al. suggests that throughout the Phanerozoic global mean temperature remained consistently within the 10 to 30°C range. Thus Palaeozoic ocean temperatures were comparable with those of the succeeding Mesozoic and Cenozoic Eras. The team concludes that various negative feedback processes inherent in the Earth System have been able to regulate its surface temperature through the Phanerozoic. The most important of these is climate-dependent silicate weathering in which acidic rain – produced by CO2 dissolved from the atmosphere – breaks down silicates to yield dissolved bicarbonate ions that combine with calcium and magnesium ions to precipitate carbonates. Such a process draws down the main greenhouse gas from the atmosphere. There are other aspects of the carbon cycle that also draw down atmospheric CO2 and reduce the greenhouse effect, such as burial of organic debris. Tectonics also shapes climate by modulating both silicate weathering and CO­2 emissions from volcanic activity.

It should be emphasised that anthropogenic global warming is proceeding at a far higher rate than natural negative feedback processes. We simply cannot rely on silicate weathering to reverse whatever climatic outcome results from what the current global economy does so very quickly. Yet the findings by Zheng et al. do seem likely to force a change in thinking about climate change on a geological timescale.

See also: Earth’s long-term temperature kept tight control. Scienmag; 4 May 2026
What caused the Younger Dryas frigid spell: case closed?

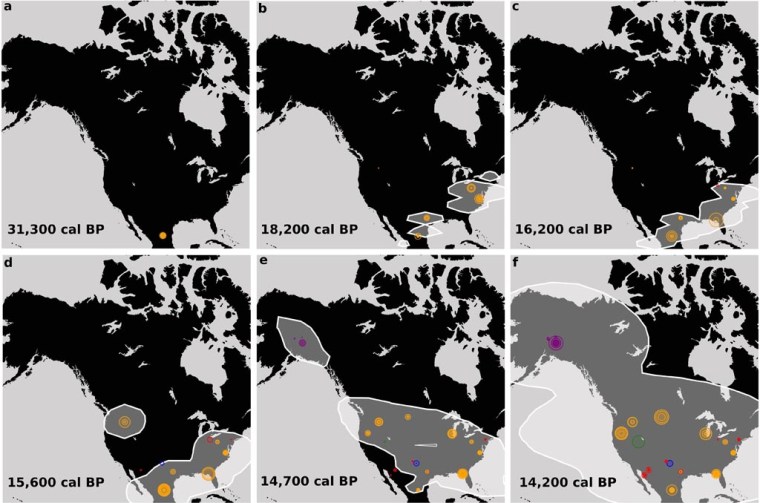
Around 20 thousand years ago, the Earth began to emerge from the grip of the Last Glacial Maximum (LGM). Huge ice sheets had locked up so much water that sea level was then about 125 m lower than it is today. At 12,870 years ago the warming and sea-level rise were reversed for 1,170 years in the Northern Hemisphere: an episode of near-full glacial conditions known as the Younger Dryas (YD). The adjectives ‘sudden’ or ‘abrupt’ grossly understate the pace of initial cooling – 3°, 6° and 15° C in North America, Europe and Greenland, respectively. Isotopic evidence from Greenland ice cores suggest that the cooling took place over three years or less. Such a degree of precision stems from the continuous annual layering in the Greenland ice cap. As far as humans were concerned, this would have been catastrophic for hunter gatherers following game northwards in Eurasia and North America as conditions ameliorated during the seven thousand years since the LGM. The archaeological record, or rather the lack of one, for what are now temperate zones suggests humans either retreated south or were blotted out.

There is no counterpart for the YD in the end stages of early glacial episodes. Some authors have suggested that it was the outcome of an appropriately catastrophic geological event, such as a large meteorite strike, as proposed in 2007 (See: Whizz-bang view of Younger Dryas; July 2007). This hypothesis gained traction in 2013, at least for its authors, with the discovery of anomalously high concentrations of the noble metal platinum (Pt) and other platinum Group metals, such as iridium (Ir) at or around the start of the YD in the GISP2 ice core. New research on this anomaly (Green, C.E. et al 2025. A possible volcanic origin for the Greenland ice core Pt anomaly near the Bølling-Allerød/Younger Dryas boundary. PLOS One, v. 20, article  e0331811; DOI: 10.1371/journal.pone.0331811) offers a different scenario. Charlotte Green of Royal Holloway, University of London and colleagues from universities in the UK, Germany and Austria examine the timing of this Pt spike and its detailed geochemistry.

The ‘killer’ observation is that the anomaly occurs in ice that formed 45 years after the onset of the Younger Dryas and has a spread of about 14 years. Whatever kind of event released the platinum, it definitely did not somehow trigger the onset of the YD. Moreover, the anomaly was significantly deficient in iridium compared with a wide range of meteorites and terrestrial igneous rocks. It also differed markedly in other elements, such as lutetium and hafnium, and in all three elements in melt rocks and ejecta sediments associated with five proven impact structures. The closest match is to volcanic gas condensates from a recent eruption of a submarine volcano near Tonga

Both the GISP2 and NGRIP cores through the Greenland ice also record a large, 12-year long spike in sulfate of volcanic origin spread across the very start of the YD. That roughly matches the age of an explosive eruption, which formed the circular Laacher See in the Eifel volcanic field in Germany. That eruption is thought to have blasted 6.3 km3 of highly alkaline magma into the atmosphere: about the magnitude of the 1991 Pinatubo eruption, but insufficient to yield the size and duration of the sulfate spike that coincides with the start of the YD. The sulfate anomaly suggests a far larger, currently unknown eruption at 12,870 years ago. The Pt and Ir data from the Laacher See event rule it out as a source for the younger Pt anomaly in the GISP2 ice core. One possibility is a nearby Icelandic subglacial fissure eruption at that time.

So, as regards what started the Younger Dryas, there is support for a very large, but so-far unknown volcanic event, and an as yet unresolved, perturbation in the Atlantic Meridional Overturning Circulation (AMOC) resulting from drainage of a huge glacial lake in northern North America (see: The Younger Dryas and the Flood; June 2006), but no support whatever for an impact event. Climatology of the distant past is always likely to be difficult to pin down. That is because, as now, it involves linkages between a large number of variables: not only physical ones, but issues of biogeochemistry, the inner Earth, the rest of the solar system and even cosmology. That is, it is as complex as human affairs and their history. Common sense, linear thinking and the like, simply will not do.

See also: Scientists solve 12,800-year-old climate mystery hidden in Greenland ice. Science Daily, 20 March 2026

The ‘boring billion’ years of the Mesoproterozoic: plate tectonics and the eukaryotes

The emergence of the eukaryotes – of which we are a late-entry member – has been debated for quite a while. In 2023 Earth-logs reportedthat a study of ‘biomarker’ organic chemicals in Proterozoic sediments suggests that eukaryotes cannot be traced back further than about 900 Ma ago using such an approach. At about the same time another biomarker study showed signs of a eukaryote presence at around 1050 Ma. Both outcomes seriously contradicted a ‘molecular-clock’ approach based on the DNA of modern members of the Eukarya and estimates of the rate of genetic mutation. That method sought to deduce the time in the past when the last eukaryotic common ancestor (LECA) appeared. It pointed to about 2 Ga ago, i.e. a few hundred million years after the Great Oxygenation Event got underway. Since eukaryote metabolism depends on oxygen, the molecular-clock result seems reasonable. The biomarker evidence does not. But were the Palaeo- and Mesoproterozoic Eras truly ‘boring’? A recent paper by Dietmar Müller and colleagues from the Universities of Sydney and Adelaide, Australia definitely shows that geologically they were far from that (Müller, R.D. et al. 2025. Mid-Proterozoic expansion of passive margins and reduction in volcanic outgassing supported marine oxygenation and eukaryogenesis. Earth and Planetary Science Letters, v. 672; DOI: 10.1016/j.epsl.2025.119683).

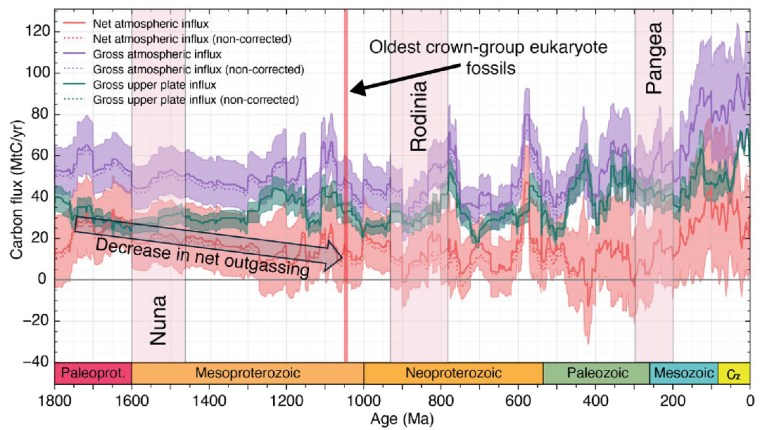
Carbon influx (million tons per year) into tectonic plates and into the ocean-atmosphere system from 1800 Ma to present. The colour bands represent: total carbon influx into the atmosphere (mauve); sequestered in tectonic plates (green); net atmospheric influx i.e. total minus carbon sequestered into plates (orange). The widths of the bands show the uncertainties of the calculated masses shown as darker coloured lines.

From 1800 to 800 Ma two supercontinents– Nuna-Columbia and Rodinia – aggregated nearly all existing continental masses, and then broke apart. Continents had collided and then split asunder to drift. So plate tectonics was very active and encompassed the entire planet, as Müller et al’s palaeogeographic animation reveals dramatically. Tectonics behaved in much the same fashion through the succeeding Neoproterozoic and Phanerozoic to build-up then fragment the more familiar supercontinent of Pangaea. Such dynamic events emit magma to form new oceanic lithosphere at oceanic rift systems and arc volcanoes above subduction zones, interspersed with plume-related large igneous provinces and they wax and wane. Inevitably, such partial melting delivered carbon dioxide to the atmosphere. Reaction on land and in the rubbly flanks of spreading ridges between new lithosphere and dissolved CO2 drew down and sequestered some of that gas in the form of solid carbonate minerals. Continental collisions raised the land surface and the pace of weathering, which also acted as a carbon sink. But they also involved metamorphism that released carbon dioxide from limestones involved in the crustal transformation. This protracted and changing tectonic evolution is completely bound up through the rock cycle with geochemical change in the carbon cycle.

From the latest knowledge of the tectonic and other factors behind the accretion and break-up of Nuna and Rodinia, Müller et al. were able to model the changes in the carbon cycle during the ‘boring billion’ and their effects on climate and the chemistry of the oceans. For instance, about 1.46 Ga ago, the total length of continental margins doubled while Nuna broke apart. That would have hugely increased the area of shallow shelf seas where living processes would have been concentrated, including the photosynthetic emission of oxygen. In an evolutionary sense this increased, diversified and separated the ecological niches in which evolution could prosper. It also increased the sequestration of greenhouse gas through reactions on the flanks of a multiplicity of oceanic rift systems, thereby cooling the planet. Translating this into a geochemical model of the changing carbon cycle (see figure) suggests that the rate of carbon addition to the atmosphere (outgassing) halved during the Mesoproterozoic. The carbon cycle and probable global cooling bound up with Nuna’s breakup ended with the start of Rodinia’s aggregation about 1000 Ma ago and the time that biomarkers first indicate the presence of eukaryotes.

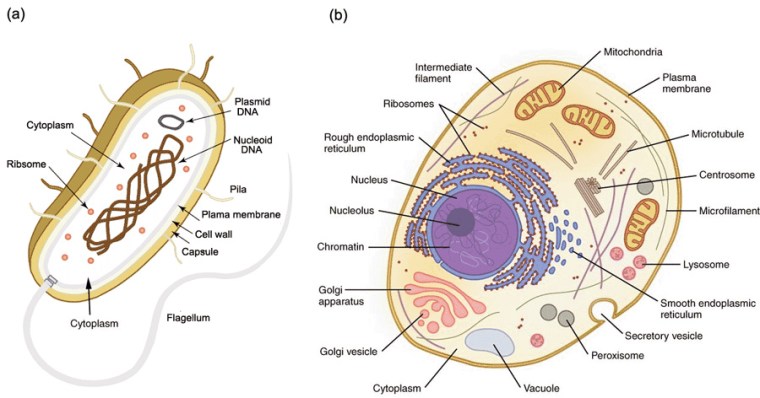
Simplified structures of (a) a prokaryote cell; (b) a simple eukaryote animal cell. Plants also contain organelles called chloroplasts

So, did tectonics play a major role in the rise of the Eukarya? Well, of course it did, as much as it was subsequently the changing background to the appearance of the Ediacaran animals and the evolutionary carnival of the Phanerozoic. But did it affect the billion-year delay of ‘eukaryogenesis’ during prolonged availability of the oxygen that such a biological revolution demanded? Possibly not. Lyn Margulis’s hypothesis of the origin of the basic eukaryote cell by a process of ‘endosymbiosis’ is still the best candidate 50 years on. She suggested that such cells were built from various forms of bacteria and archaea successively being engulfed within a cell wall to function together through symbiosis. Compared with prokaryote cells those of the eukaryotes are enormously complex. At each stage the symbionts had to be or become compatible to survive. It is highly unlikely that all components entered the relationship together. Each possible kind of cell assembly was also subject to evolutionary pressures. This clearly was a slow evolutionary process, probably only surviving from stage to stage because of the global presence of a little oxygen. But the eukaryote cell may also have been forced to restart again and again until a stable form emerged.

See also: New Clues Show Earth’s “Boring Billion” Sparked the Rise of Life. SciTechDaily, 3  November 2025

The end-Triassic mass extinction and ocean acidification

Triassic reef limestones in the Dolomites of northern Italy. Credit: © Matteo Volpone

Four out of six mass extinctions that ravaged life on Earth during the last 300 Ma coincided with large igneous events marked by basaltic flood volcanism. But not all such bursts of igneous activity match significant mass extinctions. Moreover, some rapid rises in the rate of extinction are not clearly linked to peaks in igneous activity. Another issue in this context is that ‘kill mechanisms’ are generally speculative rather than based on hard data. Large igneous events inevitably emit very large amounts of gases and dust-sized particulates into the atmosphere. Carbon dioxide, being a greenhouse gas, tends to heat up the global climate, but also dissolves in seawater to lower its pH. Both global warming and more acidic oceans are possible ‘kill mechanisms’. Volcanic emission of sulfur dioxide results in acid rain and thus a decrease in the pH of seawater. But if it is blasted into the stratosphere it combines with oxygen and water vapour to form minute droplets of sulfuric acid. These form long-lived haze, which reflects solar energy beck into space. Such an increased albedo therefore tends to cool the planet and create a so-called ‘volcanic winter’. Dust that reaches the stratosphere reduces penetration of visible light to the surface, again resulting in cooling. But since photosynthetic organisms rely on blue and red light to power their conversion of CO­2­ and water vapour to carbohydrates and oxygen, these primary producers at the base of the marine and terrestrial food webs decline. That presents a fourth kill mechanism that may trigger mass extinction on land and in the oceans: starvation.

Palaeontologists have steadily built up a powerful case for occasional mass extinctions since fossils first appear in the stratigraphic record of the Phanerozoic Eon. Their data are simply the numbers of species, genera and families of organisms preserved as fossils in packages of sedimentary strata that represent roughly equal ‘parcels’ of time (~10 Ma). Mass extinctions are now unchallengeable parts of life’s history and evolution. Yet, assigning specific kill mechanisms involved in the damage that they create remains very difficult. There are hypotheses for the cause of each mass extinction, but a dearth of data that can test why they happened. The only global die-off near hard scientific resolution is that at the end of the Cretaceous. The K-Pg (formerly K-T) event has been extensively covered in Earth-logs since 2000. It involved a mixture of global ecological stress from the Deccan large igneous event spread over a few million years of the Late Cretaceous, with the near-instantaneous catastrophe induced by the Chicxulub impact, with a few remaining dots and ticks needed on ‘i’s and ‘t’s. Other possibilities have been raised: gamma-ray bursts from distant supernovae; belches of methane from the sea floor; emissions of hydrogen sulfide gas from seawater itself during ocean anoxia events; sea-level changes etc.

The mass extinction that ended the Triassic (~201 Ma) coincides with evidence for intense volcanism in South and North America, Africa and southern Europe, then at the core of the Pangaea supercontinent. Flood basalts and large igneous intrusions – the Central Atlantic Magmatic Province (CAMP) – began the final break-up of Pangaea. The end-Triassic extinction deleted 34% of marine genera. Marine sediments aged around 201 Ma reveal a massive shift in sulfur and carbon isotopes in the ocean that has been interpreted as a sign of acute anoxia in the world’s oceans, which may have resulted in massive burial of oxygen-starved marine animal life. However, there is no sign of Triassic, carbon-rich deep-water sediments that characterise ocean anoxia events in later times. But it is possible that bacteria that use the reduction of sulfate (SO42-) to sulfide (S2-) ions as an energy source for them to decay dead organisms, could have produced the sulfur isotope ‘excursion’. That would also have produced massive amounts of highly toxic hydrogen sulfide gas, which would have overwhelmed terrestrial animal life at continental margins. The solution ofH2S in water would also have acidified the world’s oceans.

Molly Trudgill of the University of St Andrews, Scotland and colleagues from the UK, France, the Netherlands, the US, Norway, Sweden and Ireland set out to test the hypothesis of end-Triassic oceanic acidification (Trudgill, M. and 24 others 2025. Pulses of ocean acidification at the Triassic–Jurassic boundary. Nature Communications, v. 16, article 6471; DOI: 10.1038/s41467-025-61344-6). The team used Triassic fossil oysters from before the extinction time interval. Boron-isotope data from the shells are a means of estimating variations in the pH of seawater. Before the extinction event the average pH in Triassic seawater was about the same as today, at 8.2 or slightly alkaline. By 201 Ma the pH had shifted towards acidic conditions by at least 0.3: the biggest detected in the Phanerozoic record. One of the most dramatic changes in Triassic marine fauna was the disappearance of reef limestones made by the recently evolved modern corals on a vast scale in the earlier Triassic; a so-called ‘reef gap’ in the geological record. That suggests a possible analogue to the waning of today’s coral reefs that is thought to be a result of increased dissolution of CO2 in seawater and acidification, related to global greenhouse warming. Using the fossil oysters, Trudgill et al. also sought a carbon-isotope ‘fingerprint’ for the source of elevated CO2, finding that it mainly derived from the mantle, and was probably emitted by CAMP volcanism. So their discussion centres mainly on end-Triassic ocean acidification as an analogy for current climate change driven by CO2 largely emitted by anthropogenic burning of fossil fuels. Nowhere in their paper do they mention any role for acidification by hydrogen sulfide emitted by massive anoxia on the Triassic ocean floor, which hit the scientific headlines in 2020 (see earlier link).

Direct measurements of ancient atmospheric composition

For decades, research into the composition of the Earth’s early atmosphere depended on indirect means. An example is the preservation of water-worn grains of sulphides and uranium oxides in coarse terrestrial sediments older than about 2,200 Ma. Their survival on the continental surface suggested that the atmosphere before then had vanishingly low O2. Such grains would have otherwise been broken down by oxidation reactions. Younger sediments simply do not contain such detrital grains. This suggested the appearance of an oxidising atmosphere around 2.2 Ga ago: the Great Oxygenation Event. The greenhouse gases – carbon dioxide and methane – are also difficult to estimate directly, especially in the Precambrian. Once plants colonised the land surface, their photosynthesis depended on inhaling and exhaling air through stomata on the surface of leaves (see: Ancient CO2 estimates worry climatologists; January 2017). The number of stomata per unit area of a leaf surface is expected to increase with lowering of atmospheric CO2 and vice versa, which has been observed in plants grown in different air compositions. By comparing stomatal density in fossilised leaves of modern plants back to 800 ka allows the change to be calibrated against the record of CO­2 inside air bubbles trapped in ice-cores. This proxy method has given a guide to CO2 variations through the Cenozoic, Mesozoic and upper Palaeozoic Eras. However, the reliability of extinct plant leaves as proxies is suspect.

A fluid inclusion (about 0.2 mm) trapped in a crystal of halite (NaCl). Credit: alchetron.com

Is it possible to find air trapped by other means than in glacial ice? It may be. Tiny pockets of liquid and gas – fluid inclusions – are often found in minerals that crystallised at the Earth’s surface. The most common are crystals of salt (NaCl) and carbonates from ancient lake deposits. A 2019 study revealed that Late Triassic carbonates from Colorado, USA record an increase of atmospheric oxygen levels from 15 to 19% about 215 Ma ago over a period of just 3 million years as dinosaurs first spread into North America, then at equatorial latitudes in the Pangaea supercontinent. This sudden increase in the availability of oxygen may also be linked to the trend towards larger and larger dinosaurs worldwide.  Going further back in time trace-metal chemistry of 1,400 Ma old marine sediments from China indicates oxygenated water that suggests an atmospheric oxygen level greater than 4% of that at present. Small as that might seem, it would have been sufficient to sustain animal respiration about half a billion years before the first evidence for the earliest animals. Further work on ancient salt and carbonate deposits confirms much higher oxygen levels  than geochemists have expected previously.

Source: Voosen, P, 2025. Earth’s rocks hold whiffs of air from billions of years ago. Science, v.387, articlezhst73x; DOI: 10.1126/science.zhst73x

Modelling climate change since the Devonian

A consortium of geoscientists from Australia, Britain and France, led by Andrew Merdith of the University of Adelaide examines the likely climate cooling mechanisms that may have set off the two great ‘icehouse’ intervals in the last 541 Ma (Merdith, A.S. et al. 2025. Phanerozoic icehouse climates as the result of multiple solid-Earth cooling mechanisms. Science Advances, v. 11, article eadm9798: DOI: 10.1126/sciadv.adm9798). They consider the first to be the global cooling that began in the latter part of the Devonian culminating in the Carboniferous-Permian icehouse. The second is the Cenozoic global cooling to form the permanent Antarctic ice cap around 34 Ma and culminated in cyclical ice ages on the northern continents after 2.4 Ma during the Pleistocene. They dismiss the 40 Ma long, late Ordovician to early Silurian glaciation that left its imprint on North Africa and South America –  then combined in the Gondwana supercontinent. The data about two of the parameters used in their model – the degree of early colonisation of the continents by plants and their influence on terrestrial weathering are uncertain in that protracted event.  Yet the Hirnantian glaciation reached 20°S at its maximum extent in the Late Ordovician around 444 Ma to cover about a third of Gondwana: it was larger than the present Antarctic ice cap. For that reason, their study spans only Devonian and later times.

Fluctuation in evidence for the extent of glacial conditions since the Devonian: the ‘ice line’ is grey. The count of glacial proxy occurrences in each 10° of latitude through time is shown in the colour key. Credit: Merdith et al., Fig 2A.

Merdith et al. rely on four climatic proxies. The first of these comprises indicators of cold climates, such as glacial dropstones, tillites and evidence in sedimentary rocks of crystals of hydrated calcium carbonate (ikaite – CaCO3.6H2O) that bizarrely forms only at around 0°C . From such occurrences it is possible to define an ‘ice line’ linking different latitudes through geological time. Then there are estimates of global average surface temperature; low-latitude sea surface temperature; and estimates of atmospheric CO2. The ‘ice-line’ data records an additional, long period of glaciation in the Jurassic and early Cretaceous, but evidence does not extend to latitudes lower than 60°. It is regarded by Merdith et al. as an episode of ‘cooling’ rather than an ‘icehouse’. Their model assesses sources and sinks of COsince the Devonian Period.

The main natural source of the principal greenhouse gas CO2 is degassing through volcanism expelled from the mantle and breakdown of carbonate rock in subducted lithosphere. Natural sequestration of carbon involves weathering of exposed rock that releases dissolved CO2 and ions of calcium and magnesium.   A recently compiled set of plate reconstructions that chart the waxing and waning of tectonics since the Devonian Period allows them to model the tectonically driven release of carbon over time, with time scales on the order of tens to hundreds of Ma. The familiar Milanković forcing cycles on the order of tens to hundreds of ka are thus of no significance in Merdith et al.’s  broader conception of icehouse episodes  Their modelling shows high degassing during the Cretaceous, modern levels during the late Palaeozoic and early Mesozoic, and low emissions during the Devonian. The model also suggests that cooling stemmed from variations in the positions and configuration of continents over time.  Another crucial factor is the tempo of exposure of rocks that are most prone to weathering. The most important are rocks of the ocean lithosphere incorporated into the continents to form ophiolite masses. The release of soluble products of weathering into ocean basins through time acts as a fluctuating means of ‘fertilising’ so that more carbon can be sequestered in deep sediments in the form of organisms’ unoxidised tissue and hard parts made of calcium carbonates and phosphates. Less silicate weathering results in a boost to atmospheric CO2.

Only two long, true icehouse episodes emerge from the empirical proxy data, expressed by the ‘ice-line’ plots. Restricting the modelling to single global processes that might be expected to influence degassing or carbon sequestration produces no good fits to the climatic proxy data. Running the model with all the drivers “off” produces more or less continuous icehouse conditions since the Devonian. The model’s climate-related outputs thus imply that many complex processes working together in syncopation may have driven the gross climate vagaries over the last 400 Ma or so. A planet of Earth’s size without such complexity would throughout that period have had a high-CO2 warm climate. According to Andrew Merdith its fluctuation from greenhouse to icehouse conditions in the late Palaeozoic and the Cenozoic were probably due to “coincidental combination of very low rates of global volcanism, and highly dispersed continents with big mountains, which allow for lots of global rainfall and therefore amplify reactions that remove carbon from the atmosphere”.

Geological history is, almost by definition, somewhat rambling. So, despite despite the large investment in seeking a computed explanation of data drawn from the record, the outcome reflects that in a less than coherent account. To state that many complex processes working at once may have driven climate vagaries over the last 400 Ma or so, is hardly a major advance: palaeoclimatologists have said more or less the same for a couple of decades or more, but have mainly proposed single driving mechanisms. One aspect of Merdith et al.’s  results seems to be of particular interest. ‘Icehouse’ conditions seem to be rare events interspersed with broader ice-free periods. We evolved within the mammal-dominated ecosystems on the continents during the latest of these anomalous climatic episodes. And we and those ecosystems now rely on a cool world. As the supervisor of the project commented, ‘Over its long history, the Earth likes it hot, but our human society does not’.

Readers may like to venture into how some philosophers of science deal with a far bigger question; ‘Is intelligent life a rare, chance event throughout the universe?’ That is, might we be alone in the cosmos? In the same issue of Science Advances is a paper centred on just such questions (Mills, D.B. et al. 2025. A reassessment of the “hard-steps” model for the evolution of intelligent life. Science Advances, v. 11, article eads5698; DOI: 10.1126/sciadv.ads5698). It stems from cosmologist Brandon Carter’s ‘Anthropic Principle’ first developed at Nicolas Copernicus’s 500th birthday celebrations in 1973. This has since been much debated by scientists and philosophers – a gross understatement as it knocks the spots off the Drake Equation. To take the edge off what seems to be a daunting task, Mills et al. consider a corollary of the Anthropic Principle, the ‘hard steps model’. That, in a nutshell, postulates that the origin of humanity and its ability to ponder on observations of the universe required a successful evolutionary passage through a number of hard steps. It predicts that such intelligence is ‘exceedingly rare’ in the universe. Icehouse conditions are respectable candidates for evolutionary ‘hard steps’, and in the history of Earth there have been five of them.

A fully revised edition of Steve Drury’s book Stepping Stones: The Making of Our Home World can now be downloaded as a free eBook

How changes in the Earth System have affected human evolution, migration and culture

Refugees from the Middle East migrating through Slovenia in 2015. Credit: Britannica

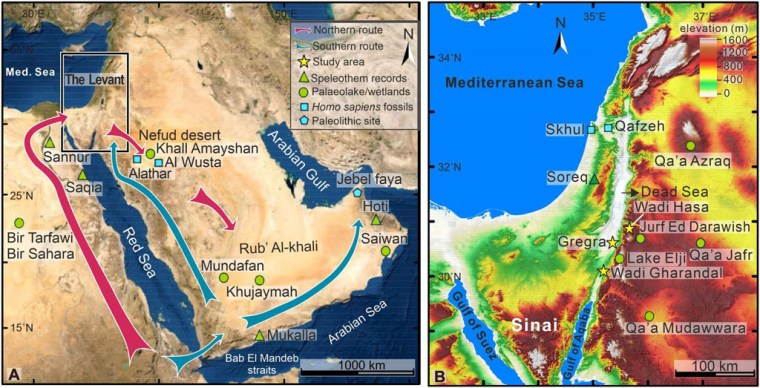
During the Pliocene (5.3 to 2.7 Ma) there evolved a network of various hominins, with their remains scattered across both the northern and southern parts of that continent. The earliest, though somewhat disputed hominin fossil Sahelanthropus tchadensis hails from northern Chad and lived  around 7 Ma ago, during the late Miocene, as did a similarly disputed creature from Kenya Orrorin tugenensis (~5.8 Ma). The two were geographically separated by 1500 km, what is now the Sahara desert and the East African Rift System.  The suggestion from mtDNA evidence that humans and chimpanzees had a common ancestor, the uncertainty about when it lived (between 13 to 5 Ma) and what it may have looked like, let alone where it lived, makes the notion debateable. There is even a possibility that the common ancestor of humans and the other anthropoid apes may have been European. Its descendants could well have crossed to North Africa when the Mediterranean Sea had been evaporated away to form the thick salt deposits that now lie beneath it: what could be termed the ‘Into Africa’ hypothesis. The better known Pliocene hominins were also widely distributed in the east and south of the African continent. Wandering around was clearly a hominin predilection from their outset. The same can be said about humans in the general sense (genus Homo) during the Early Pleistocene when some of them left Africa for Eurasia. Artifacts dated at 2.1 Ma have been found on the Loess Plateau of western China, and Georgia hosts the earliest human remains known from Eurasia. Since them H. antecessor, heidelbergensis, Neanderthals and Denisovans roamed Eurasia. Then, after about 130 ka, anatomically modern humans progressively populated all continents, except Antarctica, to their geographic extremities and from sea level to 4 km above it.

There is a popular view that curiosity and exploration are endemic and perhaps unique to the human line: ‘It’s in our genes’. But even plants migrate, as do all animal species. So it is best to be wary of a kind of hominin exceptionalism or superior motive force. Before settled agriculture, simply diffusion of populations in search of sustenance could have achieved the enormous migrations undertaken by all hominins: biological resources move and hunter gatherers follow them. The first migration of Homo erectus from Africa to northern China by way of Georgia seems to taken 200 ka at most and covered about ten thousand kilometres: on average a speed of only 50 m per year! That achievement and many others before and later were interwoven with the evolution of brain size, cognitive ability, means of communication and culture. But what were the ultimate drivers? Two recent papers in the journal Nature Communications make empirically-based cases for natural forces driving the movement of people and changes in demography.

The first considers hominin dispersal in the Palaearctic biogeographic realm: the largest of eight originally proposed by Alfred Russel Wallace in the late 19th century that encompasses the whole of Eurasia and North Africa (Zan, J. et al. 2024. Mid-Pleistocene aridity and landscape shifts promoted Palearctic hominin dispersals. Nature Communications, v. 15, article 10279; DOI: 10.1038/s41467-024-54767-0). The Palearctic comprises a wide range of ecosystems: arid to wet, tropical to arctic. After 2 Ma ago, hominins moved to all its parts several times. The approach followed by Zan et al. is to assess the 3.6 Ma record of the thick deposits of dust carried by the perpetual westerly winds that cross Central Asia. This gave rise to the huge (635,000 km2) Loess Plateau. At least 17 separate soil layers in the loess have yielded artefacts during the last 2.1 Ma. The authors radiocarbon dated the successive layers of loess in Tajikistan (286 samples) and the Tarim Basin (244 samples) as precisely as possible, achieving time resolutions of 5 to 10 ka and 10 to 20 ka respectively. To judge variations in climate in these area they also measured the carbon isotopic proportions in organic materials preserved within the layers. Another climate-linked metric that Zan et al. is a time series showing the development of river terraces across Eurasia derived from the earlier work of many geomorphologists. The results from those studies are linked to variations through time in the numbers of archaeological sites across Eurasia that have yielded hominin fossils, stone tools and signs of tool manufacture, many of which have been dated accurately.

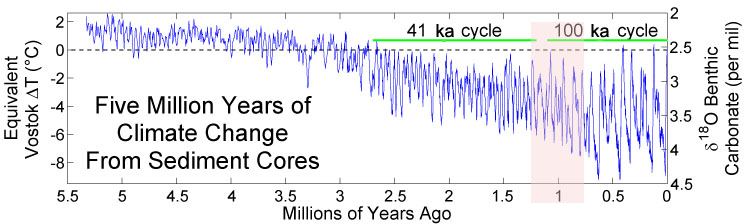
The authors use sophisticated statistics to find correlations between times of climatic change and the signs of hominin occupation. Episodes of desertification in Palaearctic Eurasia clearly hindered hominins’ spreading across the continent either from west to east of vice versa. But there were distinct, periodic windows of climatic opportunity for that to happen that coincide with interglacial episodes, whose frequency changed at the Mid Pleistocene Transition (MPT) from about 41 ka to roughly every 100 ka. That was suggested in 2021 to have arisen from an increased roughness of the rock surface over which the great ice sheets of the Northern Hemisphere moved. This suppressed the pace of ice movement so that the 41 ka changes in the tilt of the Earth’s rotational axis could no longer drive climate change during the later Pleistocene, despite the fact that the same astronomical influence continued. The succeeding ~100 ka pulsation may or may not have been paced by the very much weaker influence of Earth changing orbital eccentricity. Whichever, after the MPT climate changes became much more extreme, making human dispersal in the Palearctic realm more problematic. Rather than hominin’s evolution driving them to a ‘Manifest Destiny’ of dominating the world vastly larger and wider inorganic forces corralled and released them so that, eventually, they did.

Much the same conclusion, it seems to me, emerges from a second study that covers the period since ~ 9 ka ago when anatomically modern humans transitioned from a globally dominant hunter-gatherer culture to one of ‘managing’ and dominating ecosystems, physical resources and ultimately the planet itself. (Wirtz, K.W et al. 2024. Multicentennial cycles in continental demography synchronous with solar activity and climate stability. Nature Communications, v. 15, article 10248; DOI: 10.1038/s41467-024-54474-w). Like Zan et al., Kai Wirtz and colleagues from Germany, Ukraine and Ireland base their findings on a vast accumulated number (~180,000) of radiocarbon dates from Holocene archaeological sites from all inhabited continents. The greatest number (>90,000) are from Europe. The authors applied statistical methods to judge human population variations since 11.7 ka in each continental area. Known sites are probably significantly outweighed by signs of human presence that remain hidden, and the diligence of surveys varies from country to country and continent to continent: Britain, the Netherlands and Southern Scandinavia are by far the best surveyed. Given those caveats, clearly this approach gives only a blurred estimate of population dynamics during the Holocene. Nonetheless the data are very interesting.

The changes in population growth rates show distinct cyclicity during the Holocene, which Wirtz et al. suggest are signs of booms and busts in population on all six continents. Matching these records against a large number of climatic time series reveals a correlation. Their chosen metric is variation in solar irradiance: the power per unit area received from the Sun. That has been directly monitored only over a couple of centuries. But ice cores and tree rings contain proxies for solar irradiance in the proportions of the radioactive isotopes 10Be and 14C contained in them respectively. Both are produced by the solar wind of high-energy charged particles (electrons, protons and helium nuclei or alpha particles) penetrating the upper atmosphere. The two isotopes have half-lives long enough for them to remain undecayed and thus detectable for tens of thousand years. Both ice cores and tree rings have decadal to annual time resolutions. Wirtz et al. find that their crude estimates of booms and busts in human populations during the Holocene seem closely to match variations in solar activity measured in this way. Climate stability favours successful subsistence and thus growth in populations. Variable climatic conditions seem to induce subsistence failures and increase mortality, probably through malnutrition.

A nice dialectic clearly emerges from these studies. ‘Boom and bust’ as regards populations in millennial and centennial to decadal terms stem from climate variations. Such cyclical change thus repeatedly hones natural selection among the survivors, both genetically and culturally, increasing their general fitness to their surroundings. Karl Marx and Friedrich Engels would have devoured these data avidly had they emerged in the 19th century. I’m sure they would have suggested from the evidence that something could go badly wrong – negation of negation, if readers care to explore that dialectical law further . . . And indeed that is happening. Humans made ecologically very fit indeed in surviving natural pressures are now stoking up a major climatic hiccup, or rather the culture and institutions that humans have evolved are doing that.

Divining the possible climatic impacts of slowing North Atlantic current patterns

Meltwater channels and lake on the surface of the Greenland ice sheet

In August 2024 Earth-Logs reported on the fragile nature of thermohaline circulation of ocean water. The post focussed on the Atlantic Meridional Overturning Circulation (AMOC), whose fickle nature seems to have resulted in a succession of climatic blips during the last glacial-interglacial cycle since 100 ka ago. They took the form of warming-cooling cycles known as Dansgaard-Oeschger events, when the poleward movement of warm surface water in the North Atlantic Ocean was disrupted. An operating AMOC normally drags northwards warm water from lower latitudes, which is more saline as a result of evaporation from the ocean surface there. Though it gradually cools in its journey it remains warmer and less dense than the surrounding surface water through which it passes: it effectively ‘floats’. But as the north-bound, more saline stream steadily loses energy its density increases. Eventually the density equals and then exceeds that of high-latitude surface water, at around 60° to 70°N, and sinks. Under these conditions the AMOC is self-sustaining and serves to warm the surrounding land masses by influencing climate. This is especially the case for the branch of the AMOC known as the Gulf Stream that today swings eastwards to ameliorate the climate of NW Europe and Scandinavia as far as Norway’s North Cape and into the eastern Arctic Ocean.

The suspected driving forces for the Dansgaard-Oeschger events are sudden massive increases in the supply of freshwater into the Atlantic at high northern latitudes, which dilute surface waters and lower their density. So it becomes more difficult for surface water to become denser on being cooled so that it can sink to the ocean floor. The AMOC may weaken and shut down as a result and so too its warming effect at high latitudes. It also has a major effect on atmospheric circulation and moisture content: a truly complicated climatic phenomenon. Indeed, like the Pacific El Niño-Southern Oscillation (ENSO), major changes in AMOC may have global climatic implications.  QIyun Ma of the Alfred Wegner Institute in Bremerhaven, Germany and colleagues from Germany, China and Romania have modelled how the various possible locations of fresh water input may affect AMOC (Ma, Q. et al. 2024. Revisiting climate impacts of an AMOC slowdown: dependence on freshwater locations in the North Atlantic. Science Advances, v. 10, article eadr3243; DOI: 10.1126/sciadv.adr3243). They refer to such sudden inputs as ‘hosing’!

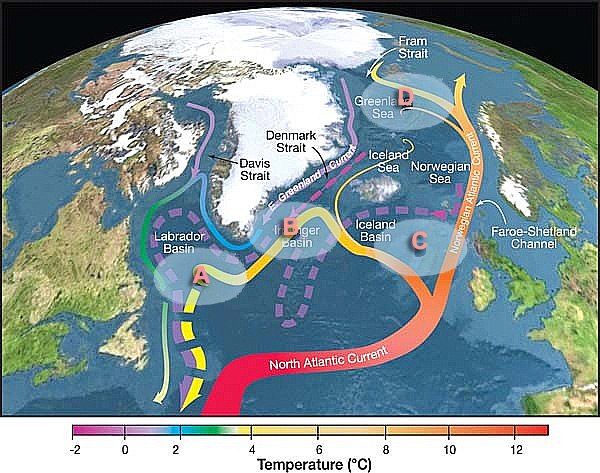
Location of the 4 regions in the northern North Atlantic used by Ma et al. in their modelling of AMOC: A Labrador Sea; B Irminger Basin; C NE Atlantic; D Nordic Seas. Colour chart refers to current temperature. Solid line – surface currents, dashed line – deep currents

First, the likely consequences under current climatic conditions of such ‘hosings’ and AMOC collapses are: a rapid expansion of the Arctic Ocean sea ice; delayed onset of summer ice-free conditions; southward shift of the Intertropical Convergence Zone (ITCZ) –  a roughly equatorial band of low pressure where the NE and SE trade winds converge, and the rough location of the sometimes windless Doldrums. There have been several attempts to model the general climatic effects of an AMOC slowdown. Ma et al. take matters a step further by using the Alfred Wegener Institute Climate Model (AWI-CM3) to address what may happen following ‘hosing’ in four regions of the North Atlantic: the Labrador Sea (between Labrador and West Greenland); the Irminger Basin (SE of East Greenland, SW of Iceland); the Nordic Seas (north of Iceland; and the Greenland-Iceland-Norwegian seas) and the NE Atlantic (between Iceland, Britain and western Norway).

Prolonged freshwater flow into the Irminger Basin has the most pronounced effect on AMOC weakening, largely due to a U-bend in the AMOC where the surface current changes from northward to south-westward flow parallel to the East Greenland Current. The latter carries meltwater from the Greenland ice sheet whose low density keeps it near the surface. In turn, this strengthens NE and SW winds over the Labrador Sea and Nordic Seas respectively, which slow this part of the AMOC. In turn that complex system slows the entire AMOC further south. Since 2010 an average 270 billion tonnes of ice has melted in Greenland each year. This results in an annual 0.74 mm rise in global sea level, so the melted glacial ice is not being replenished. When sea ice forms it does not take up salt and is just as fresh as glacial ice. Annual melting of sea ice therefore temporarily adds fresh water to surface waters of the Arctic Ocean, but the extent of winter sea ice is rapidly shrinking. So, it too adds to freshening and lowering the density of the ocean-surface layer. The whole polar ocean ‘drains’ southwards by surface currents, mainly along the east coast of Greenland potentially to mix with branches of the AMOC. At present they sink with cooled more saline water to move at depth. To melting can be added calving of Greenlandic glaciers to form icebergs that surface currents transport southwards. A single glacier (Zachariae Isstrom) in NE Greenland lost 160 billion tonnes of ice between 1999 and 2022. Satellite monitoring of the Greenland glaciers suggests that a trillion tonnes have been lost through iceberg formation during the first quarter of the 21st century. Accompanying the Dansgaard-Oeschger events of the last 100 ka were iceberg ‘armadas’ (Heinrich events) that deposited gravel in ocean-floor sediments as far south as Portugal.

 The modelling done by Ma et al. also addresses possible wider implications of their ‘hosing’ experiments to the global climate. The authors caution that this aspect is an ‘exploration’ rather than prediction. Globally increased duration of ‘cold extremes’ and dry spells, and the intensity of precipitation may ensue from downturns and potential collapse of AMOC. Europe seems to be most at risk. Ma et al. plea for expanded observational and modelling studies focused on the Irminger Basin because it may play a critical role in understanding the mechanisms and future strength of the AMOC.

 See also: Yirka, R. 2024. Greenland’s meltwater will slow Atlantic circulation, climate model suggests. Phys Org, 21 November 2024

The prospect of climate chaos following major volcano eruptions

It hardly needs saying that volcanoes present a major hazard to people living in close proximity. The inhabitants of the Roman cities of Herculaneum and Pompeii in the shadow of Vesuvius were snuffed out by an incandescent pyroclastic during the 79 CE eruption of the volcano. Since December 2023 long-lasting eruptions from the Sundhnúksgígar crater row on the Reykjanes Penisula of Iceland have driven the inhabitants of nearby Grindavík from their homes, but no injuries or fatalities have been reported. Far worse was the 1815 eruption of Tambora on Sumbawa, Indonesia, when at least 71,000 people perished. But that event had much wider consequences, which lasted into 1817 at least. As well as an ash cloud the huge plume from Tambora injected 28 million tons of sulfur dioxide into the stratosphere. In the form of sulfuric acid aerosols, this reflected so much solar energy back into space that the Northern Hemisphere cooled by 1° C, making 1816 ‘the year without a summer’. Crop failures in Europe and North America doubled grain prices, leading to widespread social unrest and economic depression. That year also saw unusual weather in India culminate in a cholera outbreak, which spread to unleash the 1817 global pandemic. Tambora is implicated in a global death toll in the tens of millions. Thanks to the record of sulfur in Greenland ice cores it has proved possible to link past volcanic action to historic famines and epidemics, such as the Plague of Justinian in 541 CE. If they emit large amounts of sulfur gases volcanic eruptions can result in sudden global climatic downturns.

The ash plume towering above Pinatubo volcano in the Philippines on 12 June 1991, which rose to 40 km (Credit: Karin Jackson U.S. Air Force)

With this in mind Markus Stoffel, Christophe Corona and Scott St. George of the University of Geneva, Switzerland, CNRS, Grenoble France and global insurance brokers WTW, London, respectively, have published a Comment in Nature warning of this kind of global hazard (Stoffel, M., Corona, C. & St. George, S. 2024.  The next massive volcano eruption will cause climate chaos — we are unprepared. Nature v. 635, p. 286-289; DOI: 10.1038/d41586-024-03680-z). The crux of their argument is that there has been nothing approaching the scale of Tambora for the last two centuries. The 1991 eruption of Pinatubo fed the stratosphere with just over a quarter of Tambora’s complement of SO2, and decreased global temperatures by around 0.6°C during 1991-2. Should one so-called Decade Volcanoes – those located in densely populated areas, such as Vesuvius – erupt within the next five years actuaries at Lloyd’s of London estimate economic impacts of US$ 3 trillion in the first year and US$1.5 trillion over the following years. But that is based on just the local risk of ash falls, lava and pyroclastic flows, mud slides and lateral collapse, not global climatic effects. So, a Tambora-sized or larger event is not countenanced by the world’s most famous insurance underwriter: probably because its economic impact is incalculable. Yet the chances of such a repeat certainly are conceivable. A 60 ka record of sulfate in the Greenland ice cores allows the probability of eruptions on the scale of Tambora to be estimated. The data suggest that there is a one-in-six chance that one will occur somewhere during the 21st century, but not necessarily at a site judged by volcanologists to be precarious . Nobody expected the eruption from the Pacific Ocean floor of the Hunga Tonga-Hunga Ha’apai volcano on January 15, 2022: the largest in the last 30 years.

The authors insist that climate-changing eruptions now need to be viewed in the context of anthropogenic global warming. Superficially, it might seem that a few volcanic winters and years without a summer could be a welcome, albeit short-term, solution. However, Stoffel, Corona and St. George suggest that the interaction of a volcano-induced global cooling with climatic processes would probably be very complex. Global warming heats the lower atmosphere and cools the stratosphere. Such steady changes will affect the height to which explosive volcanic plumes may reach. Atmospheric circulation patterns are changing dramatically as the weather of 2024 seems to show. The same may be said for ocean currents that are changing as sea-surface temperatures increase. Superimposing volcano-induced cooling of the sea surface adds an element of chaos to what is already worrying. What if a volcanic winter coincided with an el Niño event? The Intergovernmental Panel on Climate Change that projects climate changes is ‘flying blind’ as regards volcanic cooling. Another issue is that our knowledge of the effects in 1815 of Tambora concerned a very different world from ours: a global population then that was eight times smaller than now; very different patterns of agriculture and habitation; a world with industrial production on a tiny proportion of the continental surface. Stoffel, Corona and St. George urge the IPCC to shed light on this major blind spot. Climate modellers need to explore the truly worst-case scenarios since a massive volcanic eruption is bound to happen one day. Unlike global warming from greenhouse-gas emission, there is absolutely nothing that can be done to avert another Tambora.

Climate changes and the mass extinction at Permian-Triassic boundary

The greatest mass extinction in Earth’s history at around 252 Ma ago snuffed out 81% of marine animal species, 70% of vertebrates and many invertebrates that lived on land. It is not known how many land plants were removed, but the complete absence of coals from the first 10 Ma of the Early Triassic suggests that luxuriant forests that characterised low-lying humid area in the Permian disappeared. A clear sign of the sudden dearth of plant life is that Early Triassic river sediments were no longer deposited by meandering rivers but by braided channels. Meanders of large river channels typify land surfaces with abundant vegetation whose root systems bind alluvium. Where vegetation cover is sparse, there is little to constrain river flow and alluvial erosion, and wide braided river courses develop (see: End-Permian devastation of land plants; September 2000. You can follow 21st century developments regarding the P-Tr extinction using the Palaeobiology index).

The most likely culprit was the Siberian Trap flood basalts effusion whose lavas emitted huge amounts of CO2 and even more through underground burning of older coal deposits (see: Coal and the end-Permian mass extinction; March 2011) which triggered severe global warming. That, however, is a broad-brush approach to what was undoubtedly a very complex event. Of about 20 volcanism-driven global warming events during the Phanerozoic only a few coincide with mass extinctions. Of those none comes close the devastation of ‘The Great Dying’, which begs the question, ‘Were there other factors at play 252 Ma ago?’ That there must have been is highlighted by the terrestrial extinctions having begun significantly earlier than did those in marine ecosystems, and they preceded direct evidence for climatic warming. Also temperature records – obtained from shifts in oxygen isotopes held in fossils – for that episode are widely spaced in time and tell palaeoclimatologists next to nothing about the details of the variation of air- and sea-surface temperature (SST) variations.

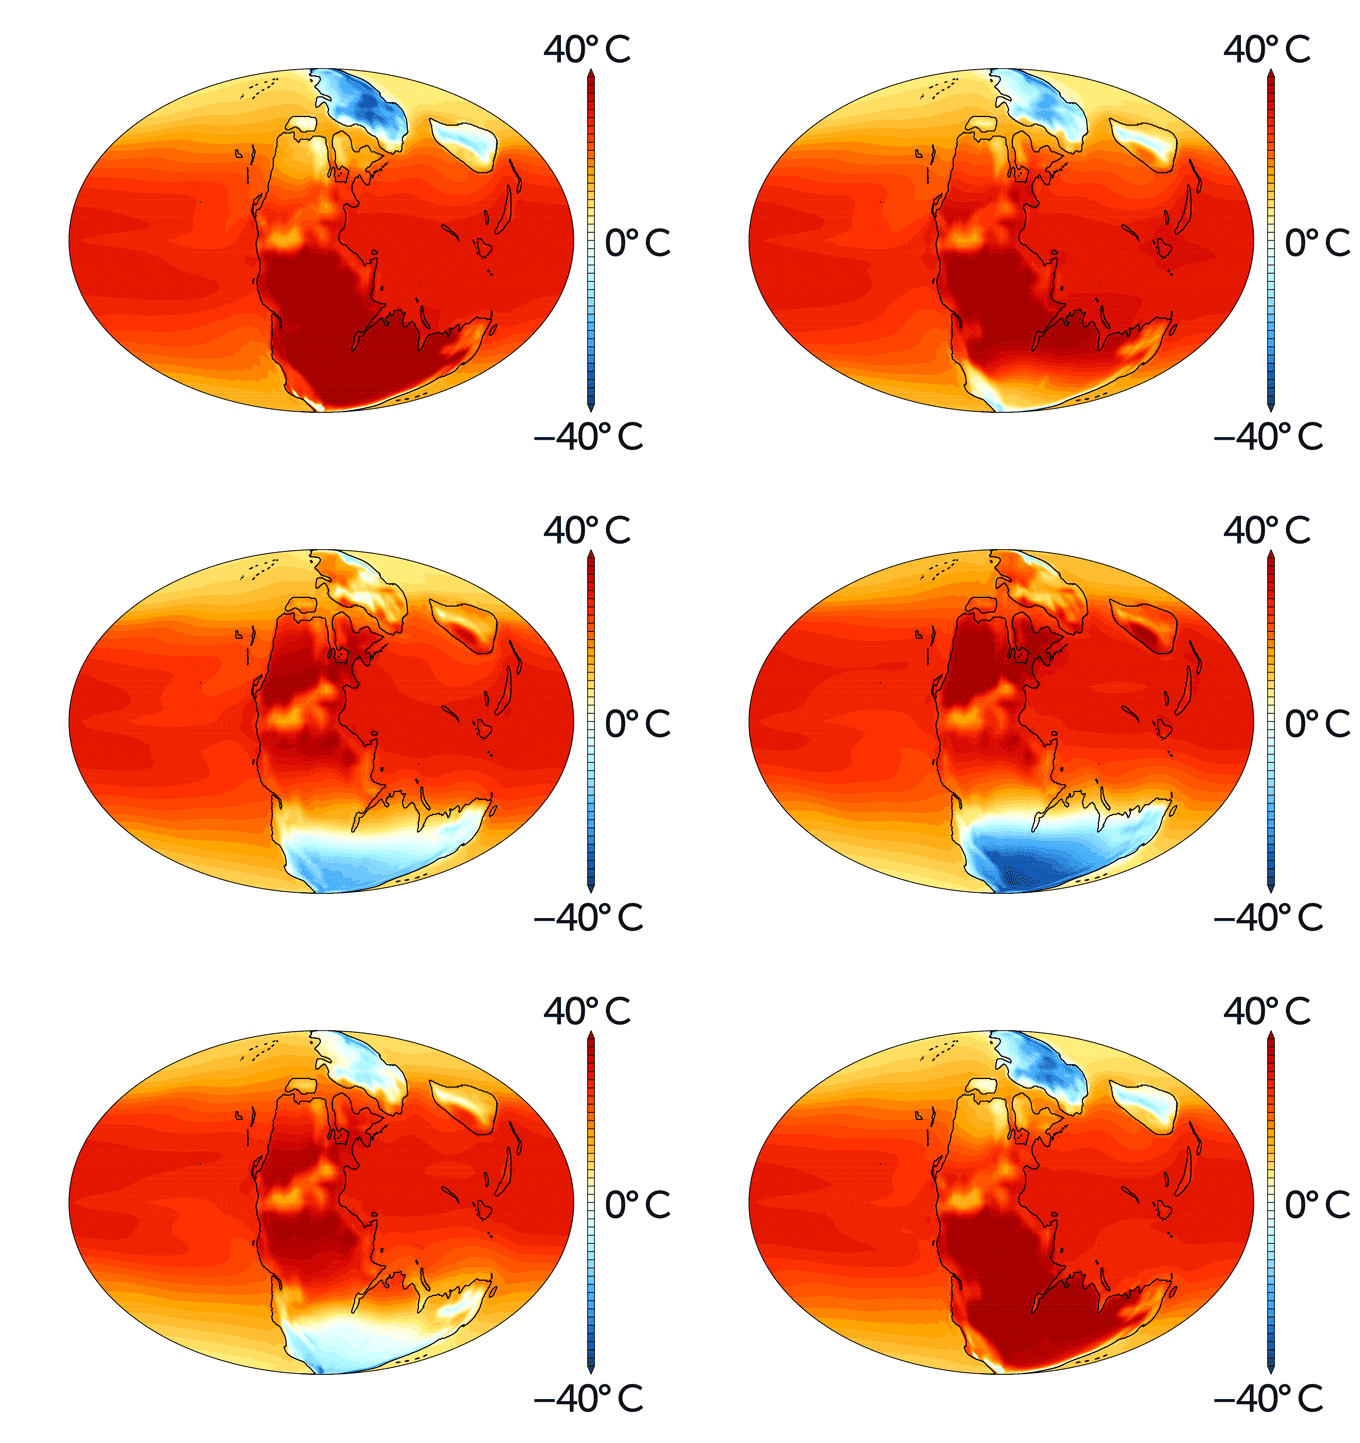
Modelled sea-surface temperatures in the tropics in the early stages of Siberian Trap eruptions with atmospheric CO¬2 at 857 ppm – twice today’s level. (Credit: Sun et al., Fig. 1A)

Earth at the end of the Permian was very different from its current wide dispersal of continents and multiple oceans and seas. Then it was dominated by Pangaea, a single supercontinent that stretched almost from pole to pole, and a surrounding vast ocean known as Panthalassa. Geoscientists from China, Germany, Britain and Austria used this simple palaeogeography and the available Early Triassic greenhouse-gas and  palaeo-temperature data as input to a climate prediction model (HadCM3BL) (Yadong Sun and 7 others 2024. Mega El Niño instigated the end-Permian mass extinction. Science 385, p. 1189–1195; DOI: 10.1126/science.ado2030  – contact yadong.sun@cug.edu.cn for PDF).. The computer model was developed by the Hadley Centre of the UK Met Office to assess possible global outcomes of modern anthropogenic global warming. It assesses heat transport by atmospheric flow and ocean currents and their interactions. The researchers ran it for various levels of atmospheric CO2 concentrations over the estimate 100 ka duration of the P-Tr mass extinction.

The pole-to-pole continental configuration of Pangaea lends itself to equatorial El Niño and El Niña type climatic events that occur today along the Pacific coast of the Americas, known as the El Niño-Southern Oscillation. In the first, warm surface water builds-up in the eastern tropical Pacific Ocean. It then then drifts westwards to allow cold surface water to flow northwards along the Pacific shore of South America to result in El Niña. Today, this climatic ‘teleconnection’ not only affects the Americas but also winds, temperature and precipitation across the whole planet. The simpler topography at the end of the Permian seems likely to have made such global cycles even more dominant.

Sun et al’s simulations used stepwise increases in the atmospheric concentration of CO2 from an estimated  412 parts per million (ppm) before the eruption of the Siberian Traps (similar to those today) to a maximum of 4000 ppm during the late-stage magmatism that set buried coals ablaze. As levels reached 857 ppm SSTs peaked at 2 °C above the mean level during El Niño events and the cycles doubled in length. Further increase in emissions led to greater anomalies that lasted longer, rising to 4°C above the mean at 4000 ppm. The El Niña cooler parts of the cycle steadily became equally anomalous and long lasting. This amplification of the 252 Ma equivalent of the El Niño-Southern Oscillation would have added to the environmental stress of an ever increasing global mean surface temperature.  The severity is clear from an animation of mean surface temperature change during a Triassic ENSO event.

Animation of monthly average surface temperatures across the Earth during an ENSO event at the height of the P-Tr mass extinction. (Credit: Alex Farnsworth, University of Bristol, UK)

The results from the modelling suggest increasing weather chaos across the Triassic Earth, with the interior of Pangaea locked in permanent drought. Its high latitude parts would undergo extreme heating and then cooling from 40°C to -40°C during the El Niño- El Niña cycles. The authors suggest that conditions on the continents became inimical for terrestrial life, which would be unable to survive even if they migrated long distances. That can explain why terrestrial extinctions at the P-Tr boundary preceded those in the global ocean. The marine biota probably succumbed to anoxia (See: Chemical conditions for the end-Permian mass extinction; November 2008)

There is a timely warning here. The El Niño-Southern Oscillation is becoming stronger, although each El Niño is a mere 2 years long at most, compared with up to 8 years at the height of the P-Tr extinction event. But it lay behind the record 2023-2024 summer temperatures in both northern and southern hemispheres, the North American heatwave of June 2024 being 15°C higher than normal. Many areas are now experiencing unprecedentedly severe annual wildfires. There also finds a parallel with conditions on the fringes of Early Triassic Pangaea. During the early part of the warming charcoal is common in the relics of the coastal swamps of tropical Pangaea, suggesting extensive and repeated wildfires. Then charcoal suddenly vanishes from the sedimentary record: all that could burn had burnt to leave the supercontinent deforested.

See also: Voosen, P. 2024. Strong El Niños primed Earth for mass extinction. Science 385, p. 1151; DOI: 10.1126/science.z04mx5b; Buehler, J. 2024. Mega El Niños kicked off the world’s worst mass extinction. ScienceNews, 12 September 2024.

The gross uncertainty of climate tipping points

That the Earth has undergone sudden large changes is demonstrated by all manner of geoscientific records. It seems that many of these catastrophic events occurred whenever steady changes reach thresholds that trigger new behaviours in the interlinked atmosphere, hydrosphere, atmosphere, biosphere and lithosphere that constitute the Earth system. The driving forces for change, both steady and chaotic, may be extra-terrestrial, such as the Milankovich cycles and asteroid impacts, due to Earth processes themselves or a mixture of the two. Our home world is and always has been supremely complicated; the more obviously so as knowledge advances.  Abrupt transitions in components of the Earth system occur when a critical forcing threshold is passed, creating a ‘tipping point’. Examples in the geologically short term are ice-sheet instability, the drying of the Sahara, collapse of tropical rain forest in the Amazon Basin, but perhaps the most important is the poleward transfer of heat in the North Atlantic Ocean. That is technically known as the Atlantic Meridional Overturning Circulation with the ominous acronym AMOC.

Simplified Atlantic Meridional Overturning Circulation (AMOC). Red – warm surface currents; cyan – cold deep-water flow. (Credit: Stefano Crivellari)

As things stand today, warm Atlantic surface water, made more saline and dense by evaporation in the tropics is transferred northwards by the Gulf Stream. Its cooling at high latitudes further increases the density of this water, so at low temperatures it sinks to flow southwards at depth. This thermohaline circulation continually pulls surface water northwards to create the AMOC, thereby making north-western European winters a lot warmer than they would be otherwise. Data from Greenland ice cores show that during the climatic downturn to the last glacial maximum, the cooling trend was repeatedly interrupted by sudden warming-cooling episodes, known as Dansgaard-Oeschger events, one aspect of which was the launching of “armadas” of icebergs to latitudes as far south as Portugal (known as Heinrich events), which left their mark as occasional gravel layers in the otherwise muddy sediments on the deep Atlantic floor (see: Review of thermohaline circulation; February 2002).

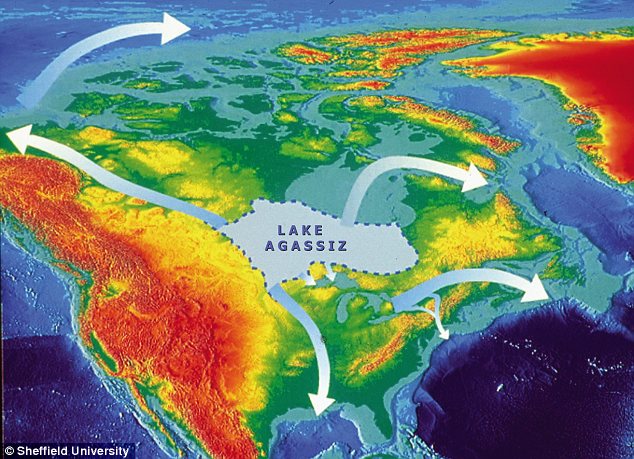
These episodes involved temperature changes over the Greenland icecap of as much as 15°C.  They began with warming on this scale within a matter of decades followed by slow cooling to minimal temperatures, before the next turn-over. Various lines of evidence suggest that these events were accompanied by shutdowns of AMOC and hence the Gulf Stream, as shown by variations in the foraminifera species in sea-floor sediments. The culprit was vast amounts of fresh water pouring into the Arctic and northernmost Atlantic Oceans, decreasing the salinity and density of the surface ocean water. In these cases that may have been connected to repeated collapse of circumpolar ice sheets to launch Heinrich’s iceberg armadas. A similar scenario has been proposed for the millennium-long Younger Dryas cold spell that interrupted the onset of interglacial conditions. In that case the freshening of high-latitude surface water was probably a result of floods released when glacial barriers holding back vast lakes on the Canadian Shield burst.

At present the Greenland icecap is melting rapidly. Rising sea level may undermine the ice sheet’s coastal edges causing it to surge seawards and launch an iceberg armada. This may be critical for AMOC and the continuance of the Gulf Stream, as predicted by modelling: counter-intuitive to the fears of global warming, at least for NW Europe. In August 2024 scientists from Germany and the UK published what amounts to a major caution about attempts to model future catastrophes of this kind (Ben-Yami, M. et al 2024, Uncertainties too large to predict tipping times of major Earth system components from historical dataScience Advances, v. 10, article  eadl4841; DOI 10.1126/sciadv.adl4841). They focus on records of the AMOC system, for which an earlier modelling study predicted that a collapse could occur between 2025 and 2095: of more concern than global warming beyond the 1.5° C currently predicted by greenhouse-gas climate models .

Maya Ben-Yami and colleagues point out that the assumptions about mechanisms in Earth-system modelling and possible social actions to mitigate sudden change are simplistic.  Moreover, models used for forecasting rely on historical data sets that are sparse and incomplete and depend on proxies for actual variables, such as sea-surface and air temperatures. The further back in geological time, the more limited the data are. The authors assess in detail data sets and modelling algorithms that bear on AMOC. Rather than a chance of AMOC collapse in the 21st century, as suggested by others, Ben Yami et al. reckon that any such event  lies between 2055 and 8065 CE, which begs the question, “Is such forecasting  worth the effort?”, however appealing it might seem to the academics engaged in climatology. The celebrated British Met Office and other meteorological institutions, use enormous amounts of data, the fastest computers and among the most powerful algorithms on the planet to simulate weather conditions in the very near future. They openly admit a limit on accurate forecasting of no more than 7 day ahead. ‘Weather’ can be regarded as short-term climate change.

It is impossible to stop scientists being curious and playing sophisticated computer games with whatever data they have to hand. Yet, while it is wise to take climate predictions with a pinch of salt because of their gross limitations, the lessons of the geological past do demand attention. AMOC has shut down in the past – the last being during the Younger Dryas – and it will do so again. Greenhouse global warming probably increases the risk of such planetary hiccups, as may other recent anthropogenic changes in the Earth system. The most productive course of action is to reduce and, where possible, reverse those changes. In my honest opinion, our best bet is swiftly to rid ourselves of an economic system that in the couple of centuries since the ‘Industrial Revolution’ has wrought these unnatural distortions.

Snowball Earth and the rise of multi-celled life

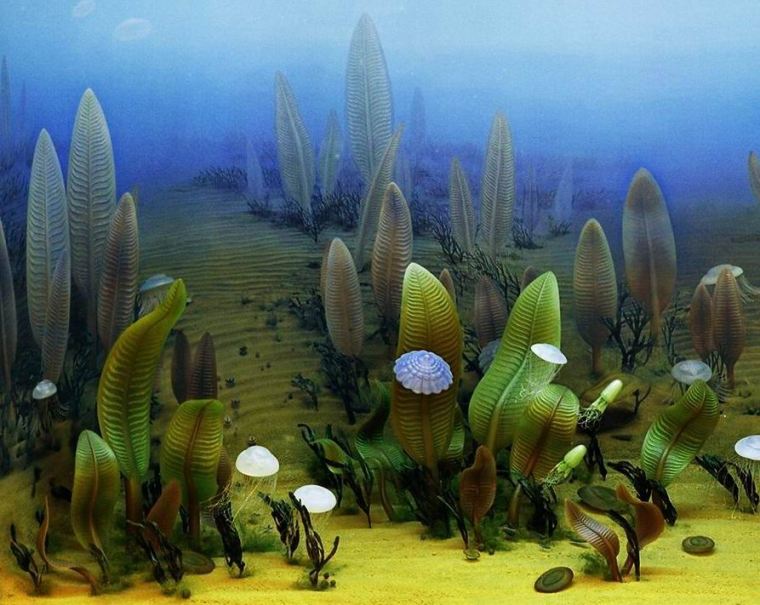
You can follow my ‘reportage’ on the long running story of the Snowball Earth events during the Neoproterozoic Cryogenian Period (850 to 635 Ma) since 2000 through the index to annual Palaeoclimatology logs (15 posts). Once these dramatic events were over sedimentary rocks deposited around the world during the Ediacaran Period (635 to 541 Ma) record the sudden appearance of large-bodied fossils: the first multicellular animals. This explosion from slimy biofilms and colonies of single-celled prokaryotes and eukaryotes laid the basis for the myriad ecological niches that have characterised Planet Earth ever since. The change saw specialised eukaryote cells (see: The rise of the eukaryotes; December 2017), whose precursors had originated in single-celled forms, begin to cooperate inthe development of complex tissues, organs, and organ systems to form bodies rather than just cell walls. The pulsating evolution, diversification and repeated extinction that followed during the last one tenth of geological time shaped a planet that is unique in the Solar System and possibly in the galaxy, if not the entire universe. The simple biosphere that preceded it, on the other hand, may have emerged on innumerable rocky planets blessed with liquid water to survive little changed for billions of years, as have Earths’ prokaryotes, the Archaea and Bacteria.  

Artist’s impression of the Ediacaran Fauna (credit: Science)

The Ediacaran biological revolution followed repeated changes in the geochemistry of the oceans, which carbon isotope data from the Cryogenian and Ediacaran suggest to have ‘gone haywire’. This turmoil involved dramatic changes in the cycling of sulfur and phosphorus that help ‘fertilise’ the marine food chain and in the production of oxygen by photosynthesis that is essential for metazoan animals.  The episodes when the Earth was iced over reduced the availability of nutrients through decreased rates of ocean-floor burial of dead organisms. Such Snowball events would also have reduced penetration of sunlight in the oceans. Less photosynthesis would not only have reduced oxygen production but also the amounts of autotrophic organisms. Furthermore, decreased water temperature would have increased its viscosity thereby slowing the spread of nutrients. The food chain for heterotrophs was decimated. Each Snowball event ended with warming, ice-free conditions so that the marine biosphere could burgeon

A great deal of data and numerous theories have accumulated since the Snowball concept was first mooted, but there has been little progress in understanding the rise of multi-celled life. Four geoscientists from the Massachusetts Institute of Technology, the Santa Fe Institute and the University of Colorado (Boulder), USA have developed an interesting hypothesis for how this enormous evolutionary step may have developed (Crockett, W.W. et al. 2024. Physical constraints during Snowball Earth drive the evolution of multicellularity. Proceedings of the Royal Society B: Biological Sciences, v. 291; DOI: 10.1098/rspb.2023.2767). The concatenation of huge events during the Cryogenian and Ediacaran presented continually changing patterns of selective pressures on simple organisms that preceded that time period. Crockett et al. review them in the light of fundamental biology to suggest how multicellular animals emerged as the Ediacara Fauna. Intuitively, such harsh conditions suggest at worst mass, even complete, extinction, at best a general reduction in size of all organism to cope with scarce resources. That the size of eukaryotes should have grown hugely goes against the grain of most biologists’ outlook.

The authors consider the crucial factor to be fundamental differences between prokaryotes and early eukaryotes. Prokaryote cells are very small, and whether autotrophs of heterotrophs they absorb nutrients through their walls by diffusion. Single-celled eukaryotes are far larger than prokaryotes and typically have a flagellum or ‘tail’ so that they can move independently and more easily gather resources. Crockett et al. used computer modelling to simulate the type of life form that could grow and thrive under Snowball conditions. They found that prokaryotes could only grow smaller, being ‘stunted’ by scarce resources. On the other hand eukaryotes would be better equipped to gather resources, the more so if they adopted a simple multicellular form – a hollow, self-propelled sphere about the size of a pea, which the authors dub a choanoblastula. Although no such form is known today, it does resemble the green Volvox algae, and plausibly could have evolved further to the simple forms of the Ediacaran fauna. The next task is either to find a fossil of such an organism, or to grow one.

Ocean-floor sediments reveal the influence of Mars on long-term climate cycles

In 1976 three scientists from Columbia and Brown (USA) and Cambridge (UK) Universities published a paper that revolutionised the study of ancient climates (Hays J.D., Imbrie J. and Shackleton N.J. 1976. Variations in the Earth’s Orbit: Pacemaker of the Ice Ages. Science, v. 194, p. 1121-1132;  DOI: 10.1126/science.194.4270.1121). Using variations in oxygen isotopes from foraminifera through two cores of sediments beneath the floor of the southern Indian Ocean they verified Milutin Milankovich’s hypothesis of astronomical controls over Earth’s climate. This centred on changes in Earth’s orbital parameters induced by gravitational effects from the motions of other planets: its orbit’s eccentricity, and the tilt and precession of its rotational axis. Analysis of the frequency of isotopic variations in the resulting time series yielded Milankovich’s predictions of ~100, 41 and 21 ka periodicities respectively. The time spanned by the cores was that of the last 500 ka of the Pleistocene and thus the last 5 glacial-interglacial cycles. Subsequently, the same astronomical climate forcing  has been detected  for various climate-induced changes in the earlier sedimentary record, including the glacial cycles of the Carboniferous and Neoproterozoic, Jurassic climate changes due to oceanic methane emissions and many other types of cyclicity during the Phanerozoic.

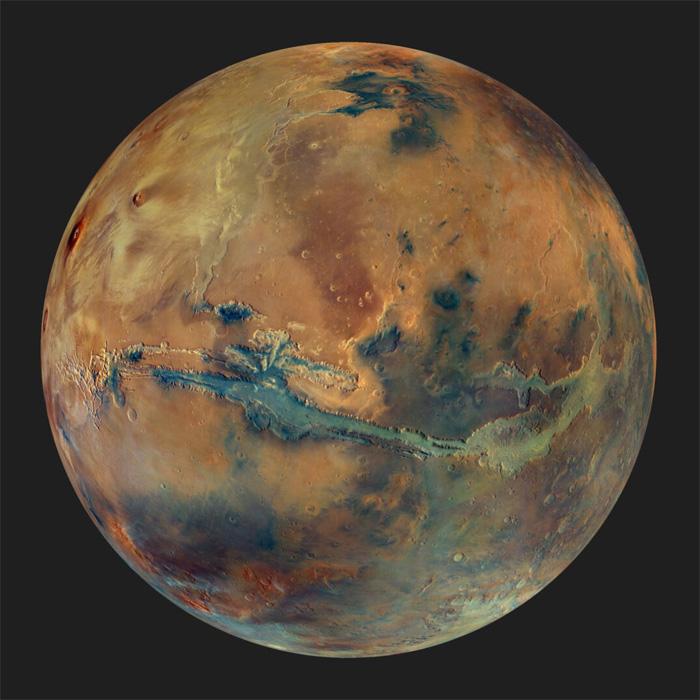
One hemisphere of Mars captured by ESA’s Mars Express. Credit: ESA / DLR / FU Berlin /

As well as time series based on isotopic and other geochemical changes in marine cores, other variables such as thickness of turbidite beds or cyclical repetitions of short rock sequences such as the ‘cyclothems’ of Carboniferous age (repetitions of a  limestone, sandstone, soil, coal sequence) have also been subject to frequency analysis. Sedimentary features that have not been tried are gaps or hiatuses in stratigraphic sequences where strata are missing from a deep-sea sequence. These signify erosion of sediment due to vigorous bottom currents in sequences otherwise dominated by continuous deposition under low-energy conditions. Three geoscientists from the University of Sydney, Australia and the Sorbonne University, France, have subjected records of gaps in Cenozoic sedimentation from 293 deep-sea drill cores to time-series analysis to discover what such ‘big data’ might reveal as regards climate fluctuations on the order of millions of years (Dutkiewicz, A., Boulila, S. & Müller, R.D. 2024. Deep-sea hiatus record reveals orbital pacing by 2.4 Myr eccentricity grand cycles. Nature Communications, v. 15, article 1998; DOI: 10.1038/s41467-024-46171-5).

In theory gravitational interrelationships between all the orbiting planets should have an effect on the orbital parameters of each other, and thus the amount of received solar radiation and changes in global climate. As well as the Milankovich effect, longer astronomical ‘grand cycles’ may therefore have been reflected somehow in Earth’s climatic history (Laskar, J. et al. 2004. A long-term numerical solution for the insolation quantities of the Earth. Astronomy & Astrophysics, v. 428, p. 261-285; DOI: 10.1051/0004-6361:20041335). Based on Laskar et al.’s calculations Adriana Dutkiewicz and colleagues sought evidence for two predicted ‘grand cycles’ that result from orbital interactions between Earth and Mars. These are a 2.4 Ma period in the eccentricity of Earth’s orbit and one of 1.2 Ma in the tilt of its axis.

The authors were able to detect cyclicity in the hiatus time series that is close to the 2.4 Ma Mars-induced waxing and waning of solar heating. Warming would increase mixing of ocean water through cyclones and hurricanes. That would then induce more energetic deep ocean currents and more erosion on the deep ocean floor: more gaps in sedimentation. Cooler conditions would ‘calm’ deep ocean currents so that deposition would outweigh evidence of erosion. The 1.2 Ma axial tilt cyclicity is not apparent in the data. Interestingly, the ~2.4 Ma cyclicity underwent a significant deviation at the Palaeocene-Eocene Boundary’ (56Ma), seemingly predicted by Laskar et al’s  astronomical solutions as a chaotic orbital transition between 56 and 53 Ma. Dutkiewicz et al. also chart the relations between the sedimentary-hiatus time series and major tectonic, oceanographic, and climatic changes during the Cenozoic Era, and found that terrestrial processes did disrupt the Mars-related orbital eccentricity cycles.

The findings suggest that long-term astronomical climate forcing needs to be borne in mind for better understanding the future response of the ocean to global warming. Also, if Mars had such an influence so must have Venus, which is more massive and closer. That remains to be investigated, and also the effects of the giant planets. In the very distant past there behaviour may have resulted in unimaginable astronomical changes. According to the bizarrely named Nice Model a back and forth shuffling of the Giant Planets was probably responsible for the Late Heavy Bombardment 4.1 to 3.8 billion years (Ga) ago. Such errant behaviour may even have triggered the flinging of some of the Sun’s original planetary complement out of the solar system and changed the outward order of the existing eight. Fortunately, the present planetary set-up seems to be stable …

See also: Dutkiewicz, A., & Müller, R. D. 2022. Deep-sea hiatuses track the vigor of Cenozoic ocean bottom currents. Geology, v. 50, p. 710–715; DOI: 10.1130/G49810.1; Mars drives deep-ocean circulation in Earth’s oceans, study suggests. Sci News, 13 March 2024.

A new explanation for the Neoproterozoic Snowball Earth episodes

The Cryogenian Period that lasted from 860 to 635 million years ago is aptly named, for it encompassed two maybe three episodes of glaciation. Each left a mark on every modern continent and extended from the poles to the Equator. In some way, this series of long, frigid catastrophes seems to have been instrumental in a decisive change in Earth’s biology that emerged as fossils during the following Ediacaran Period (635 to 541 Ma). That saw the sudden appearance of multicelled organisms whose macrofossil remains – enigmatic bag-like, quilted and ribbed animals – are found in sedimentary rocks in Australia, eastern Canada and NW Europe. Their type locality is in the Ediacara Hills of South Australia, and there can be little doubt that they were the ultimate ancestors of all succeeding animal phyla. Indeed one of them Helminthoidichnites, a stubby worm-like animal, is a candidate for the first bilaterian animal and thus our own ultimate ancestor. Using the index for Palaeobiology or the Search Earth-logs pane you can discover more about them in 12 posts from 2006 to 2023. The issue here concerns the question: Why did Snowball Earth conditions develop? Again, refresh your knowledge of them, if you wish, using the index for Palaeoclimatology or Search Earth-logs. From 2000 onwards you will find 18 posts: the most for any specific topic covered by Earth-logs. The most recent are Kicking-off planetary Snowball conditions (August 2020) and Signs of Milankovich Effect during Snowball Earth episodes (July 2021): see also: Chapter 17 in Stepping Stones.

One reason why Snowball Earths are so enigmatic is that CO2 concentrations in the Neoproterozoic atmospheric were far higher than they are at present. In fact since the Hadean Earth has largely been prevented from being perpetually frozen over by a powerful atmospheric greenhouse effect. Four Ga ago solar heating was about 70 % less intense than today, because of the ‘Faint Young Sun’ paradox. There was a long episode of glaciation (from 2.5 to 2.2 Ga) at the start of the Palaeoproterozoic Era during which the Great Oxygenation Event (GOE) occurred once photosynthesis by oxygenic bacteria became far more common than those that produced methane. This resulted in wholesale oxidation to carbon dioxide of atmospheric methane whose loss drove down the early greenhouse effect – perhaps a narrow escape from the fate of Venus. There followed the ‘boring billion years’ of the Mesoproterozoic during which tectonic processes seem to have been less active. in that geologically tedious episode important proxies (carbon and sulfur isotopes) that relate to the surface part of the Earth System ‘flat-lined’.  The plethora of research centred on the Cryogenian glacial events seems to have stemmed from the by-then greater complexity of the Precambrian Earth System.

Since the GOE the main drivers of Earth’s climate have been the emission of CO2 and SO2 by volcanism, the sedimentary burial of carbonates and organic carbon in the deep oceans, and weathering. Volcanism in the context of climate is a two-edged sword: CO2 emission results in greenhouse warming, and SO2 that enters the stratosphere helps reflect solar radiation away leading to cooling. Silicate minerals in rocks are attacked by hydrogen ions (H+) produced by the solution of CO2 in rain water to form a weak acid (H2CO3: carbonic acid). A very simple example of such chemical weathering is the breakdown of calcium silicate:

CaSiO3  +  2CO2  + 3H2O  =  Ca2+  +  2HCO3  +  H4SiO4  

The reaction results in calcium and bicarbonate ions being dissolved in water, eventually to enter the oceans where they are recombined in the shells of planktonic organisms as calcium carbonate. On death, their shells sink and end up in ocean-floor sediments along with unoxidised organic carbon compounds. The net result of this part of the carbon cycle is reduction in atmospheric CO2 and a decreased greenhouse effect: increased silicate weathering cools down the climate. Overall, internal processes – particularly volcanism – and surface processes – weathering and carbonate burial – interact. During the ‘boring billion’ they seem to have been in balance. The two processes lie at the core of attempts to model global climate behaviour in the past, along with what is known about developments in plate tectonics – continental break-up, seafloor spreading and orogenies – and large igneous events resulting from mantle plumes. A group of geoscientists from the Universities of Sydney and Adelaide, Australia have evaluated the tectonic factors that may have contributed to the first and longest Snowball Earth of the Neoproterozoic: the Sturtian glaciation (717 to 661 Ma) (Dutkiewicz, A. et al. 2024. Duration of Sturtian “Snowball Earth” glaciation linked to exceptionally low mid-ocean ridge outgassing. Geology, v. 52, online early publication; DOI: 10.1130/G51669.1).

Palaeogeographic reconstructions (Robinson projection) during the early part of the Sturtian global glaciation: LEFT based on geological data from Neoproterozoic terrains on modern continents; RIGHT based on palaeomagnetic pole positions from those terrains. Acronyms refer to each terrains, e.g. Am is Amazonia, WAC is the West African Craton. Orange lines are ocean ridges, those with teeth are subduction zone. (Credit: Dutkiewicz et al., parts of Fig. 1)

Shortly before the Sturtian began there was a major flood volcanism event, forming the Franklin large igneous province, remains of which are in Arctic Canada. The Franklin LIP is a subject of interest for triggering the Sturtian, by way of a ‘volcanic winter’ effect from SO2 emissions or as a sink for CO through its weathering. But both can be ruled out as no subsequent LIP is associated with global cooling and the later, equally intense Marinoan global glaciation (655 to 632 Ma) was bereft of a preceding LIP. Moreover, a world of growing frigidity probably could not sustain the degree of chemical weathering to launch a massive depletion in atmospheric CO2. In search of an alternative, Adriana Dutkiewicz and colleagues turned to the plate movements of the early Neoproterozoic. Since 2020 there have been two notable developments in modelling global tectonics of that time, which was dominated by the evolution of the Rodinia supercontinent. One is based largely on geological data from the surviving remnants of Rodinia (download animation), the other uses palaeomagnetic pole positions to fix their relative positions: the results are very different (download animation).

Variations in ocean ridge lengths, spreading rates and oceanic crust production during the Neoproterozoic estimated from the geological (orange) and palaeomagnetic (blue) models. Credit: Dutkiewicz et al., parts of Fig. 2)

The geology-based model has Rodinia beginning to break up around 800 Ma ago with a lengthening of global constructive plate margins during disassembly. The resulting continental drift involved an increase in the rate of oceanic crust formation from 3.5 to 5.0 km2 yr-1. Around 760 Ma new crust production more than halved and continued at a much slowed rate throughout the Cryogenian and the early part of the Ediacaran Period.  The palaeomagnetic model delays breakup of the Rodinia supercontinent until 750 Ma, and instead of the rate of crust production declining through the Cryogenian it more than doubles and remains higher than in the geological model until the late Ediacaran. The production of new oceanic crust is likely to govern the rate at which CO2 is out-gassed from the mantle to the atmosphere. The geology-based model suggests that from 750 to 580 Ma annual CO2 additions could have been significantly below what occurred during the Pleistocene ice ages since 2.5 Ma ago. Taking into account the lower solar heat emission, such a drop is a plausible explanation for the recurrent Snowball Earths of the Neoproterozoic. On the other hand, the model based on palaeomagnetic data suggests significant warming during the Cryogenian contrary to a mass of geological evidence for the opposite.

A prolonged decrease in tectonic activity thus seems to be a plausible trigger for global glaciation. Moreover, reconstruction of Precambrian global tectonics using available palaeomagnetic data seems to be flawed, perhaps fatally. One may ask, given the trends in tectonic data: How did the Earth repeatedly emerge from Snowball episodes? The authors suggest that the slowing or shut-down of silicate weathering during glaciations allowed atmospheric CO2 to gradually build up as a result of on-land volcanism associated with subduction zones that are a quintessential part of any tectonic scenario.

This kind of explanation for recovery of a planet and its biosphere locked in glaciation is in fact not new. From the outset of the Snowball Earth hypothesis much the same escape mechanisms were speculated and endlessly discussed. Adriana Dutkiewicz and colleagues have fleshed out such ideas quite nicely, stressing a central role for tectonics. But the glaring disparities between the two models show that geoscientists remain ‘not quite there’. For one thing, carbon isotope data from the Cryogenian and Ediacaran Periods went haywire: living processes almost certainly played a major role in the Neoproterozoic climatic dialectic.

Changing Atlantic Ocean currents may threaten Gulf Stream warming of Europe

Climate during the last Ice Age was continually erratic. Generally fine-grained muds cored from the floor of the North Atlantic Ocean show repeated occurrences of layers containing gravelly debris. These have been ascribed to periods when ice sheets on Greenland and Scandinavia calved icebergs at an exceptionally fast rate, to release coarse debris as they melted while drifting to lower latitudes. These ‘iceberg armadas’ (known as Heinrich events) left their unmistakable signs as far south as Portugal. Their timing correlates with short-lived (1 to 2 ka) warming-cooling episodes (Dansgaard-Oeschger events) recorded in Greenland ice cores that involved variations in air temperature of up to 15°C. The process that resulted in these sudden climate shifts seems to have been changing ocean circulation brought about by vast amounts of fresh water flooding into the Arctic and North Atlantic Oceans. This lowered seawater density to the extent that its upper parts could not sink when cooled. It is this thermohaline circulation that drags warmer surface water northwards, known as the Atlantic Meridional Overturning Circulation (AMOC), part of which is the Gulf Stream. When it fails or slows the result is plummeting temperatures at high latitudes. The last major AMOC shutdown was after 8 ka of warming that followed the last glacial maximum. Between 12.9 and 11.7 ka major glaciers grew again north of about 50°N in the period known as the Younger Dryas, almost certainly in the aftermath of a flood to the Arctic Ocean of glacial meltwater from the Canadian Shield. Around 8.2 thousand years ago human re-colonisation of Northern Europe was set back by a similar but lesser cooling event.

The Atlantic Meridional Overturning Circulation (AMOC). Red – warm surface currents; cyan – cold deep-water flow. (Credit: Stefano Crivellari)

Three researchers at Utrecht University, the Netherlands have issued an early warning that the AMOC may have reached a critical condition (Van Westen, R.M., Kliphuis, M & Dijkstra, H.A. 2024. Physics-based early warning signal shows that AMOC is on tipping course. Science Advances, v. 10, article adl1189; DOI: 10.1126/sciadv.adk1189). Previous modelling of AMOC has suggested that only rapid, massive decreases in the salinity of North Atlantic surface water near the Arctic Circle could shut down the Gulf Stream in the manner of Younger Dryas and Dansgaard-Oeschger events. René van Westen and colleagues have simulated the effects of steady, long-term addition of fresh water from melting of the Greenland ice sheet. They ran a sophisticated Earth System model for six months on the Netherlands’ Snellius super computer. Their model used a slowly increasing influx of glacial meltwater to the Atlantic at high northern latitudes.

The various feedbacks in the model eventually shut down the AMOC, predicted to result in cooling of NW Europe by 10 to 15 °C in a matter of a few decades. Yet to achieve that required the model to simulate more than 2000 years of change. It took 1760 years for a persistent AMOC transport of 10 to 15 million m3 s-1 to drop over a century or so and reach near-zero. That collapse involved around 80 times more melting of Greenland’s ice sheet than at present. Yet their modelling does not take into account global warming: including that factor would have exceeded their budgeted supercomputer time by a long way. Melting of the Greenland ice sheet is, however, accelerating dramatically

Van Westen et al. have shown the possibility that steadily increasing ice-sheet melting can, theoretically, ’flip’  the huge current system associated with the Atlantic Ocean, and with it regional climate patterns. The tangible fear today is of a more than 1.5°C increase in global surface temperature, yet a warming-induced failure of AMOC may cause local annual temperatures to fall by up to ten times that. Rather than the currently heralded disappearance of sea-ice from the Arctic Ocean, it may spread in winter to as far south as the North Sea. The only way of forecasting in detail what may actually happen – and where – is ever-more sophisticated and costly modelling of ocean currents and ice melting in a warming world. Uncertain as it stands, the work by van Westen and colleagues may well be ignored: perhaps as a ‘thing we dinnae care to speak aboot’.

See also: Le Page, M. 2024. Atlantic current shutdown is a real danger, suggests simulation. New Scientist, 9 February 2024; Watts, J. 2024. Atlantic Ocean circulation nearing ‘devastating’ tipping point, study finds. The Guardian, 9 February 2024.

An astronomical background to flood basalt events and mass extinctions?

Michael Rampino and Ken Caldeira of New York University and the Carnegie Institute have for at least three decades been at the forefront of studies into mass extinctions and their possible causes, including flood-basalt volcanism, extraterrestrial impacts and climate change. As early as 1993 the duo reported an ubiquitous 26-million year cycle in plate tectonic and volcanic activity. In Rampino’s 2017 book Cataclysms: A New Geology for the Twenty-First Century the notion of a process similar to Milutin Milankovich’s prediction of Earth’s orbital characteristics underpinning climate cyclicity figured in his thinking (see Shock and Er … wait a minute, Earth-logs, October 2017). Rampino postulated then that this longer-term geological cyclicity could be linked to gravitational changes during the Solar System’s progress around the Milky Way galaxy. He was by no means the first to turn to galactic forces, Johann Steiner having made a similar suggestion in 1966. The notion stems from the Solar System’s wobbling path as it orbits the centre of the Milky Way galaxy about every 250 Ma, which may result in its passage through a vast layered variation in several physical properties aligned at right angles to galactic orbital motions. This grand astronomical theory is ‘a story that will run and run’; and it has. It is possible that the galaxy has corralled dark matter in a disc within the galactic plane, which Rampino and Caldeira latched onto that notion a year after it appeared in Physical Review Letters in 2014.

As I commented in my brief review of Rampino’s book: “As for Rampino’s galactic hypothesis, the statistics are decidedly dodgy, but chasing down more forensics is definitely on the cards.” Indeed they have been chased in a recent review by the pair and their colleague Sedelia Rodriguez (Rampino, M.R., Caldeira, K. & Rodriguez, S. 2023. Cycles of ∼32.5 My and ∼26.2 My in correlated episodes of continental flood basalts (CFBs), hyper-thermal climate pulses, anoxic oceans, and mass extinctions over the last 260 My: Connections between geological and astronomical cycles. Earth-Science Reviews, v. 246 ; DOI: 10.1016/j.earscirev.2023.104548; reprint available on request from Rampino). They base their amplified case on much more than radiometric dates of continental flood basalt (CFB) events matched against the stratigraphic record of biotic diversity. Among the proxies are published measurements of mercury and osmium isotope anomalies in oceanic sediments that are best explained by sudden increases in basaltic magma eruption; signs of deep ocean anoxia; new dating of marine and non-marine extinctions in the fossil record, and episodes of sudden extreme climatic heating.

Statistical analysis of the ages of anoxic events and marine extinctions has yielded cycles of 32.5 and 26.2 Ma, those for CFBs having a 32.8 Ma periodicity. A note of caution, however: their data only cover the last 266 Ma – about one orbit of the solar system around the galactic centre. The authors attribute their interpretation of the cycles “to the Earth’s tectonic-volcanic rhythms, but the similarities with known Milankovitch Earth orbital periods and their amplitude modulations, and with known Galactic cycles, suggest that, contrary to conventional wisdom, the geological events and cycles may be paced by astronomical factors”.

Whether or not a detailed record of appropriate proxies can be extended back beyond the Late Permian, remains to be seen. The main fly-in-the-ointment is the tendency of CFB provinces to form high ground so that they are readily eroded away. Pre-Mesozoic signs of their former presence lie in basaltic dyke swarms that cut through older  crystalline continental crust. The marine sedimentary record is somewhat better preserved. A search for distinctive anomalies in osmium isotopes and mercury concentrations, which are useful proxies for global productivity of basaltic magmas, will be costly. Moreover, dating will depend to a large degree on the traditional palaeontology of strata, which in Palaeozoic rocks is more difficult to calibrate precisely by absolute radiometric dating.

Repeated climate and ecological stress during the run-up to the K-Pg extinction

The Cretaceous-Palaeogene mass extinction is no longer an event that polarises geologists’ views between a slow volcanic driver (The Deccan large igneous province) and a near instantaneous asteroid impact (Chicxulub). There is now a broad consensus that both processes were involved in weakening the Late Cretaceous biosphere and snuffing out much of it around 66 Ma ago. Yet is still no closure as regards the details. From a palaeontologist’s standpoint the die-off varied dramatically between major groups of animals. For instance, the non-avian dinosaurs disappeared completely while those that evolved to modern birds did not. Crocodiles came through it largely unscathed unlike aquatic dinosaurs. In the seas those animals that lived in the water column, such as ammonites, were far more affected than were denizens of the seafloor. But much the same final devastation was visited on every continent and ocean. However, lesser and more restricted extinctions occurred before the Chicxulub impact.

Scientists from Norway, Canada, the US, Italy, the UK and Sweden have now thrown light on the possibility that climate change during the last half-million years of the Cretaceous may have been eroding biodiversity and disrupting ecosystems (Callegaro, S. et al. 2023. Recurring volcanic winters during the latest Cretaceous: Sulfur and fluorine budgets of Deccan Traps lavas. Science Advances, v. 9, article eadg8284; DOI: 10.1126/sciadv.adg8284). Almost inevitably, they turned to the record of Deccan volcanism that overlapped the K-Pg event, specifically the likely composition of the gases that the magmas may have belched into the atmosphere. Instead of choosing the usual suspect carbon dioxide and its greenhouse effect, their focus was on sulfur and fluorine dissolved in pyroxene grains from 15 basalts erupted in the 10 Formations of the Deccan flood-basalt sequence. From these analyses they were able to estimate the amounts of the two elements in the magma erupted in each of these 10 phases.

Exposed section through a small part of the Deccan Traps in the Western Ghats of Maharashtra, India. (Credit: Gerta Keller, Princeton University)

The accompanying image of a famous section through the Deccan Traps SE of Mumbai clearly shows that 15 sampled flows could reveal only a fraction of the magmas’ variability: there are 12 flows in the foreground alone. The mountain beyond shows that the pale-coloured sequence is underlain by many more flows, and the full Deccan sequence is about 3.5 km thick. Clearly, flood-basalt volcanism is in no way continuous, but builds up from repeated lava flows that can be as much as 50 m thick. Each of them is capped by a red, clay-rich soil or bole – from the Greek word bolos (βόλος) meaning ‘clod of earth’. Weathering of basalt would have taken a few centuries to form each bole. Individual Deccan flows extend over enormous areas: one can be traced for 1500 km. At the end of volcanism the pile extended over roughly 1.5 million km2 to reach a volume of half a million km3.

Fluorine is a particularly toxic gas with horrific effects on organisms that ingest it. In the form of hydrofluoric acid (HF) – routinely used to dissolve rock – it penetrates tissue very rapidly to react with calcium in the blood to form calcium fluoride. This causes very severe pain, bone damage and other symptoms of skeletal fluorosis. The 1783-4 eruption of the Laki volcanic fissure in Iceland emitted an estimated 8,000 t of HF gas that wiped out more than half the domestic animals as a result of their eating contaminated grass. The famine that followed the eruption killed 20 to 25% of Iceland’s people: exhumed human skeletons buried in the aftermath show the distinctive signs of endemic skeletal fluorosis. This small flood-basalt event had global repercussions, as the Wikipedia entry for Laki documents. Volcanic sulfur emissions in the form of SO2 gas react with water vapour to form sulphuric acid aerosols in a reflective haze. If this takes place in the stratosphere as a result of powerful eruptions, as was the case with the 1991 Pinatubo eruption in the Philippines, the high-altitude haze lingers and spreads. This results in reduced solar warming: a so-called ‘volcanic winter’. In the Pinatubo aftermath global temperatures fell by about 0.5°C during 1991-3. Unsurprisingly, volcanic sulfur emissions also result in acid rainfall. Moreover, inhaling the sulphur-rich haze at low altitudes causes victims to choke as their respiratory tissues swell: an estimated 23,000 people in Britain died in this way when the 1783-4 Laki eruption haze spread southwards Sara Calegaro and colleagues found that the fluorine and sulfur contents of Deccan magmas fluctuated significantly during the eruptive phases. They suggest that fluorine emissions were far above those from Laki, perhaps leading to regional fluorine toxicity around the site of the Deccan flood volcanism but not extinctions. Global cooling due to sulphuric acid aerosols in the stratosphere is suggested to have happened repeatedly, albeit briefly, as eruption waxed and waned during each phase. Magmas rich in volatiles would have been more likely to erupt explosively to inject SO2 to stratospheric altitudes (above 10 to 20 km). The authors do not attempt to model when such cooling episodes may have occurred: data from only 15 levels in the Deccan Traps do not have the time-resolution to achieve that. They do, however, show that this large igneous province definitely had the potential to generate ‘volcanic winters’ and toxic episodes. Time and time again ecosystems globally and regionally would have experienced severe stress, the most important perhaps being disruption of the terrestrial and marine food chains.

A way for early humans to leave Africa for Eurasia via the Middle East

Without seafaring skills and sturdy boats, ancient humans had only two options to leave Africa for Eurasia: by crossing the Straits of Bab el Mandab at the southern end of the Red Sea and from the Nile delta to the Levant at its northern end. Both would have been difficult. The first route demanded extremely low sea level drawn down by continental ice accumulation to narrow the sea crossing, the earliest in the last glacial cycle being around 70 ka ago. The northern route, with no sea crossing, was potentially achievable throughout the history of the genus Homo. But that way is beset to the north and east by deserts with large tracts that today lack natural water sources. To leave Africa by that route seems the most obvious, being reached along the well-watered Nile valley or the Red Sea coast with its abundant marine resources. Yet moving eastwards to Arabia and further would have required climatic windows of opportunity to ensure well-watered corridors: it would be impossible today without an infrastructure of wells; and edible resources are extremely sparse. Remains of anatomically modern humans (AMH) as old as 200 ka and others in the period between 130 to 85 ka have been found around the eastern shores of the Mediterranean. Either of the two routes could have led them there during periods of increased humidity, perhaps in a series of migratory pulses. In the case of an exodus across the Straits of Bab el Mandab, people could have moved northwards along the Red Sea coast of modern Yemen and Arabia to the Levant. However, the record is patchy, and there is no direct fossil evidence to suggest they went further, into southern Asia or Europe in these earlier times. Each early venture may also have ended in extinction.  The first presence of AMH in Asia and Europe, seems to have been tens of thousand years later: about 75 ka and 45 ka, respectively, so far as we know.

Left: Satellite image of the Arabia and the Levant, showing the possible northern (red) and southern migration routes (blue) and sites that yielded various palaeoclimatic signs of formerly wet areas, Homo sapiens fossils and stone tools (see key). Right colour-coded map of topographic elevation for the study area in the Levant with sites that reveal palaeoclimatic and anthropological information. (Credit: Abbas et al., Fig 1)

Research in the Arabian Peninsula has early recorded human presence from discarded stone artefacts at widely scattered sites, as far east as the UAE and Oman, but whether these were carried by AMH or other human groups is uncertain. Yet geological research suggests that even in the presently forbidding Empty Quarter of Saudi Arabia there were from time to time abundant springs, river networks and even lakes: occasionally climate changes made much of Arabia habitable. Researchers from the University of Southampton (UK) and Shantou University (China), together with colleagues in Jordan, Australia and the Czech Republic have documented further evidence for ‘green’ episodes on the Jordan Plateau – part of the currently hyperarid  Arabian interior (Abbas, M. and 10 others 2023. Human dispersals out of Africa via the LevantScience Advances, v.9, article eadi6838; DOI: 10.1126/sciadv.adi6838).

Three sites in Jordan reveal wetland sediments incised by now dry channels or wadis, one of which yielded stone tools Luminescence dating of wetland sediment grains shows the times when they were last exposed to sunlight: some between 86 to 65 ka, others between 57 to 43 ka. Together with data from the rest of Arabia the sites help roughly to define routes that would have permitted human migration, though not the actual directions that early AMH might have travelled or their destinations – if any. They may just have wandered around surviving on the resources that they found during short periods of amenable local climate, and vegetation much as do desert dwellers today. Actually to exit Arabia to southern Asia would require migration around what is now the Persian Gulf, where relevant data are lacking and likely to remain so while poor security for research prevails. To get to Europe would require a much more intricate journey through large mountainous tracts to reach the shores of the Black Sea.

See also: Early human migrants followed lush corridor-route out of Africa. Science Daily. 4 October 2023

Sudden climate change: a warning from 8 millennia ago

Mesolithic hunter-gatherers in Britain must have had a very hard time around 8.2 thousand years age. The whole area around the North Atlantic experienced sudden climatic cooling of around 3.3°C together with drought that lasted about 70 years. To make things worse shortly afterwards, coasts around the North were devastated by a tsunami generated by a submarine landslide off western Norway. That event exceeded the maximum coast ‘run up’ of both the 26 December 2004 Indian Ocean tsunami and that in NW Japan on 11 March 2011. Doggerland, then in the central North Sea was devastated by a catastrophic event of a few days duration. It littered the seabed with the bones of its megafauna and even Mesolithic tools recovered by trawlers from its surviving relic the shallow Dogger Bank. It seems the tsunami arrived just as climate was warming back to ‘normal’ Holocene conditions: for many foragers, surely, a last straw.

The cooling episode has been attributed to perturbation of the Atlantic Meridional Overturning Circulation (AMOC) as a result of meltwater discharge during the deglaciation of the Laurentide Ice Sheet (see: Just when you think it’s going to turn out alright… November 2009).The event may have unfolded in a similar fashion to the trigger for the Younger Dryas and the succession of warming-cooling episodes known as Dansgaard-Oeschger events that interrupted the otherwise relentless global cooling towards the last glacial maximum (see: Review of thermohaline circulation; February 2002). The physics that set off such climatic ‘hiccups’ is that freshening of surface seawater reduces its density, so that it cannot sink to be replaced by denser saline water ‘dragged’ northwards from warmer latitudes. That currently takes the form of the Gulf Stream with its warming influence, particularly in the eastern North Atlantic and even beyond Norway’s North Cape, responsible for much warmer winters than at similar latitudes on the western side. The culprit  had long been suggested to be the drainage of a huge lake dammed by the ice sheet that covered most of eastern Canada during late stages of deglaciation. Seemingly the best candidate was Lake Agassiz trapped by the early Holocene ice front in Manitoba – the largest proglacial lake known anywhere.

Colour coded topographic elevation of North America showing the maximum extent of Lake Agassiz and four possible routes for its drainage: north-west to the Arctic Ocean via the Mackenzie River; south to the Gulf of Mexico via the Mississippi valley; east to the North Atlantic via the Great Lakes and St Laurence River; north to the North Atlantic via Hudson Bay. (Credit: ©Sheffield University)

The present landforms of central Canada show evidence for several outflow directions at different times, Including to the northwest to reach the Arctic Ocean at the onset of the Younger Dryas. Until recently there was little detailed evidence for the flow volume and timing of its drainage around 8 to 9 ka. Providing the details in the context of the short-lived event around 8.2 ka requires accurate data over a mere 200 years able to reveal a change in sea level to a precision of better than a few tens of centimetre. Any site on the shores of the North Atlantic would do, provided it satisfies these criteria. Geographers from universities in York, Leeds, Sheffield and Oxford, UK selected the small estuary of the River Ythan in NE Scotland. There, a continuous sand unit just above fine-grained intertidal tidal muds marks the knife-sharp time datum of the Storegga tsunami (Rush, G. et al. 2023. The magnitude and source of meltwater forcing of the 8.2 ka climate event constrained by relative sea-level data from eastern Scotland. Quaternary Science Advances, v. 12, article 100119; DOI: 10.1016/j.qsa.2023.100119).

Cores of the intertidal sediments from beneath the present Ythan salt marsh contain plant remains that yielded precise radiocarbon dates at several stratigraphic levels from which to derive an age-depth model for the age range of interest. The buried sediments are also rich in marine microfossils (foraminifera and diatoms) that thrive in estuaries at a variety of depths.  These enabled fluctuations in relative sea level during the build-up of the intertidal sediments to be constrained at unprecedented resolution and precision for a three thousand year period from 9.5 to 6.5 ka. The authors show that there were two episodes of rapid sea-level rise over that time: between 8.53 and 8.37 ka (~2.4 m at 13 mm yr-1) and 8.37 to 8.24 ka (~ 0.6 m at 4 mm yr-1) – these would have been global increases in sea level.

Despite its vast size, it turns out that Lake Agassiz would have been unable to result in sea-level rises of that magnitude so quickly merely through outflow. Rush et al. suggest that the huge  and rapid addition of fresh water to the North Atlantic involved flow of lake water towards Hudson Bay, beneath the ice sheet, causing it to collapse and melt, followed by completion of Lake Agassiz’s emptying in the second stage. It took a long drawn-out ‘freshening’ of the North Atlantic surface water ultimately to shut down the Atlantic Meridional Overturning Circulation, thereby depriving high latitudes of its east-side warming effect by the Gulf Stream.

Sea level has been rising since the early 20th century mainly through the melting of Greenland’s ice cap together with a substantial amount of thermal expansion while global climate has been warming. Between 1901 and 2018 the rise has amounted to 15 to 25 cm at a rate of 1 to 2 mm yr-1. The AMOC is possibly weaker now than at any time during the last millennium (Zhu, C. et al. 2023. Likely accelerated weakening of Atlantic overturning circulation emerges in optimal salinity fingerprint. Nature Communications, v. 14, article 1245; DOI: 10.1038/s41467-023-36288-4). Yet increases in freshening of the northernmost parts of the North Atlantic are now being added to by annual increases in the melting of polar sea ice, which is salt-free. The AMOC may be approaching a tipping point, because warming is accelerating over Greenland at around 1.5°C each year: faster than most of the rest of the world. In 2021 it rained for the first time ever recorded at the ice cap’s summit (3.2 km above sea level). A ‘perturbation’ of the AMOC would add chaos to the dominantly linear view of global warming taken by climatologists. That could launch frigidity and drought at mid northern latitudes as it did eight millennia ago: the opposite of what is currently feared.

See also: Unlocking Ancient Climate Secrets – Melting Ice Likely Triggered Climate Change Over 8,000 Years Ago. Scitechdaily 16 September 2023.

Direct signs of what caused the Palaeocene-Eocene thermal maximum

Until about 56 Ma ago North America and Europe were connected: one of the last relics of the Pangaea supercontinent. Oxygen isotopes and magnesium/calcium ratios in the tests of both surface- and bottom-dwelling foraminifera suggest that around that time global mean surface temperature increased by about 5 to 6°C within 10 to 20 thousand years. The rate of global warming was comparable to that currently being induced by human activities. The Palaeocene-Eocene thermal maximum (PETM) is seen by climatologists as a dreadful warning of times to come in the not so distant future. The PETM event marks the most dramatic biological changes since the mass extinction at the Cretaceous-Palaeogene boundary 10 million years earlier. They included the rapid expansions of mammals and land plants and major extinction of deep-water foraminifera. The PETM also coincided with an equally profound excursion in the δ13C of carbon-rich strata of that age, whose extreme negative value marks the release of a huge mass of previously buried organic carbon into the atmosphere. It was probably methane, much more potent at delaying heat loss to space than carbon dioxide – methane has more than 80 times the warming effect of carbon dioxide. Since CH4 is soon oxidised to CO2 and H2O estimates of atmospheric greenhouse gas levels are generally expressed in terms of CO2. The PETM release was equivalent to about 4.4 x 10¹³metrictons over 50 ka; on average 0.24 gigatons per year compared with 0.51 Gt from energy-related sources in 2022.

During the Palaeocene, areas around the present North Atlantic were subject to basaltic continental volcanism before the rifting that opened the North Atlantic from 62 to 58 Ma. Magmatism, dominated by intrusions, began again at the Palaeocene-Eocene boundary from 56 to 54 Ma, linked to the start of continental rifting. Both episodes suggest a rising mantle plume. Once the rift had truly opened volcanism became restricted to the mid Atlantic ridge and a mantle plume remains active beneath Iceland. After geoscientists became aware of the PETM and its coincidence with North Atlantic igneous activity many palaeoclimatologists suggested methane release from organic-rich sediments heated by intrusion of basaltic sills below the opening seaway (but see 2022 post on alternative hypotheses). As with so many extreme geological events, choosing a most-likely scenario depends ultimately on tangible evidence. A convincing sign has been demonstrated dramatically in a recent study by a multinational team of geophysicists, oceanographers, geochemists, palaeontologists and sedimentologists (Berndt, C. and 35 others 2023. Shallow-water hydrothermal venting linked to the Palaeocene–Eocene Thermal Maximum. Nature Geoscience, v. 16, p. 803–809; DOI: 10.1038/s41561-023-01246-8).

Three-dimensional view of seismic reflection data off western Norway. The greytone lower part is a vertical ‘slice’. The coloured part shows the depth variation of sediments that fill hydrothermal vent systems beneath a horizontal unconformity. (Credit: Berndt et al, Fig 1b)

The breakthrough by Berndt et al. stemmed from a detailed 3-D seismic survey off the coast of Norway. It revealed an unconformity at the P-E boundary beneath which were clear signs of hundreds of large pockmarks, up to 80 m deep. Seismic reflection from older sediments beneath the unconformity showed the distinctive presence of intrusive sills of igneous rocks. The consortium drilled 20 boreholes into the seabed beneath the survey area. Five of them penetrated crater-like features to yield cores through the sediments that had filled them. The fills were muds, which were interleaved beds of volcanic ash in the sequences marking the P-E boundary suggesting an igneous influence. Organic remains in the muds established the depositional timing of several distinct layers and also gave clues to their depositional conditions. Those spanning the 50 ka of the PETM were dominated by plant debris, pollen and spores, together with abundant marine diatoms that live in very shallow water. Laminations in the muds dip radially inwards towards the deeper parts of some craters to define funnel-like structures. In others the sediments have been domed upwards. The sediments and their structures closely resemble those in blow-out craters formed during petroleum drilling accidents and in onshore maar volcanoes produced by sudden explosive eruptions on land. The pockmarks formed suddenly, to be filled by mobilised mud and volcanic ash.

The evidence points to explosive vents formed by massive degassing of deeper sediments induced by igneous intrusions. Such systems are common around active ocean-floor rifts: ‘black-‘ and ‘white smokers’, but those off Norway formed in shallow water. That has an important bearing on their potency during the PETM. Deep hydrothermal systems may emit methane, but it is oxidised to CO2 in seawater. Those very close to the surface vent their gas almost directly into the atmosphere before such oxidation can consume methane. Intrusive sills also underlie the eastern continental margin of Greenland, so such explosive hydrothermal vents may have been widespread during the initial rifting of the North Atlantic’.

An evolutionary bottleneck and the emergence of Neanderthals, Denisovans and modern humans

The genetic diversity of living humans, particularly among short, repetitive segments of DNA, is surprisingly low. As they are passed from generation to generation they have a high chance of mutation, which would be expected to create substantial differences between geographically separated populations. In the late 1990s and early 2000s some researchers attributed the absence of such gross differences to the human gene pool having been reduced to a small size in the past, thereby reducing earlier genetic variation as a result of increased interbreeding among survivors. They were able to assess roughly when such a population ‘bottleneck’ took place and the level to which the global population fell. Genetic analysis of living human populations seemed to suggest that around 74 ka ago the global human population fell to as little as 10 thousand individuals. A potential culprit was the catastrophic eruption of the Toba supervolcano in Sumatra around that time, which belched out 800 km3 of ash now found as far afield as the Greenland and Antarctic ice caps. Global surface temperature may have fallen by 10°C for several years to decades. Subsequent research has cast doubt on such a severe decline in numbers of living hummans; for instance archaeologists working in SE India found much the same numbers of stone tools above the Toba ash deposit as below it (see: Toba ash and calibrating the Pleistocene record: December 2012). Other, less catastrophic explanations for the low genetic diversity of modern humans have also been proposed. Nevertheless, environmental changes that placed huge stresses on our ancestors may repeatedly have led to such population bottlenecks, and indeed throughout the entire history of biological evolution.

An improved method of ‘back-tracking’ genetic relatedness among living populations, known as fast infinitesimal time coalescence or ‘FitCoal’, tracks genomes of individuals back to a last common ancestor. In simple language, it expresses relatedness along lineages to find branching points and, using an assumed mutation rate, estimates how long ago such coalescences probably occurred. The more lineages the further back in time FitCoal can reach and the greater the precision of the analysis. Moreover it can suggest the likely numbers of individuals, whose history is preserved in the genetics of modern people, who contributed to the gene pool at different branching points. Our genetics today are not restricted to our species for it is certain that traces of Neanderthal and Denisovan ancestry are present in populations outside of Africa. African genetics also host ‘ghosts’ of so-far unknown distant ancestors. So, the FitCoal approach may well be capable of teasing out events in human evolution beyond a million years ago, if sufficient data are fed into the algorithms. A team of geneticists based in China, Italy and the US has recently applied FitCoal to genomic sequences of 3154 individual alive today (Hu, W.and 8 others 2023. Genomic inference of a severe human bottleneck during the Early to Middle Pleistocene transition. Science, v. 381, p. 979-984; DOI I: 10.1126/science.abq7487). Their findings are startling and likely to launch controversy among their peers.

Their analyses suggest that between 930 and 813 ka ago human ancestors passed through a population bottleneck that involved only about 1300 breeding individuals. Moreover they remained at the very brink of extinction for a little under 120 thousand years. Interestingly, the genetic data are from people living on all continents, with no major differences between the analyses for geographically broad groups of people in Africa and Eurasia. Archaeological evidence, albeit sparse, suggests that ancient humans were widely spread across those two continental masses before the bottleneck event. The date range coincides with late stages of the Mid-Pleistocene climatic transition (1250 to 750 ka) during which glacial-interglacial cycles changed from 41 thousand-year periods to those that have an average duration of around 100 ka. The transition also brought with it roughly a doubling in the mean annual temperature range from the warmest parts of interglacials to the frigid glacial maxima: the world became a colder and drier place during the glacial parts of the cycles.

Genomes for Neanderthals and Denisovans suggest that they emerged as separate species between 500 and 700 ka ago. Their common ancestor, possibly Homo heidelbergensis, H. antecessor or other candidates (palaeoanthropologists habitually differ) may well have constituted the widespread population whose numbers shrank dramatically during the bottleneck. Perhaps several variants emerged because of it to become Denisovans, Neanderthals and, several hundred thousand years later, of anatomically modern humans. Yet it would require actual DNA from one or other candidate for the issue of last common ancestor for the three genetically known ‘late’ hominins to be resolved. But Hu et al. have shown a possible means of accelerated hominin evolution from which they may have emerged, at the very brink of extinction.

Oxygen-isotope record and global temperature changes over the last 5 million years, green lines showing the times dominated by 41 and 100 ka climatic cycles. The mid-Pleistocene climatic transition is shown in pink (Credit: Robert A Rohde)

There is a need for caution, however. H. erectus first appeared in the African fossil record about 1.8 Ma ago and subsequently spread across Eurasia to become the most ‘durable’ of all hominin species. Physiologically they seem not to have evolved much over at least a million years, nor even culturally – their biface Acheulean tools lasted as long as they did. They were present in Asia for even longer, and apparently did not dwindle during the mid-Pleistocene transition to the near catastrophic levels as did the ancestral species for living humans. The tiny global population suggested by Hu et al. for the latter also hints that their geographic distribution had to be very limited; otherwise widely separated small bands would surely have perished over the 120 ka of the bottleneck event. Yet, during the critical period from 930 to 813 ka even Britain was visited by a small band of archaic humans who left footprints in river sediments now exposed at Happisburgh in Norfolk. Hu et al. cite the scarcity of archaeological evidence from that period – perhaps unwisely – in support of their bottleneck hypothesis. There are plenty of other gaps in the comparatively tenuous fossil and archaeological records of hominins as a whole.

The discovery of genetic evidence for this population bottleneck is clearly exciting, as is the implication that it may have been the trigger for evolution of later human species and the stem event for modern humans. Hopefully Hu et al’s work will spur yet more genetic research along similar lines, but there is an even more pressing need for field research aimed at new human fossils from new archaeological sites.

See also: Ashton, N. & Stringer, C. 2023. Did our ancestors nearly die out? Science (Perspectives), v. 381, p. 947-948; DOI: 10.1126.science.adj9484.

Ikarashi, A. 2023. Human ancestors nearly went extinct 900,000 years ago. Nature, v. 621; DOI: 10.1038/d41586-023-02712-4

Di Vicenzo, F & Manzi, G. 2023. An evolutionary bottleneck and the emergence of Neanderthals, Denisovans and modern humans. Homo heidelbergensis as the Middle Pleistocene common ancestor of Denisovans, Neanderthals and modern humans. Journal of Mediterranean Earth Sciences, v, 15, p. 161-173; DOI: 10.13133/2280-6148/18074

When and why did the North American Pleistocene megafauna collapse?

The US city of Los Angeles, originally known as El Pueblo de Nuestra Señora la Reina de los Ángeles (The Town of Our Lady the Queen of the Angels), was founded in 1781 by 44 Spanish settlers. It remained a small cattle-centred town after the annexation of California from Mexico by the USA in 1847. Once it was reached by the transcontinental Southern Pacific railroad in 1876 it had the potential for growth. But it took the discovery of oil within its limits in 1892 for its population to increase rapidly. The Los Angeles City Oil Field became the top producer in California with 200 separate oil companies crammed cheek by jowl by 1901. Now only one remains, producing just 3.5 barrels per day. That crude oil was there for the taking was pretty obvious as bitumen seeps had long been exploited by native people and the original Spanish colonists. The oilfield was developed near one such seep: the Rancho La Brea tar pits.

Rancho La Brea tar pit and derricks of the Los Angeles City Oil Field in 1901

By 1901 perfectly preserved bones of a huge variety of animals – 231 vertebrate species – as well as plants and invertebrates began to be collected from the continually roiling pond of bitumen. Thousands of specimens have been collected since then, both predators and prey of all sizes. Famous for mastodons and sabre-toothed cats, La Brea is a repository of almost the entire western Californian fauna through much of the Late Pleistocene: before about 100 ka the area lay beneath the Pacific Ocean. Tar pits are traps for unwary animals of any kind, especially as shallow water often hides the danger. Carnivores seeking easy, abundant food end up trapped too.

Because of the anaerobic nature of bitumen, bacterial decay is suppressed. Many of the bones still contain undegraded collagen: the most abundant protein in mammals, which can be dated using the radiocarbon method. So, despite the lack of stratigraphy in the tar pits, it is possible to track the history of the ecosystem by painstaking dating of individual fossils (OKeefe, F.R and 18 others 2023. Pre–Younger Dryas megafaunal extirpation at Rancho La Brea linked to fire-driven state shift. Science, v. 381, article eabo3594; DOI: 10.1126/science.abo3594). Robin OKeefe and colleagues dated 169 specimens of eight large mammal species most commonly found in the bitumen: sabre-toothed cat (Smilodon fatalis); dire wolf (Aenocyon dirus); coyote (Canis latrans); American lion (Panthera atrox); ancient bison (Bison antiquus); western horse (Equus occidentalis); Harlans ground sloth (Paramylodon harlani); and yesterdays camel (Camelops hesternus).

The authors focussed on precisely dated specimens spanning the 15.6 to 10.0 ka time range. This would allow the disappearance times of individual species to be compared with stages in the rapid change in the Californian climate during post glacial maximum warming, those during the Younger Dryas abrupt cooling (12.9 to 11.7 ka) and the earliest Holocene warming that succeeded it. The first to go extinct were the camels and giant sloths about 13.6 ka ago. At 13.2 ka the other mammals declined very rapidly, the two remaining herbivores vanishing more quickly than the four predators. By 12.9 ka the only surviving species of the chosen eight was the coyote. So seven members of the Pleistocene mammalian megafauna became extinct before the onset of the Younger Dryas cold millennium.

Part of the team examined pollen from a core through sediments deposited in a lake 100 km south of La Brea. They found that flora, and probably climate, had not changed at the time of camel and sloth extinctions around 13.6 ka. However a 300 year period between 13.2 and 12.9 ka witnessed a collapse in deciduous tree species while conifers, grasses and drought-tolerant shrubs increased. A woodland ecosystem had been replaced by semi-arid chaparral. Another feature of the lake-bed sediments was that charcoal fragments increased explosively during that 300-year episode that ended both the woodland ecosystem and the megafauna that exploited it: undoubtedly three centuries of regular wildfires. What remained was the chaparral ecosystem based on drought-tolerant, fire-adapted plants.

Were the megafauna collapse and a change in ecology results of a climatic harbinger for the Younger Dryas cool millennium, or some other cause? Interestingly, tangible evidence for the Clovis hunting culture of North America, which has long been implicated in the faunal ‘extirpation’, does not appear until 12.9 ka, and in California neither does any implicating other human groups. Yet evidence is accumulating for much earlier entry of humans into North America. Occupation sites are very rare on land, but human presence here and there implies such earlier migration, probably along the west coast that avoided the frigid interior further north than California. The question posed by OKeefe ­et al. is, ‘Were the fires ignited by humans over a 300 year period just before the Younger Dryas’? It remains to be confirmed … First human arrivals coinciding with evidence for wildfires in Australia, New Zealand and a few other areas do suggest that it is a possibility. There needs to be a motive, such as producing lush clearings in forest to attract game, or removing cover to make hunting easier. In this case, the fires immediately preceded a global climatic downturn with terrestrial drying, so they may have had natural causes: the potentially incendiary chaparral flora had been increasing steadily beforehand and decreased rapidly after the evidence for wildfires

See also: Price, M. 2023.  Death by fire. Science, v. 381, p. 724-727; DOI: 10.1126/science.adk3291

How humans might have migrated into the Americas

When and how humans first migrated into the Americas are issues that have exercised anthropologists for the last two decades, often sparking off acrimonious debate. In the 20th century both seemed to well established: hunters using the celebrated Clovis fluted spear blades arrived first, no earlier than 13 ka ago. The Beringia land bridge across what is now the Bering Strait was exposed by falling sea level as early as 30 thousand years ago in the lead-up to the last glacial maximum (LGM) to link eastern Siberia and Alaska. However, ice sheets expanding to the south-west of the main area of glaciation on the Canadian Shield barred passage through Interior Alaska and NW Canada. Only around 13 ka had a N-S ice-free corridor opened through the mountains during glacial retreat. Nevertheless, humans had entered Alaska at least ten thousand years earlier, during the LGM, to occupy caves in its western extremity: Alaska was habitable but they were stuck there.

In the early 21st century, it became clear that the ‘Clovis First’ hypothesis was mistaken. Sediments in Texas that contained Clovis blades were found to be underlain by those of an older culture, reliably dated to about 15.5 ka. Furthermore, analysis of the DNA of all groups of native Americans (north and south) indicated a last common ancestor in Siberia more than 30 ka ago: they descended from that ancestor outside of Asia. More recently excavated sites in Mexico and Chile point to human populations having reached there as early at 33 ka (see: Earliest Americans, and plenty of them; July 2020), and there is a host of pre-Clovis sites in North and Central America dating back to 18.2 ka. Such ancient groups could not have walked from the Beringia land bridge because the present topographic grain in the Western Cordillera would have been blocked by ice since about 25 thousand years ago. The only viable possibility was that they followed the Alaskan coast to move southwards, either in boats or over sea ice.

Dated pre-Clovis sites in Mexico and North America and possible expanding distribution of people from 31.3 to 14.2 ka (Credit; Becerra-Valdivia and Higham; Extended Data Fig. 4)

A new focus on when such journeys would have been feasible was published in February 2023 (Praetorius, S.K et al. 2023. Ice and ocean constraints on early human migrations into North America along the Pacific coast. Proceedings of the National Academy of Science, v. 120, article e2208738120; DOI: 10.1073/pnas.2208738120). One advantage of moving along the coast is that, though it would be pretty cold, the warming effect of the Pacific Ocean would make it more bearable than travelling inland, where winter temperatures even today regularly reach -50°C. More important, there would be no shortage of food; fish, marine mammals and shellfish abound at the ice margin or onshore, at any season. But a coastal route may not have been possible at all times during the period either side of the LGM. Large glaciers still reach the ocean from Alaska and there is little more perilous than crossing the huge crevasse fields that they present. Boating would have been highly dangerous because of continual calving of icebergs from extensive ice shelves. Moreover, the Alaska Coastal Current flows northwards and would likely have sped up during episodes of glacial melting as the current is affected by fresh water influx. Yet there may sometimes have been episodes of open water at the ice front frozen to relatively flat sea ice in winter. That would making boat- or foot travel relatively safe. Sea ice would also make glacier-free islands accessible for encampments over the harsh winters or even for hundreds of years, with plenty of marine food resources.

Summer Praetorius of the US Geological Survey and colleagues from Woods Hole Oceanographic Institution, Oregon State University, and the Universities of California (Santa Cruz) and Oregon have attempted to model conditions since 32.5 ka ago in coastal waters off Northwest America. They used simulations of the behaviour of the Alaska Coastal Current during varying climate conditions before and during the LGM, while glaciers were in  retreat that followed and during the Holocene. Their modelling is based on the effects of changing sea level and water salinity on general circulation in the Northern Pacific. The relative abundance of sea ice can be tracked using variation in an alkenone produced by phytoplankton that wax and wane according to sea-surface temperature and sea-ice cover. The other input is the well-documented changing extent of continental glaciation in Alaska and the Yukon Territory. Based on their model they estimate that the most favourable environmental conditions for coastal migration occurred just before the LGM (24.5 to 22 ka) and between 16.4 and 14.8 ka during the initial stages of warming and extensive melting of ice sheets. The Alaskan Coastal Current probably doubled in intensity during the LGM making the use of boats highly dangerous

By 35 ka ocean-going boats are known to have been used by people in northern Japan. Traversing sea-ice was the way in which Inuit people occupied all the Arctic coastal areas of North America and Greenland during the last five thousand years, and is the form of travel favoured by the authors. It is not yet possible to prove and date such coastal journeys because campsites or settlements along the coast would now be inundated by 100 m of post-glacial sea-level rise. Yet such migration was necessary to establish settlements at lower latitudes in North America and Mexico in the period when overland routes from Beringia were blocked by ice sheets. By 32.5 ka falling sea level probably made it possible to cross the Bering Strait for the first time and for the next 7.5 ka an ice-free corridor made it possible for the rest of North America and points further south to be reached on-foot from Alaska. That window of opportunity might have allowed humans to have reached Mexico and South America, where the earliest dates of occupation have been found. But many of the early sites across North America date to the period (25 to 13 ka) when overland access was blocked. Of course, those sites might have been established by expansion from the very earliest migrants who crossed the Beringia land bridge and took advantage of overland passage before 25 ka. But if later migrants from Asia could follow the coastal route, then it seems likely that they did. Later Inuit spread along  the shores of the Arctic Ocean since 5000 years ago probably with a material culture little different from that of the earlier migrants from Siberia.

Is erosion paced by Milankovich cycles?

Both physical and chemical weathering reflects climatic controls. Erosion is effectively climate in continuous action on the Earth’s solid surface through water, air and bodies of ice moving under the influence of gravity. These two major processes on the land surface are immensely complicated. Being the surface part of the rock cycle, they interact with biological processes in the continents’ web of climate-controlled ecosystems. It is self-evident that climate exerts a powerful influence on all terrestrial landforms. But at any place on the Earth’s surface climate changes on a whole spectrum of rates and time scales as reflected by palaeoclimatology. With little room for doubt, so too do weathering and erosion. Yet other forces are at play in the development of landforms. ‘Wearing-down’ of elevated areas removes part of the load that the lithosphere bears, so that the surface rises in deeply eroded terrains. Solids removed as sediments depress the lithosphere where they are deposited in great sedimentary basins. In both cases the lithosphere rises and falls to maintain isostatic balance. On the grandest of scales, plate tectonics operates continuously as well. Its lateral motions force up mountain belts and volcanic chains, and drag apart the lithosphere, events that in themselves change climate at regional levels. Tectonics thereby creates ‘blips’ in long term global climate change. So evidence for links between landform evolution and palaeoclimate is notoriously difficult to pin down, let alone analyse.

The evidence for climate change over the last few million years is astonishingly detailed; so much so that it is possible to detect major global events that took as little as a few decades, such as the Younger Dryas, especially using data from ice cores. The record from ocean-floor sediments is good for changes over hundreds to thousands of years. The triumph of palaeoclimatology is that the last 2.5 Ma of Earth’s history has been proved to have been largely paced by variations in the Earth’s orbit and in the angle of tilt and wobbles of its rotational axis: a topic that Earth-logs has tracked since the start of the 21st century. The record also hints at processes influencing global climate that stem from various processes in the Earth system itself, at irregular but roughly millennial scales. The same cannot be said for the geological record of erosion, for a variety of reasons, foremost being that erosion and sediment transport are rarely continuous in any one place and it is more difficult to date the sedimentary products of erosion than ice cores and laminations in ocean-floor sediments. Nonetheless, a team from the US, Germany, the Netherlands , France and Argentina have tackled this thorny issue on the eastern side of the Andes in Argentina (Fisher, G.B. and 11 others 2023. Milankovitch-paced erosion in the southern Central Andes. Nature Communications, v. 14, 424-439; DOI: 10.1038/s41467-023-36022-0.

Burch Fisher (University of Texas at Austin, USA) and colleagues studied sediments derived from a catchment that drains the Puna Plateau that together with the Altiplano forms the axis of the Central Andes. In the late 19th century the upper reaches of the Rio Iruya were rerouted, which has resulted in its cutting a 100 m deep canyon through Pliocene to Early Pleistocene (6.0 to 1.8 Ma) sediments. The section includes six volcanic ash beds (dated precisely using the zircon U-Pb method) and records nine palaeomagnetic reversals, which together helped to calibrate more closely spaced dating. Their detailed survey used the decay of radioactive isotopes of beryllium and aluminium (10Be and 26Al) in quartz grains that form in the mineral when exposed at the surface to cosmic-ray bombardment. Such cosmogenic radionuclide dating thus records the last time different sediment levels were at the surface, presumably when the sediment was buried, and thus the variation in the rate of sediment supply from erosion of the Rio Iruya catchment since 6 Ma ago.

Measured concentrations (low to high values downwards) of cosmogenic 10Be (turquoise) and 26Al (red) in samples from the Rio Iruya sediment sequence. The higher the value, the longer the layer had resided at the surface; i.e. the slower the erosion rate. (Credit: Fisher et al. Fig 4)

The data from 10Be suggest that erosion rates were consistently high from 6 to 4 Ma, but four times during the later Pliocene and the earliest Pleistocene they slowed dramatically. Each of these episodes occupies downturns in solar warming forced by the 400 ka cycle of orbital eccentricity. The 26Al record confirms this trend. The most likely reason for the slowing of erosion is long-term reductions in rainfall, which Fisher et al have modelled based on Milankovich cycles. However the modelled fluctuations are subtle, suggesting that in the Central Andes at least erosion rates were highly sensitive to climatic fluctuations. Yet the last 400 ka cycle in the record shows no apparent correlation with climate change.  Despite that, astronomical forcing while early Pleistocene oscillations between cooling and warming ramped up does seem to have affected erosion rates based on the cosmogenic dating. The authors attribute this loss of the 400 ka pattern to a kind of swamping effect of dramatically increased erosion rates as the regional climate became more erratic. Whether or not data of this kind will emerge for the more climatically drastic 100 ka cyclicity of the last million years remains to be seen … Anyone who has walked over terrains covered in glacial tills and glaciofluvial gravel beds nearer to the former Late Pleistocene ice sheets can judge the difficulty of such a task.