Changing Atlantic Ocean currents may threaten Gulf Stream warming of Europe

Climate during the last Ice Age was continually erratic. Generally fine-grained muds cored from the floor of the North Atlantic Ocean show repeated occurrences of layers containing gravelly debris. These have been ascribed to periods when ice sheets on Greenland and Scandinavia calved icebergs at an exceptionally fast rate, to release coarse debris as they melted while drifting to lower latitudes. These ‘iceberg armadas’ (known as Heinrich events) left their unmistakable signs as far south as Portugal. Their timing correlates with short-lived (1 to 2 ka) warming-cooling episodes (Dansgaard-Oeschger events) recorded in Greenland ice cores that involved variations in air temperature of up to 15°C. The process that resulted in these sudden climate shifts seems to have been changing ocean circulation brought about by vast amounts of fresh water flooding into the Arctic and North Atlantic Oceans. This lowered seawater density to the extent that its upper parts could not sink when cooled. It is this thermohaline circulation that drags warmer surface water northwards, known as the Atlantic Meridional Overturning Circulation (AMOC), part of which is the Gulf Stream. When it fails or slows the result is plummeting temperatures at high latitudes. The last major AMOC shutdown was after 8 ka of warming that followed the last glacial maximum. Between 12.9 and 11.7 ka major glaciers grew again north of about 50°N in the period known as the Younger Dryas, almost certainly in the aftermath of a flood to the Arctic Ocean of glacial meltwater from the Canadian Shield. Around 8.2 thousand years ago human re-colonisation of Northern Europe was set back by a similar but lesser cooling event.
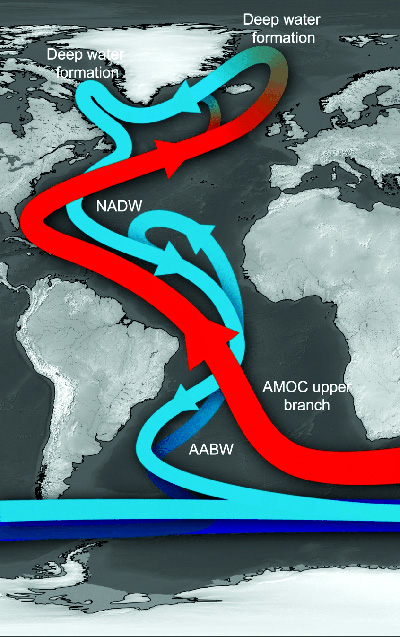
The Atlantic Meridional Overturning Circulation (AMOC). Red – warm surface currents; cyan – cold deep-water flow. (Credit: Stefano Crivellari)

Three researchers at Utrecht University, the Netherlands have issued an early warning that the AMOC may have reached a critical condition (Van Westen, R.M., Kliphuis, M & Dijkstra, H.A. 2024. Physics-based early warning signal shows that AMOC is on tipping course. Science Advances, v. 10, article adl1189; DOI: 10.1126/sciadv.adk1189). Previous modelling of AMOC has suggested that only rapid, massive decreases in the salinity of North Atlantic surface water near the Arctic Circle could shut down the Gulf Stream in the manner of Younger Dryas and Dansgaard-Oeschger events. René van Westen and colleagues have simulated the effects of steady, long-term addition of fresh water from melting of the Greenland ice sheet. They ran a sophisticated Earth System model for six months on the Netherlands’ Snellius super computer. Their model used a slowly increasing influx of glacial meltwater to the Atlantic at high northern latitudes.

The various feedbacks in the model eventually shut down the AMOC, predicted to result in cooling of NW Europe by 10 to 15 °C in a matter of a few decades. Yet to achieve that required the model to simulate more than 2000 years of change. It took 1760 years for a persistent AMOC transport of 10 to 15 million m3 s-1 to drop over a century or so and reach near-zero. That collapse involved around 80 times more melting of Greenland’s ice sheet than at present. Yet their modelling does not take into account global warming: including that factor would have exceeded their budgeted supercomputer time by a long way. Melting of the Greenland ice sheet is, however, accelerating dramatically

Van Westen et al. have shown the possibility that steadily increasing ice-sheet melting can, theoretically, ’flip’  the huge current system associated with the Atlantic Ocean, and with it regional climate patterns. The tangible fear today is of a more than 1.5°C increase in global surface temperature, yet a warming-induced failure of AMOC may cause local annual temperatures to fall by up to ten times that. Rather than the currently heralded disappearance of sea-ice from the Arctic Ocean, it may spread in winter to as far south as the North Sea. The only way of forecasting in detail what may actually happen – and where – is ever-more sophisticated and costly modelling of ocean currents and ice melting in a warming world. Uncertain as it stands, the work by van Westen and colleagues may well be ignored: perhaps as a ‘thing we dinnae care to speak aboot’.

See also: Le Page, M. 2024. Atlantic current shutdown is a real danger, suggests simulation. New Scientist, 9 February 2024; Watts, J. 2024. Atlantic Ocean circulation nearing ‘devastating’ tipping point, study finds. The Guardian, 9 February 2024.

Is erosion paced by Milankovich cycles?

Both physical and chemical weathering reflects climatic controls. Erosion is effectively climate in continuous action on the Earth’s solid surface through water, air and bodies of ice moving under the influence of gravity. These two major processes on the land surface are immensely complicated. Being the surface part of the rock cycle, they interact with biological processes in the continents’ web of climate-controlled ecosystems. It is self-evident that climate exerts a powerful influence on all terrestrial landforms. But at any place on the Earth’s surface climate changes on a whole spectrum of rates and time scales as reflected by palaeoclimatology. With little room for doubt, so too do weathering and erosion. Yet other forces are at play in the development of landforms. ‘Wearing-down’ of elevated areas removes part of the load that the lithosphere bears, so that the surface rises in deeply eroded terrains. Solids removed as sediments depress the lithosphere where they are deposited in great sedimentary basins. In both cases the lithosphere rises and falls to maintain isostatic balance. On the grandest of scales, plate tectonics operates continuously as well. Its lateral motions force up mountain belts and volcanic chains, and drag apart the lithosphere, events that in themselves change climate at regional levels. Tectonics thereby creates ‘blips’ in long term global climate change. So evidence for links between landform evolution and palaeoclimate is notoriously difficult to pin down, let alone analyse.

The evidence for climate change over the last few million years is astonishingly detailed; so much so that it is possible to detect major global events that took as little as a few decades, such as the Younger Dryas, especially using data from ice cores. The record from ocean-floor sediments is good for changes over hundreds to thousands of years. The triumph of palaeoclimatology is that the last 2.5 Ma of Earth’s history has been proved to have been largely paced by variations in the Earth’s orbit and in the angle of tilt and wobbles of its rotational axis: a topic that Earth-logs has tracked since the start of the 21st century. The record also hints at processes influencing global climate that stem from various processes in the Earth system itself, at irregular but roughly millennial scales. The same cannot be said for the geological record of erosion, for a variety of reasons, foremost being that erosion and sediment transport are rarely continuous in any one place and it is more difficult to date the sedimentary products of erosion than ice cores and laminations in ocean-floor sediments. Nonetheless, a team from the US, Germany, the Netherlands , France and Argentina have tackled this thorny issue on the eastern side of the Andes in Argentina (Fisher, G.B. and 11 others 2023. Milankovitch-paced erosion in the southern Central Andes. Nature Communications, v. 14, 424-439; DOI: 10.1038/s41467-023-36022-0.

Burch Fisher (University of Texas at Austin, USA) and colleagues studied sediments derived from a catchment that drains the Puna Plateau that together with the Altiplano forms the axis of the Central Andes. In the late 19th century the upper reaches of the Rio Iruya were rerouted, which has resulted in its cutting a 100 m deep canyon through Pliocene to Early Pleistocene (6.0 to 1.8 Ma) sediments. The section includes six volcanic ash beds (dated precisely using the zircon U-Pb method) and records nine palaeomagnetic reversals, which together helped to calibrate more closely spaced dating. Their detailed survey used the decay of radioactive isotopes of beryllium and aluminium (10Be and 26Al) in quartz grains that form in the mineral when exposed at the surface to cosmic-ray bombardment. Such cosmogenic radionuclide dating thus records the last time different sediment levels were at the surface, presumably when the sediment was buried, and thus the variation in the rate of sediment supply from erosion of the Rio Iruya catchment since 6 Ma ago.

Measured concentrations (low to high values downwards) of cosmogenic 10Be (turquoise) and 26Al (red) in samples from the Rio Iruya sediment sequence. The higher the value, the longer the layer had resided at the surface; i.e. the slower the erosion rate. (Credit: Fisher et al. Fig 4)

The data from 10Be suggest that erosion rates were consistently high from 6 to 4 Ma, but four times during the later Pliocene and the earliest Pleistocene they slowed dramatically. Each of these episodes occupies downturns in solar warming forced by the 400 ka cycle of orbital eccentricity. The 26Al record confirms this trend. The most likely reason for the slowing of erosion is long-term reductions in rainfall, which Fisher et al have modelled based on Milankovich cycles. However the modelled fluctuations are subtle, suggesting that in the Central Andes at least erosion rates were highly sensitive to climatic fluctuations. Yet the last 400 ka cycle in the record shows no apparent correlation with climate change.  Despite that, astronomical forcing while early Pleistocene oscillations between cooling and warming ramped up does seem to have affected erosion rates based on the cosmogenic dating. The authors attribute this loss of the 400 ka pattern to a kind of swamping effect of dramatically increased erosion rates as the regional climate became more erratic. Whether or not data of this kind will emerge for the more climatically drastic 100 ka cyclicity of the last million years remains to be seen … Anyone who has walked over terrains covered in glacial tills and glaciofluvial gravel beds nearer to the former Late Pleistocene ice sheets can judge the difficulty of such a task.

Opportunities for anatomically modern humans to have left Africa

Key ages of early H. sapiens, Neanderthals and Denisovans (credit: Delson, 2019; Fig. 1)

For almost 2 million years humans have migrated long distances, the earliest example of a move out of Africa being the Georgian Homo erectus specimens (see: First out of Africa? November 2003). As regards H. sapiens – anatomically modern humans (AMH) – the earliest fossils, found at Jebel Irhoud in Morocco, are about 300 ka old. By 260 ka they were present at several sites that span the African continent. The first sign of AMH having left Africa are fossils found at Mislaya in Israel and Apidima in Greece – dated to 177 and 210 to 170 ka respectively – and 125 ka-old tools tentatively attributed to AMH in the Arabian Peninsula (see: Arabia : staging post for human migrations?, September 2014). There is also genetically dated evidence of geneflow from Homo sapiens into Neanderthal DNA between 130 to 250 ka ago. The evidence for an early ‘Out of Africa’ migration by AMH is concrete but very sparse, a fuller story of our permanently colonising all habitable parts of the world only emerging for times after about 65 ka.

It is easy to appreciate that the main hindrance for palaeo-anthropological research into human migration centres on the issue of where to look for evidence, a great many discoveries owing more to luck than to a strategic approach. And, of course, once interesting sites are found researchers congregate there. There is a limited number of active palaeoanthropologists of whom only a proportion engage regularly in field exploration. And there is also an element of the old gold prospectors adage: ‘If you want to find elephants, go to elephant country’! But there are other issues connected with discoveries. When was it possible for AMH to make transcontinental journeys and what routes would have been feasible from time to time? Robert Beyer of the Cambridge University with scientists from New Zealand, Estonia and the UK have devised a rational approach to the questions of optimum times and routes for major migration (Beyer, R.M., et al. 2021. Climatic windows for human migration out of Africa in the past 300,000 yearsNature Communications, v.  12, article 4889; DOI: 10.1038/s41467-021-24779-1). Just two routes out of Africa have been considered feasible: by crossing the Strait of Bab el Mandab from Djibouti and southern Eritrea to the Yemen, and following the Nile northwards to access Eurasia via the Levant. The first depends to some extent on how wide the Strait was; depending on sea level fluctuations, it has varied from 4 to 20 km during the last 300 ka. Exit by way of both routes would also have depended on vegetation, game and drinking water supplies that varying amounts of rainfall would have supported.

Assessing the feasibility of crossing the southern Red Sea at different times is fairly easy. Sea level fluctuates according to the amount of water locked in the ice caps of Antarctica and Greenland and on the land glaciated during ice ages in northern North America and Scandinavia. Oxygen isotopes in Pleistocene sea-floor sediments and today’s ice caps reveal that variation. Being one of the world’s most important seaways the bathymetry of the Red Sea is known in considerable detail. At present the minimum sea distance needed to cross the Strait of Bab el Mandab is about 21 km. At the lowest sea levels during the Pleistocene the sea journey was reduced to slightly less than 5 km, which would not have required sophisticated boats or seafaring skills. There is evidence that AMH and earlier humans occupied the western shore of the Red Sea to use its rich marine resources, but none for boats or for habitation of the Yemeni coastline. However, calculations by Beyer et al. of sea level fluctuations during the last 300 ka show that for more than half that time the sea crossing was less than 7 km thanks to a shallow continental shelf and a very narrow stretch of deep water. Clearly the varying width of the Strait is not a useful guide to windows of opportunity for migration via that route. Except for warm interglacials and a few interstadials, people could have crossed at any time provided that the ecosystems on either side could sustain them.

Annual precipitation during each millennium of the Late Pleistocene for the two most likely out-of-Africa routes. The double green lines show the lower level of tolerance for hunter gatherers. The percentage of decades during which ANH could sustain themselves is colour-coded in blues. (Credit: Beyer et al. Fig 2)

Turning to climatic fluctuations, especially that of rainfall, Beyer et al. first estimated the lowest rainfall that hunter-gatherers can survive from the distribution of surviving groups according to annual precipitation and the biomass of grazing prey animals in their habitats. The lower limit is about 90 mm per year. Using the climate record for the Late-Pleistocene from proxies, such as oxygen isotopes, in global climate modelling produces a series of high-resolution ‘time-lapse snapshots’ of conditions in the geographic areas of interest – the Nile-Levant route and that from the Horn of Africa to Yemen. The results are expressed as the percentage of decades in each thousand-year interval that hunter-gatherers could sustain themselves under prevailing climatic conditions in the two regions. What seems clear from the figure (above) is that the southern, Bab el Mandab route had considerable potential for AMH migrants. The northern one looks as if it was more risky, as might be expected from today’s dominant aridity away from the Mediterranean and Gulf coasts. The northern route seems to have been just about feasible for these periods: 245-230; 220-210; 206-197; 132-94; 85-82; ~75 and ~72 ka. The climatic windows for possible migration via the southern route are: ~290; 275-240 (with optimums at ~273, ~269, ~246 and ~243); 230-210; 203-200; 182-145; 135-118; 112; 107; 70-30; 18-13 ka. The well documented beginning of major AMH migration into Eurasia was around 75 to 60 ka, which the southern route would most favour on climatic grounds. Yet before that there are many possibilities involving either route. Any AMH finds outside Africa before 250, and between 190-133 ka seem almost certain to have been via the southern route, based on arid conditions in the north. But, of course, there would have been other factors at play encouraging or deterring migration via either route. So perhaps not every climatic opportunity was exploited.

Beyer and colleagues have provided a basis for plenty of discussion and shifts in focus for future palaeo-anthropological work. One thing to bear in mind is that different humans may also have taken up the opportunities; for example, some Neanderthals are now suspected to have migrated back to Africa in the last 300 ka.

See also: Groucutt, H.S  and 22 others 2021. Multiple hominin dispersals into Southwest Asia over the past 400,000 years. Nature, ; DOI: 10.1038/s41586-021-03863-y

Arctic warmer than now half a million years ago

Just over a month since evidence emerged that the Arctic Ocean was probably filled with fresh water from 150 to 131 and 70 to 62 thousand years ago (When the Arctic Ocean was filled with fresh water, February 2021), another study has shaken ‘received wisdom’ about Arctic conditions. This time it is about the climate in polar regions, and comes not from an ice core but speleothem or calcium carbonate flowstone that was precipitated on a cave wall in north-eastern Greenland. The existence of caves at about 80°N between 350 to 670 m above sea level in a very cold, arid area is a surprise in itself, for they require flowing water to form. The speleothem is up to 12 cm thick, but none is growing under modern, relatively warm conditions, cave air being below freezing all year. For speleothem to form to such an extent suggests a long period when air temperature was above 0°C. So was it precipitated before glacial conditions were established in pre-Pleistocene times?

Limestone caves in the arid Grottedal region of north-eastern Greenland (Credit: Moseley et al. 2021; Fig 2D)

A standard means of discovering the age of cave deposits, such as speleothem or stalagmites, is uranium-series dating (see: Irish stalagmite reveals high-frequency climate changes, December 2001). In this case the sheet of flowstone turned out to have been deposited between 588 to 537 thousand years ago; a 50 ka ‘window’ into conditions that prevailed during the middle part of 100 ka climatic cycling – about 6 glacial-interglacial stages before present. (Moseley, G.E. et al. 2021. Speleothem record of mild and wet mid-Pleistocene climate in northeast Greenland. Science Advances, v. 7, online article  eabe1260; DOI: 10.1126/sciadv.abe1260). Roughly half the layer formed during an interglacial, the rest under glacial conditions that followed. Detailed oxygen-isotope studies revealed that air temperatures during which calcium carbonate was precipitated were at least 3.5°C above those prevailing in the area at present; warm enough to melt local permafrost and to increase the summer extent of ice-free conditions in the Arctic Ocean, thereby encouraging greater rainfall. These warm and wet conditions correlate with increased solar heating over the North Atlantic region at that time, as suggested by modelling based on Milankovich astronomical forcing.

Unfortunately, the climate record derived from cores through the Greenland ice sheet only reaches back to about 120 ka, during the last interglacial period. So it is not possible to match the speleothem results to an alternative data set. Yet, thanks to the rediscovery of dirt cored from the very base of the deepest part of the ice sheet (beneath Camp Century) in a freezer in Denmark – it was discarded as interest focused on the record preserved in the ice itself – there is now evidence for complete melting of the ice sheet at some time in the past. The dirt contains abundant fossil plants. Analysing radioactive isotopes of aluminium and beryllium that formed in associated quartz grains as a result of cosmic ray bombardment when the area was ice-free suggests two periods of complete melting followed by glaciation , the second  being within the last million years.

The onshore Arctic climate is clearly more unstable than previously believed.

See also:  Geologists Find Million-Year-Old Plant Fossils Deep Beneath Greenland Ice Sheet. Sci News, 16 March 2021.

Carbon emissions: It’s an ill wind…

The original saying emerged in Shakespeare’s Henry IV Part 2 (Act 5, Scene 3) during a jocular exchange when Ancient Pistol brings news from Court to Sir John Falstaff and other old codgers at dinner in Gloucestershire. Falstaff: ‘What wind blew you hither, Pistol?’ Pistol: ‘Not the ill wind which blows no man to good’. In the present context it seems anthropogenic CO2 emissions have staved off the otherwise inevitable launch of another glacial epoch. Climate-change deniers will no doubt pounce on this in the manner of a leopard seizing a tasty young monkey.

Auyuittuq National Park: Penny Ice Cap
Penny Ice Cap on Baffin Island ( credit: Wikipedia)

Climatologists at the Institute for Climate Impact Research in Potsdam, Germany, Potsdam University and the Santa Fe Institute in New Mexico, USA set out to develop a means for predicting the onset of ice ages (Ganopolski, A. et al. 2016. Critical insolation-CO2 relation for diagnosing past and future glacial inception. Nature, v. 529, p. 200-203) Many researchers have concluded from the oxygen isotope data in marine sediments, which tracks changes in the volume of glacial ice on land, that the end of previous interglacial periods by inception of prolonged climatic cooling may be attributed to reduction of solar heating in summer at high northern latitudes. This conclusion stems from Milankovic’s predictions from the Earth’s astronomically controlled orbital parameters and fits most of previous interglacial to glacial transitions. But summer insolation at 65°N is now more or less at one of these minima, with no signs of drastic global cooling; rather the opposite, as part of 7 thousand years of constant global sea level during the Holocene interglacial.

The latest supercomputer model of the Earth System (CLIMBER-2) has successfully ‘predicted’ the last eight ice ages from astronomical and other data derived from a variety of climate proxies. It also forecasts the next to have already begun, if atmospheric CO2 concentration was 240 parts per million; the level during earlier interglacials most similar to that in which we live. But the pre-industrial level was 280 ppm and the model suggests that would have put off the return of huge ice caps in the Northern Hemisphere for another 50 thousand years – partly because the present insolation minimum is not deep enough to launch a new ice age with that CO2 concentration – making the Holocene likely to be by far the longest interglacial since ice-age cycles began about 2.5 Ma ago. Based on current, industrially contaminated CO2 levels and a rapid curtailment of carbon emissions the model suggests no return to full glacial conditions within the next 100 ka and possibly longer; a consequence of the sluggishness of natural processes that draw-down CO2 from the atmosphere.

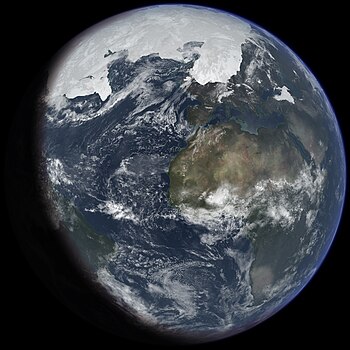
English: Ice age Earth at glacial maximum. Bas...
Simulation of the Earth at a glacial maximum. (Photo credit: Wikipedia)

So, does this indicate that unwittingly the Industrial Revolution and subsequent growth in the use of fossil fuels tipped the balance away from global cooling that would eventually have made vast tracts of both hemispheres uninhabitable? At first sight, that’s the way it looks. But the atmospheric carbon content of the 17th century would have resulted in much the same long drawn out Holocene interglacial; an unprecedented skipping of an ice age in the period covering most of the history of human evolution. This raises a question first posed by Bill Ruddiman in 2003: did human agriculture and associated CO2 emission begin the destabilisation of the Earth system shortly after Holocene warming and human ingenuity made farming and herding possible since about 10 thousand years ago?

But, consider this, the CLIMBER-2 Earth System model is said to be one of ‘intermediate complexity’ which is shorthand for one that relies on the ages-old scientific method of reductionism or basing each modelled scenario on modifying one parameter at a time. Moreover, for many parameters of the Earth’s climate system – clouds, dust, the cooling effect of increased winter precipitation as snow, and much else – scientists are pretty much in the dark (Crucifix, M. 2016. Earth’s narrow escape from a big freeze. Nature, v. 529, p. 162-163). Indeed it is still not certain whether CO2 levels have a naturally active or passive role in glacial-interglacial cycles, or something more complex than the simple cause-effect paradigm that still dominates much of science.

Glacial cycles and sea-floor spreading

The London Review of Books recently published a lengthy review (Godfrey-Smith, P. 2015. The Ant and the Steam Engine. London Review of Books, v. 37, 19 February 2015 issue, p. 18-20) of the latest contribution to Earth System Science by James Lovelock, the man who almost singlehandedly created that popular paradigm through his Gaia concept of a self-regulating Earth (Lovelock, J. A Rough Ride to the Future. Allen Lane: London; ISBN 978 0 241 00476 0). Coincidentally, on 5 February 2015 Science published online a startling account of the inner-outer-inner synergism of Earth processes and climate (Crowley, J.W. et al. 2015. Glacial cycles drive variations in the production of oceanic crust. Science doi:10.1126/science.1261508). In fact serendipity struck twice: the following day a similar online article appeared in a leading geophysics journal (Tolstoy, M. 2015. Mid-ocean ridge eruptions as a climate valve. Geophysical Research Letters, doi:10.1002/2014GL063015)

Both articles centred on the most common topographic features on the ocean floor, abyssal hills. These linear features trend parallel to seafloor spreading centres and the magnetic stripes, which chart the progressive additions to oceanic lithosphere at constructive margins. Abyssal hills are most common around intermediate- and fast-spreading ridges and have been widely regarded as fault-tilt blocks resulting from extensional forces where cooling of the lithosphere causes it to sag towards the abyssal plains. However, some have suggested a possible link with variations in magma production beneath ridge axes as pressure due to seawater depth varied with rising and falling sea level through repeated glacial cycles. Mantle melting beneath ridges results from depressurization of rising asthenosphere: so-called ‘adiabatic’ melting. Pressure changes equivalent to sea-level fluctuations of around 100-130 m should theoretically have an effect on magma productivity, falls resulting in additional volumes of lava erupted on the ocean floor and thus bathymetric highs.

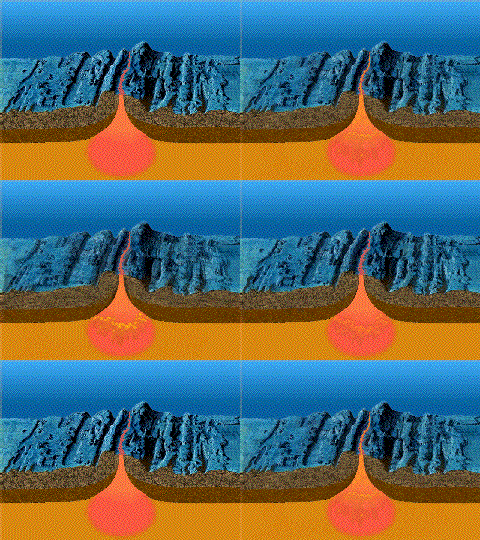
English: A close-up showing mid-ocean ridge to...
Formation of mid-ocean ridge topography, including abyssal hills that parallel the ridge axis. (credit: Wikipedia)

A test of this hypothesis would be see how the elevation of the sea floor adjacent to spreading axes changes with the age of the underlying crust. John Crowley and colleagues from Oxford and Harvard Universities and the Korea Polar Research Institute analysed new bathymetry across the Australian-Antarctic Ridge, whereas Maya Tolstoy of Columbia University performed similar work across the Southern East Pacific Rise. In both studies frequency analysis of changes in bathymetry through time, as calibrated by local magnetic stripes, showed significant peaks at roughly 23, 41 and 100 ka in the first study and at 100 ka in the second. These correspond to the well known Milankovitch periods due to precession, changing axial tilt and orbital eccentricity: persuasive support for a glacial control over mid-ocean ridge magmatism.

Enlarged by 100% & sharpened file with IrfanView.
Periodicities of astronomical forcing and global climate over the last million years (credit: Wikipedia)

An interesting corollary of the observations may be that pulses in sea-floor eruption rates emit additional carbon dioxide, which eventually percolates through the ocean to add to its atmospheric concentration, which would result in climatic warming. The maximum effect would correspond to glacial maxima when sea level reached its lowest, the reduction in pressure stimulating the greatest magmatism. One of the puzzling features of glacial cycles over the last million years, when the 100 ka eccentricity signal dominates, is the marked asymmetry of the sea-level record; slowly declining to a glacial maximum and then a rapid rise due to warming and melting as the Earth changed to interglacial conditions. Atmospheric CO2 concentrations recorded by bubbles in polar ice cores show a close correlation with sea-level change indicated by oxygen isotope data from oceanic sediments. So it is possible that build-up of polar ice caps in a roundabout way eventually reverse cooling once they reach their greatest thickness and extents, by modulating ocean-ridge volcanism and thereby the greenhouse effect.

Dust: heating or cooling?

In the left image, thin martian clouds are vis...
Mars: with and without dust storms in 2001. Image via Wikipedia

Once every 13 years on average dust blots out most of the surface of Mars turning it into an orange ball. The last such planet-encircling dust storm occurred in 2001, but lesser storms spring up on a seasonal basis. Yet Martian seasons have very different weather from terrestrial ones because of the greater eccentricity of Mars’s orbit, as well as the fact that its ‘weather’ doesn’t involve water. When Mars is closest to the Sun solar heating is 20% greater than the average, for both hemispheres. The approach to that perihelion marks the start of the dust season which last a half the Martian year. Unsurprisingly, the sedimentary process that dominates Mars nowadays is the whipping up and deposition of sand and dust, though in the distant past catastrophic floods – probably when subsurface ice melted – sculpted a volcanic landscape pockmarked with impact craters up to several thousand kilometres across. Waterlain sediments on early Mars filled, at least in part, many of the earlier craters and probably blanketed the bulk of its northern hemisphere that is the lowest part of the planet and now devoid of large craters. Erosion and sedimentation since that eventful first billion years has largely been aeolian. Some areas having spectacular dunes of many shapes and sizes, whereas more rugged surfaces show streamlined linear ridges, or yardangs (http://earth-pages.co.uk/2011/05/08/winds-of-change/), formed by sand blasting. Most of the dust on Mars is raised by high winds in the thin atmosphere sweeping the great plains and basins, and, by virtue of Stokes’s law, the grains are very much smaller than on Earth.

The dustiest times on Earth, which might have blotted out sizeable areas from alien astronomers, in the last million years have been glacial maxima, roughly every 100 ka with the latest 20 ka ago. Layering in the Antarctic ice core records such dust-dominated frigid periods very precisely. Less intricate records formed away from the maximum extent of ice sheets as layers of fine sediment known as loess, whose thickness variations match other proxy records of palaeoclimate nicely. Loess, either in place or redeposited in alluvium by rivers, forms the most fertile soil known – when the climate is warm and moist. The vast cereal production of lowland China and the prairies of North America coincides with loess: it may seem strange but a large proportion of 7 billion living humans survive partly because of dust storms during glacial periods of the past.

Being derived from rock-forming minerals dust carries with it a diverse range of chemical elements, including a critical nutrient common on land but in short supply in ocean water far offshore: iron in the form of oxide and hydroxide coatings on dust particles – the dust coating your car after rain often has a yellow or pinkish hue because of its iron content. Even when the well-known ‘fertilizer’ elements potassium, nitrogen and phosphorus are abundant in surface ocean water, they can not encourage algal phytoplankton to multiply without iron. Today the most remote parts of the oceans have little living in their surface layers because of this iron deficiency. Yet oceanographers and climatologists are pretty sure that this wasn’t always the case. They are confident simply because reducing the amount of atmospheric carbon dioxide and its greenhouse effect to levels that would encourage climate cooling and glacial epochs needed more carbon to be buried on the ocean floors than happens nowadays, and lifeless ocean centres would not help in that.

Dust plume off the Sahara desert over the nort...
Saharan dust carried over the Atlantic Ocean by a tropical cyclone. Image via Wikipedia

At present, the greatest source of atmospheric dust is the Sahara Desert (bartholoet, J. 2012. Swept from Africa to the Sahara. Scientific American, v. 306 (February 2012), p. 34-39). Largely derived from palaeolakes dating from a Holocene pluvial episode, Saharan dust accounts for more than half the two billion metric tonnes of particulate atmospheric aerosols dispersed over the Earth each year. Located in the SE trade-wind belt, the Sahara vents dust clouds across the Atlantic Ocean, most to fall there and contribute dissolved material to the mid-ocean near-surface biome but an estimated 40 million t reaches the Amazon basin, contributing to fertilising the otherwise highly leached tropical rain-forest soils. While over the ocean the high albedo of dust adds a cooling effect to the otherwise absorbent sea surface. Over land the fine particles help nucleate water droplets in clouds and hence encourages rainfall. The climatic functions of clouds and dusts are probably the least known factors in the climatic system, a mere 5% uncertainty in their climatic forcing may mean the difference between unremitting global warming ahead or sufficient cooling by reflection of solar radiation to compensate for the cumulative effects of industrial CO2 emissions.

Recording amounts of dust from marine sediments quantitatively is very difficult and impossible in terrestrial sediments, but superb records tied accurately to time at annual precision exist in ice sheets. Low dust levels in Greenland and Antarctic ice tally well with the so-called ‘Medieval Climate Anomaly’ (a warm period) whereas through the 13th to 19th centuries (the ‘Little Ice Age’) more dust than average circulated in the atmosphere. Crucially, for climate change in the industrial era, there has been a massive spike in dust reaching near-polar latitudes since the close of the 18th century during the period associated with signs of global warming: a counterintuitive relationship, but one that is difficult to interpret. The additional dust may well be a result of massive changes in land use across the planet following industrialised agricultural practices and growing population. There are several  questions: does the additional dust also reflect global warming with which it is correlated, i.e. evaporation of the huge former lakes in the Sahara (e.g. Lake Chad); is the dust preventing additional greenhouse warming that would have taken place had the atmosphere been clearer; is it even the ‘wrong kind of dust’, which may well reflect short-wave solar radiation away but also absorbs the longer wavelength thermal radiation emitted by the Earth’s surface, i.e. an aerosol form of greenhouse warming. Needless to say, neither clouds nor dust can be factored into climate prediction models with much confidence.