Thin- or thick-skinned tectonics: a test

How the continental lithosphere deforms at convergent plate margins has been a matter of opinion that depends on where observations have been made in ancient orogenic belts. One view is that arc and collisional orogens are dominated by deformation of the upper crust and especially the cover of sedimentary and volcanic rocks above deeper and older basement. This is a ‘thin-skinned’ model in which rocks of the upper crust are detached from those below and thicken more or less independently by thrust faulting, the formation of ductile nappes or a combination of the two. Mountain ranges, in this view, are the product of piling up of thrust slices or nappes, as exemplified by the Alps, Canadian Rockies and the Caledonian thrust belt of NW Scotland. Thick-skinned processes, as the name suggests, see crustal shortening and thickening as being distributed through the crust from top to bottom and even involving the lithospheric mantle. The hinterlands of both the Alps and the Scottish Caledonides show plenty of evidence for entire-crust deformation, deep crustal rocks being found sheared together with deformed rocks of the cover. It stands to reason that orogenic processes on the grand scale must involve a bit of both.

Both hypotheses stem from field work in deeply eroded, structurally complex segments of the ancient crust, and it is rarely if ever possible to say whether both operated together or one followed the other during the often lengthy periods taken by orogeny to reach completion, and the sheer scale of the process. Orogenesis is going on today, to which major seismic activity obviously bears witness. But erosion has not progress from cover through basement so, up to now, only seismicity and geodetic GPS measurements have been available to show that continental crust in general is being shortened and thickened, as well as being moved about. Potentially, a means of assessing active deformation, even in the deep crust, is to see whether or not the speeds of seismic waves at different depths are biased depending on their direction of travel. Such anisotropy would develop if the mineral grains making up rocks were deformed and rotated to preferred directions; a feature typical of metamorphic rocks. But to make such measurements on the scale of active orogens requires a dense network of seismometers and software that can tease directionality and depth out of the earthquake motions detected by it.

LS-tectonite from the Paraiba do Sul Shear Zon...
Aligned minerals in a Brazilian metamorphic rock (credit: Eurico Zimbres in Wikipedia)

A joint Taiwanese-American consortium set up such a network in Taiwan, which is capable of this type of seismic tomography. Taiwan is currently taking up a strain rate of 8.2 cm per year due to motion of the Philippine Plate on whose western flank the island lies: it is part of an island arc currently colliding with the stationary Eurasian Plate and whose crust is shortening. Results of seismic anisotropy (Huang, T.-Y. et al. 2015. Layered deformation in the Taiwan orogen. Science, v. 349, p. 720-723) show that the fast direction of shear (S) waves changes abruptly at about 10 to 15 km deep in the crust. In the upper crust this lines up with the roughly N-S structural ‘grain’ of the orogen. At between 13 to 17 km down there is no discernible anisotropy, below which it changes to parallel the direction of plate motion, ESE-WNW. It seems that thin skinned tectonics is indeed taking place, although probably not above a structural detachment. Simultaneously the deep crust is being deformed but the shearing is ascribed to the descent of lithospheric mantle of the Philippine Plate beneath the Eurasian Plate, while the deep crust remains attached to the upper crust. If it were possible to examine the mineral lineations now forming in both the Taiwanese upper and lower crust where metamorphism is active, then the two directions would be apparent. Although not mentioned by the authors, perhaps the detection of different directionality of aligned metamorphic minerals in low- and high-grade metamorphic rocks might indicate such tectonic processes in the past.

Roman concrete restrains magma

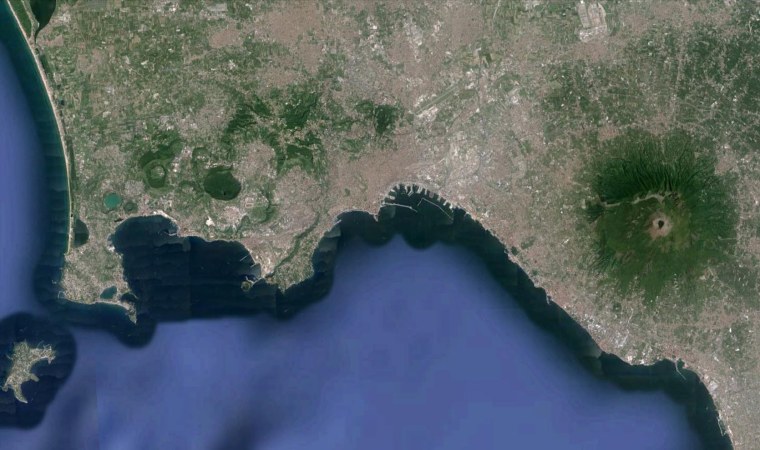
Four million people in and around the Italian city of Naples on the shore of the Tyrrhenian Sea have always lived under a double threat of natural disaster. The one that immediately springs to most people’s mind is the huge volcano Vesuvius that looms over its eastern suburbs, for this was the source of the incandescent pyroclastic flow that overwhelmed Pompeii and Herculaneum in 79 CE. Less familiar outside Italy is a cluster of elliptical volcanic features directly to the west of the city: Campi Flegrei or the Phlegraean Fields. In fact the cluster is part of a vast, dormant caldera, half of which lies beneath the sea centred on the ancient Roman port of Puteoli (modern Pozzuoli). This volcanic collapse structure is about 10 km across; about as large as Vesuvius. Campi Flegrei is famous for its sulfur-rich fumaroles including the mythical crater home of Vulcan the god of fire, Solfatara.

The Bay of Naples with Vesuvius to the east of the city and Campi Flegrei to the west. (credit: Google Earth)

Between 1970 and 1984 the ground around Pozzuoli rose more than 2 metres, which may be evidence that the deep seated magma chamber is inflating. Fears that this might presage an eruption in the near future stems from a curious feature affecting archaeological remains, such as upright pillars in the harbour area of Pozzuoli. At many different levels the stonework is pockmarked by curious holes that are the fossil borings of marine molluscs: at some stage the feet of the pillars descended below sea level. Together with historic records since the Roman era these borings help to establish the local ups and downs of the surface over the last two millennia in considerable detail. From a high of 4 m above sea level when the pillars were erected 194 BCE they slowly subsided to reach sea level around 300 CE when Puteoli ceased to be an important harbour and 4 metres below that around 900 CE. For the last millennium they have slowly risen until in 1538 more than 4 metres of inflation took place very rapidly. That was immediately followed by a small eruption of about 0.02 km3 of magma at Mount Nuovo, to the northeast of another recent crater now occupied by a lake: hence the fear surrounding the uplift in 1970-84. Campi Flegrei has a history of eruptions going back 40 thousand years, including two in the ‘super volcano’ category of 200 and 40 km3 that blanketed vast areas in pyroclastic ash.

One tantalising aspect of the ground inflation and deflation is that each cycle lasts of the order of a thousand years. Another seems to be that magma breaks to the surface very rapidly after a long period of inflation, as if whatever was keeping the magma chamber in a metastable state failed in a brittle fashion. Tiziana Vanorio and Waruntorn Kanitpanyacharoen of Stanford and Chulalonkorn universities in the US and Thailand have come up with a possible reason for such gradual crustal warping in volcanic areas and long-delayed eruption, for which Campi Flegrei is a model case (in fact the oscillations there are unsurpassed). Such long-term bending of the crust suggests abnormally strong rock near the surface. The co-workers analysed borehole cores that penetrated to the depth of small shallow earthquakes – in the metamorphic basement of the area – and found that the zone above the seismically active layer is not only stronger than the basement, but closely resembles a construction material to which Roman architecture owes its longevity (Vanorio, T. & Kanitpanyacharoen, W. 2015. Rock physics of fibrous rocks akin to Roman concrete explains uplifts at Campi Flegrei Caldera. Science, v. 349, p. 617-621).

Deutsch: Pozzuoli, Macellum
Mollusc-bored pillars in the Macellum (indoor market) of Pozzuoli (credit: Wikipedia)

Roman masons discovered that by mixing young, loose volcanic ash with lime mortar (calcium hydroxide) produced a strong concrete when cured. Specifically, the invention of concrete took place at Pozzuoli itself, using volcanic ash from Campi Flegrei and the product was known as pozzolana. Young ash from an explosive volcano is mainly shards of anhydrous silicate glass, which quickly react with water and calcium hydroxide to produce fibres of hydrous calc-silicate minerals, almost as in conventional cement curing, but without the need for heating limestone and clay to very high temperatures. The strength of pozzolano enabled Roman architects to build the great dome of the Pantheon in Rome, still the world’s largest unreinforced concrete dome. Moreover, the speed with which it sets by exothermic reactions enables its use below sea level. Vanorio and Kanitpanyacharoen found that the strong upper zone beneath Campi Flegrei is almost identical to pozzolano, and suggest that it formed as a result of calcium-rich hydrothermal fluids percolating through young pyroclastic rocks. The calcium derives from metamorphic basement rich in calc-silicate layers through which hot groundwater is driven as a result of heat from the underlying magma chamber. It seems the Campi Flegrei caldera has built its own containing dome. But that is perhaps a mixed blessing: the 1970-84 inflation seems now to be deflating and the flexible carapace may make using ground movements as means of predicting eruptions unreliable.

Intérieur du panteon à Rome
Interior view of the dome of the Pantheon in Rome (credit: Wikipedia)

When Earth got its magnetic field

For a planet to produce life it needs various attributes. Exoplanet hunters tend to focus on the ‘Goldilocks’ Zone’ where solar heating is neither so extreme nor so little that liquid water is unstable on a planet’s surface. It also needs an atmosphere that retains water. Ultraviolet radiation emitted by a planet’s star dissociates water vapour to hydrogen and oxygen and the hydrogen escapes to space. The reason Earth has not lost water in this way is that little water vapour reaches the stratosphere because it is condensed or frozen out of the air as the lower atmosphere becomes cooler with altitude. Given moist conditions survivability to the extent that exists on Earth still needs another planetary parameter: the charged particles emitted as an interplanetary ‘wind ‘by stars must not reach the surface. If they did, their potential to break complex molecules would hinder life’s formation or wipe it out if it ventured onto land. A moving current of electrical charge, which is what a stellar ‘wind’ amounts to, can be deflected by a magnetic field. This is what happens on Earth, whose magnetic field is a good reason why our planet has supported life and its continual evolution since at least about 3.5 billion years ago.

Artist's rendition of Earth's magnetosphere.
Deflection of the solar ‘wind’ by Earth’s Earth’s magnetosphere. (credit: Wikipedia)

Direct proof of the existence of a geomagnetic field is the presence of aligned particles of magnetic minerals in rocks, for instance in a lava flow, caused by their acquiring magnetisation in a prevailing magnetic field once they cooled sufficiently. The earliest such remanent magnetism was found in igneous rocks from north-eastern South Africa dated at between 3.2 to 3.45 billion years. All older rocks do not show such a feature dating back to their formation because of thermal metamorphism that resets any remanent magnetism to match the geomagnetic field prevailing at the time of reheating. There are, however, materials that formed further back in time and are also known to resist thermal resetting of any alignments of magnetic inclusion. They are zircons (ZrSiO4), originally crystallised from igneous magmas, which may have locked in minute magnetic inclusions. Zircons are among the most change-resistant materials and they can also be dated with great precision, with the advantage that the U-Pb method used can distinguish between age of formation and that of any later heating. Famously, individual grains of zircon that had accumulated in an early Archaean conglomerate outcropping in the Jack Hills of Western Australia yielded ages going back from 3.2 to 4.4 billion years; far beyond the age of any tangible rock and close to the formation age of the Earth. Quite a target for palaeomagnetic investigations once a suitable technique had been developed.

Western Australia's Jack Hills
Western Australia’s Jack Hills from Landsat (credit NASA Earth Observatory)

John Tarduno and colleagues from the Universities of Rochester and California USA and the Geological Survey of Canada report the magnetic properties of the Jack Hills zircons (Tarduno, J.A. et al. 2015. A Hadean to Paleoarchean geodynamo recorded by single zircon crystals. Science, v. 349, p. 521-524). All of the grains analysed record magnetisation spanning the period 3.2 to 4.2 billion years that indicate geomagnetic field strengths ranging from that found today at the Equator to about an eighth of the modern value. So from 4.2 Ga onwards geomagnetism probably deflected the solar wind: the early Earth was set for living processes from its earliest days. The discovery also supports the likelihood of functioning plate tectonics during the Hadean.

Pleistocene megafaunal extinctions – were humans to blame?

Australia and the Americas had an extremely diverse fauna of large beasts (giant wombats and kangeroos in Australia; elephants, bears, big cats, camelids, ground sloths etc in the Americas) until the last glaciation and the warming period that led into the Holocene interglacial. The majority of these megafauna species vanished suddenly during that recent period. To a lesser extent something similar happened in Eurasia, but nothing significant in Africa. Because the last glacial cycle also saw migration of efficient human hunter-gatherers to every other continent except Antarctica, many ecologists, palaeontologists and anthropologists saw a direct link between human predation and the mass extinction (see Earth-Pages of April 2012. Earlier humans had indeed spread far and wide in Eurasia before, and the crude hypothesis that the last arrivals in Australasia and the Americas devoured all the meatiest prey in three continents had some traction as a result: predation in Eurasia and Africa by earlier hominids would have made surviving prey congenitally wary of bipeds with spears. In Australia and the Americas the megafauna species would have been naive and confident in their sheer bulk, numbers, speed and, in some cases, ferocity. Other possibilities emerged, such as the introduction of viruses to which faunas had no immunity or as a result of climate change, but none of the three possibilities has gained incontrovertible proof. But the most popular, human connection has had severe knocks in the last couple of years. A fourth, that the extinctions stemmed from a comet impact proved to have little traction.

English: s were driven to extinction by and hu...
Megafauna in a late-Pleistocene landscape including woolly mammoths and rhinoceroses, horses, and cave lions with a carcass. (credit: Wikipedia)

Since the amazing success of analysing the bulk DNA debris in sea water – environmental DNA or eDNA – to look at the local diversity of marine animals, the analytical and computing techniques that made it possible have been turned to ancient terrestrial materials: soils, permafrost and glacial ice. One of the first attempts revealed mammoth and pre-Columbian horse DNA surviving in Alaskan permafrost, thanks to the herds’ copious urination and dung spreading. Several articles in the 24 July 2015 issue of Science review ancient DNA advances, including eDNA from soils that chart changes in both fauna and flora over the last glacial cycle (Pennisi, E. 2015. Lost worlds found. Science, v. 349, p. 367-369). Combined with a variety of means of dating the material that yield the ancient eDNA, an interesting picture is emerging. The soil and permafrost samples potentially express ancient ecosystems in far more detail than would fossil animals or pollens, many of which are too similar to look at the species level and in any case are dominated by the most abundant plants rather than showing those critical in the food chain.

Nunavut tundra
Plants of the Arctic tundra in Nunavut, Canada (Photo credit: Wikipedia)

The first major success in palaeoecology of this kind came with a 50-author paper using eDNA ‘bar-coding’ of permafrost from 242 sites in Siberia and Alaska IWillerslev, E. and 49 others 2014. Fifty thousand years of Arctic vegetation and megafaunal diet. Nature, v. 506, p. 47-51. doi:10.1038/nature12921). Dividing the samples into 3 time spans – 50-25, 25-15 (last glacial maximum) and younger than 15 ka – the team found these major stages in the last glacial cycle mapped an ecological change from a dry tundra dominated by abundant herbaceous plants (forbs including abundant anemones and forget-me-not), to a markedly depleted Arctic steppe ecosystem then moist tundra with woody plants and grasses dominating. They also analysed the eDNA of dung and gut contents from ice-age megafauna, such as mammoths, bison and woolly rhinos, where these were found, which showed that forbs were the mainstay of their diet. Using bones of large mammals 6 member of the team also established the timing of extinctions in the last 56 ka (Cooper, A. et al. 2015. Abrupt warming events drove Late Pleistocene Holarctic megafaunal turnover. Science, DOI: 10.1126/science.aac4315), showing 31 regional extinction pulses linked to the rapid ups and downs of climate during Dansgaard-Oeschger cycles in the run-up to the last glacial maximum. By the end of the last glacial maximum, the megafauna were highly stressed by purely climatic and ecological factors. Human predation probably finished them off.

How far has geochemistry led geology?


Granite pmg ss 2006
Thin section of a typical granite: clear white and grey grains are quarts (silica); striped black and white is feldspar; coloured minerals are micas (credit: Wikipedia)

In the Solar System the Earth is unique in having a surface split into two distinct categories according to their relative elevation; one covered by water, the other not. More than 60% of its surface – the ocean basins – falls between 2 to 11 km below sea level with a mean around 4 to 5 km deep. A bit less than 40% – land and the continental shelves – stands higher than 1 km below sea level up to almost 9 km above, with a mean around 1 km high. Between 1 and 2 km below sea level is represented by only around 3 % of the surface area. This combined hypsography and wetness is reckoned to have had a massive bearing on the course of climate and biological evolution, as far as allowing our own emergence. The Earth’s bimodal elevation stems from the near-surface rock beneath each division having different densities: continental crust is less dense than its oceanic counterpart, and there is very little crustal rock with an intermediate density. Gravitational equilibrium ensures that continents rise higher than oceans. That continents were underpinned mainly by rocks of granitic composition and density, roughly speaking, was well known by geologists at the close of the 19th century. What lay beneath the oceans didn’t fully emerge until after the advent of plate tectonics and the notion of simple basaltic magmas pouring out as plates became detached.

In 1915 Canadian geologist Norman Levi Bowen resolved previously acquired knowledge of the field relations, mineralogy and, to a much lesser extent, the chemistry of igneous rocks, predominantly those on the continents in a theory to account for the origin of continents. This involved a process of distillation or fractionation in which the high-temperature crystallisation of mafic (magnesium- and iron-rich) minerals from basaltic magma left a residual melt with lower Mg and Fe, higher amounts of alkalis and alkaline earth elements and especially enriched in SiO2 (silica). A basalt with ~50% silica could give rise to rocks of roughly granitic composition (~60% SiO2) – the ‘light’ rocks that buoy-up the continental surface – through Bowen’s hypothetical fractional crystallisation. Later authors in the 1930s, including Bowen’s teacher Reginald Aldworth Daly, came up with the idea that granites may form by basalt magma digesting older SiO2-rich rocks or by partially melting older crustal rocks as suggested by British geologist Herbert Harold Read. But, of course, this merely shifted the formation of silica-rich crust further back in time

A great deal of field, microscope and, more recently, geochemical lab time has been spent since on to-ing and fro-ing between these hypotheses, as well as on the petrology of basaltic magmas since the arrival of plate theory and the discovery of the predominance of basalt beneath ocean floors. By the 1990s one of the main flaws seen in Bowen’s hypothesis was removed, seemingly at a stroke. Surely, if a basalt magma split into a dense Fe- Mg-rich cumulate in the lower crust and a less dense, SiO2-rich residual magma in the upper continental crust the bulk density of that crust ought to remain the same as the original basalt. But if the dense part somehow fell back into the mantle what remained would be more able to float proud. Although a neat idea, outside of proxy indications that such delamination had taken place, it could not be proved.

Since the 1960s geochemical analysis has became steadily easier, quicker and cheaper, using predominantly X-ray fluorescence and mass-spectrometric techniques. So geochemical data steadily caught up with traditional analysis of thin sections of rock using petrological microscopes. Beginning in the late 1960s igneous geochemistry became almost a cottage industry and millions of rocks have been analysed. Recently, about 850 thousand multi-element analyses of igneous rocks have been archived with US NSF funding in the EarthChem library. A group from the US universities of Princeton, California – Los Angeles and Wisconsin – Madison extracted 123 thousand plutonic and 172 thousand volcanic igneous rocks of continental affinities from EarthChem to ‘sledgehammer’ the issue of continent formation into a unified theory (Keller, C.B. et al. 2015. Volcanic-plutonic parity and the differentiation of the continental crust. Nature, v. 523, p. 301-307).

In a nutshell, the authors compared the two divisions in this vast data bank; the superficial volcanic with the deep-crustal plutonic kinds of continental igneous rock. The gist of their approach is a means of comparative igneous geochemistry with an even longer pedigree, which was devised in 1909 by British geologist Alfred Harker. The Harker Diagram plots all other elements against the proportionally most variable major component of igneous rocks, SiO2. If the dominant process involved mixing of basalt magma with or partial melting of older silica-rich rocks such simple plots should approximate straight lines. It turns out – and this is not news to most igneous geochemists with far smaller data sets – that the plots deviate considerably from straight lines. So it seems that old Bowen was right all along, the differing deviations from linearity stemming from subtleties in the process of initial melting of mantle to form basalt and then its fractionation at crustal depths. Keller and colleagues found an unexpected similarity between the plutonic rocks of subduction-related volcanic arcs and those in zones of continental rifting. Both record the influence of water in the process, which lowers the crystallisation temperature of granitic magma so that it freezes before the bulk can migrate to the surface and extrude as lava. Previously. rift-related magmas had been thought to be drier than those formed in arcs so that silica-rich magma should tend to be extruded.

But there is a snag, the EarthChem archive hosts only data from igneous rocks formed in the Phanerozoic, most being less than 100 Ma old. It has long been known that continental crust had formed as far back as 4 billion years ago, and many geologists believe that most of the continental crust was in place by the end of the Precambrian about half a billion years ago. Some even reckon that igneous process may have been fundamentally different before 3 billion years ago(see: Dhuime, B., Wuestefeld, A. & Hawkesworth, C. J. 2015. Emergence of modern continental crust about 3 billion years ago.  Nature Geoscience, v. 8, p.552–555). So big-science data mining may flatter to deceive and leave some novel questions unanswered .


Hallucigenia gets a head

The Middle Cambrian Burgess Shale of the Canadian Rockies is one of those celebrated sediments that show extraordinary preservation of soft-bodied and easily disarticulated organisms and rich assemblages of fossils. Being one of the earliest known of such lagerstätten, many of the denizens of the ecosystem in which the shale originated were at first regarded as members of hitherto undiscovered and now vanished phyla, the basal branches of the ‘tree of life’. Some certainly looked pretty odd, such as Opabina with a feeding apparatus looking similar to the extension nozzle of a vacuum cleaner; but that is clearly some kind of arthropod. Others turned out to be astonishingly large, once it was realised that parts of their broken bodies had previously been taken to be different organisms, an example being Anomalocaris. But perhaps the oddest, certainly to palaeontologists, was Hallucigenia. However, there are plenty of even more weird and wonderful living creatures, such as the sea pig, although modern creatures are more easily pigeonholed, taxonomically speaking.

Halucigenia as originally reconstruicted (i.e....
Hallucigenia as originally reconstructed; i.e. upside-down. (credit: Wikipedia)

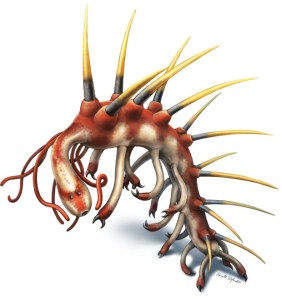
The trouble with Hallucigenia was not so much its complexity – it was a fairly simple-looking beast – but that there were two choices as to which way up it lived; a feature that surprisingly led to a great deal of pondering that ended with the scientist who formally described it in 1977 making the wrong choice. That was eventually resolved fourteen years later, but the creature might also have inspired the Pushmi Pullyu in Hugh Lofting’s Dr Doolittle stories for children. Not that it resembled a unicorn-gazelle cross: far from it, for no-one could decide which its front was and which its backside, and even if it may have lain on its side. But Hallucigenia does demonstrate bilateral symmetry beautifully – it must have a front and back, and a top and bottom, even though which was which remained veiled in mystery – and so belongs to the dominant group of animals, imaginatively known as bilaterians.

The Burgess Shale lagerstätte seemingly was heaving with Hallucigenia so would-be taxonomists have had no shortage of specimens to ponder over in the 38 years since Simon Conway Morris made his dreadful mistake: of course, that was not of such enormity as Einstein’s ‘biggest blunder’ in the form of his cosmological constant, and Conway Morris quickly accepted his error when the beast was turned right-way-up in 1991. The problem is, exquisite as they are, Burgess Shale fossils are flattened and all that remains of mainly soft-bodied animals are delicate carbonaceous films, which need electron microscopy to unravel.

The latest reconstruction of Hallucigenia, by palaeontological illustrator Danielle Dufault (http://www.ddufault.com)
The latest reconstruction of Hallucigenia, by palaeontological illustrator Danielle Dufault

In 2015, Hallucigenia’s front end was definitely found and a great deal more besides by Canadian palaeontologists Martin Smith and Jean-Bernard Caron of the Royal Ontario Museum and the University of Toronto (Smith, M.R. & Caron J.-B. 2015. Hallucigenia’s head and the pharyngeal armature of early ecdysozoans. Nature, v. 523, p. 75-78). It has eyes, albeit rudimentary, and a throat, deep within which it has pointy teeth. Hallucigenia was a lobopod, whose living relatives lie within that large and diverse group the Ecdysozoa, which all have throat teeth and include the wondrous water bear (tardigrade) and the velvet- and penis worms (onychophores and priapulids, respectively) as well as lobsters, flies and woodlice. It may indeed have been close to the last common ancestor of all animals who moult their carapaces.

Picture of the month, June 2015

SpheroidalIMG_4815
Spheroidally weathered basalt from Turkey. (credit: Francisco Sousa)

Spheroidal weathering of lavas, easily confused with pillows, is also found in other homogeneous igneous rocks. It develops from rectilinear joint sets along which the groundwater responsible for breakdown of silicates initially moves. Hydration reactions begin along the joints but proceed most quickly at corners so that curved surfaces begin to develop. The concentric  banding that sometimes culminates in almost spherical relics may involve more than just rotting of anhydrous silicates as the reactions involve volume increases that encourage further rock fracturing. Other factors, such as elastic strain release may also encourage the characteristic concentricity Prolonged, intense chemical weathering leaves isolated, rounded corestones surrounded by saprolite, that can form boulder fields when the softer weathered material has been eroded away.

Are coral islands doomed by global warming?

Among the most voluble and persistent advocates of CO2 emissions reduction are representatives of islands in the tropics that are built entirely of reef coral. All the habitable land on them reaches only a few metres above high-tide level, so naturally they have more cause to worry about global warming and sea-level rise than most of us. Towns and villages on some atolls do seem to be more regularly inundated than they once were. So a group of scientists from New Zealand and Australia set out to check if there have been losses of land on one Pacific atoll, Funafuti, during the century since tidal observatories first recorded an average 1.7 mm annual rise in global sea level and a faster rate (~3 mm a-1) since 1993 (Kench, P.S. et al. 2015. Coral islands defy sea-level rise over the past century: Records from a central Pacific atoll. Geology, v. 43, p.515-518).

English: Funafuti (Tuvalu) from space Magyar: ...
Funafuti atoll (Tuvalu) from space (credit: Wikipedia)

Funafuti atoll comprises 32 islands that make up its rim, with a range of sizes, elevations, sediment build-ups and human modifications. The atoll was first accurately surveyed at the end of the 19th century, has aerial photographic cover from 1943, 1971 and 1984 and high-resolution satellite image coverage from 2005 and 2014, so this is adequate to check whether or not sea-level rise has affected the available area and shape of the habitable zone. It appears that there has been no increase in erosion over the 20th century and rather than any loss of land there has been a net gain of over 7%. The team concludes that coral reefs and islands derived from their remains and debris are able to adjust their size, shape and position to keep pace with sea level and with the effects of storms.

English: Looking west from a beach on Fongafal...
Beach on Fongafale Islet part of Funafuti Atoll, Tuvalu. (credit: Wikipedia)

This is an observation of just one small community in the vastness of the Pacific Ocean, so is unlikely to reassure islanders elsewhere who live very close to sea level and are anxious. It is a finding that bears out longer-term evidence that atolls remained stable during the major sea-level changes of the post-glacial period until about 7 thousand years ago when land glaciers stabilised. Since coral grows at a surprisingly rapid rate, that growth and the local redistribution of debris released by wave action keep pace with sea-level change; at least that taking place at rates up to 3 mm per year. But the study leaves out another threat from global warming. Corals everywhere are starting to show signs of ill thrift, partly resulting from increasing acidity of seawater as more CO2 dissolved in it and partly from increases in sea-surface temperature, as well a host of other implicated factors. This manifests itself in a phenomenon known as coral bleaching that may presage die-off. Should coral productivity decrease in the Pacific island states then the material balance shifts to land loss and sea level will begin an irresistible threat.

Flourishing life during a Snowball Earth period

That glacial conditions were able to spread into tropical latitudes during the late Neoproterozoic, Cryogenian Period is now well established, as are the time spans of two such events. http://earth-pages.co.uk/2015/05/21/snowball-earth-events-pinned-down/ But what were the consequences for life that was evolving at the time? That something dramatic was occurring is signalled by a series of perturbations in the carbon-isotope composition of seawater. Its relative proportion of 13C to 12C (δ13C) fell sharply during the two main Snowball events and at other times between 850 to 550 Ma. Since 12C is taken up preferentially by living organisms, falls in δ13C are sometimes attributed to periods when life was unusually suppressed. It is certain that the ‘excursions’ indicate that some process(es) must have strongly affected the way that carbon was cycled in the natural world.

English: Earth, covered in ice.
Artist’s impression of a Snowball Earth as it would appear with today’s continental configuration adjacent to the East Pacific Ocean. (Photo credit: Wikipedia)

The further sea ice extended beyond landmasses during Snowball events the more it would reduce the amount of sunlight reaching the liquid ocean and so photosynthesis would be severely challenged. Indeed, if ice covered the entire ocean surface – the extreme version of the hypothesis – each event must have come close to extinguishing life. An increasing amount of evidence, from climate- and oceanographic modelling and geological observation, suggests that a completely icebound Earth was unlikely. Nevertheless, such dramatic climate shifts would have distressed living processes to the extent that extinction rates were high and so was adaptive radiation of survivors to occupy whatever ecological niches remained or came into being: evolution was thereby speeded up. The roughly half-billion years of the Neoproterozoic hosted the emergence and development of multicellular organisms (metazoan eukaryotes) whose cells contained a nucleus and other bodies such as mitochondria and the chloroplasts of photosynthesisers. This hugely important stage of evolution burst forth shortly after – in a geological sense – the last Snowball event, during the Ediacaran and the Cambrian Explosion. But recent investigations by palaeontologists in glaciogenic rocks from China unearthed a rich diversity of fossil organisms that thrived during a Snowball event (Ye, Q. et al. 2015. The survival of benthic macroscopic phototrophs on a Neoproterozoic snowball Earth. Geology, v. 43, p. 507-510).

The Nantuo Formation in southern China contains glaciogenic sedimentary rocks ascribed to the later Marinoan glaciation (640 to 635 Ma). Unusually, the pebbly Nantuo glaciogenic rocks contain thin layers of siltstones and black shales. The fact that these layers are free of coarse fragments that floating ice may have dropped supports the idea that open water did exist close to glaciated landmasses in what is now southern China. Palaeomagnetic measurements show that the area was at mid-latitudes during the Marinoan event. The really surprising feature is that they contain abundant, easily visible fossils in the form of carbonaceous ribbons , disks, branching masses and some that dramatically resemble complex multi-limbed animals, though they are more likely to be part of an assemblage of algal remains. Whatever their biological affinities, the fossils clearly signify that life happily flourished beneath open water where photosynthesis provided a potential base to a food chain, though no incontrovertible animals occur among them.

See also: Corsetti, F.A. 2015. Live during Neoproterozoic Snowball Earth. Geology, v. 43, p. 559-560.

Two happy events for plate tectonics

In an era where fears of rising sea level and loss of land are growing it is a great pleasure to announce (albeit several years late) the birth of two new islands. They emerged close to the axis of the Red Sea in Yemeni territory as new members of the volcanic Zubair Islands during episodic eruptions that began on 18 December 2011. First to form was dubbed Sholan (‘One who is Blessed’ in Arabic – a girl’s name), which ceased to be active a month later. Further submarine volcanism began on 28 September 2013, with another island, Jadid (‘New’ in Arabic – a boy’s name), breaking surface in October 2013. The double event has been described in great detail by geoscientists based at King Abdullah University of Science and Technology, Saudi Arabia (Xu, W. 2015. Birth of two volcanic islands in the southern Red Sea. Nature Communications, DOI: 10.1038/ncomms8104. After rapid growth during their initial eruptive phases both islands underwent significant marine erosion once quiescent, but seem set to remain as part of the Zubair archipelago.

'Before and after' images of the Zubair archipelago in the southern Red Sea. (Left from Bing maps, right (February 2014) from Google Earth)
‘Before and after’ images of the Zubair archipelago in the southern Red Sea. (Left from Bing maps, right (February 2014) from Google Earth)

Analysis of small earthquakes that happened during the islands’ growth together with Interferometric iradar surveys that showed coincident ground movements among the islands suggest that both eruptions took place along an active north-south fracture system, probably part of axial rifting system of the Red Sea. In more detail, magma seems to have moved upwards along N-S fissures similar to those that now show up as dykes cutting lavas on the older islands in the area. The local fracture patterns are oblique to the main Red Sea Rift that trends NNW-SSE, possibly as a result of non-linear stress trajectories in the Arabia-Africa rifting. In almost all respects the volcanism and mechanism of intrusion and effusion closely resemble that reported recently from a terrestrial setting in the nearby Afar Depression. The slow spreading Red Sea Rift rarely manifests itself by volcanism, so these events reveal a previous unsuspected zone of active melting in the mantle beneath the Zubair archipelago.

Stone tools go even further back

Shortly after it seemed that the maker of the earliest stone tools (2.6 Ma) may have been Australopithecus africanus, thanks to a novel means of analyzing what hominin hands may have been capable of, some actual tools have turned up from even earlier times (Harmand, S. and 20 others 2015. 3.3-million-year-old stone tools from Lomekwi 3, West Turkana, Kenya. Nature, v. 521, p. 310-315). Their age is comparable with that (3.4 Ma) of animal bones from Dikika, Ethiopia showing cut marks and signs of deliberate breaking, which had previously been controversial as they suggested that local Australopithecus afarensis of a similar age had made them. What the authors claim to be ‘a new beginning to the known archaeological record’ almost a million years earlier than the first appearance of Homo fossils in the Lake Turkana area seems to point in that direction. But A. afarensis has not been found in that area, although a hominin known as Kenyanthropus platyops with roughly the same age as the tools has.

Australopithecus afarensis reconstruction
Reconstruction of Australopithecus afarensis (Photo credit: Wikipedia)

Almost 150 fine-grained basaltic artefacts turned up at the Lomekwi site, which may have been where knappers habitually worked as many of them were fragments or debitage. The cores from which flakes had been struck are large, weighing on average 3.1 kg. It seems that the tool makers may have been forcefully pounding out edged tools for a variety of uses, unlike the single-use hammer stones used by chimpanzees today. Compared with the well known Oldowan tools, however, these are cruder and made by a different knapping technique that seems not to have focused on exploiting the conchoidal fracturing that produces the sharpest tools and is a feature of the later Oldowan tools.

English: Chopper: one of the earliest examples...
Oldowan ‘chopper’ from Melka Kunture, Ethiopia. (credit: Wikipedia)

Frederick Engels, whose 1876 essay The Part played by Labour in the Transition from Ape to Man was among the first works to take Darwin’s ideas on human origins forward, would have had a field day with the new evidence. For him the vital step was freeing of the hands by a habitual bipedal gait and their manipulation of objects – together with changes to the hands that would arise by such a habit. What the first tool maker looked like, doesn’t really matter: the potential that act conferred was paramount. Nevertheless, there is a big step between early hominins and humans, from relatively small brains to those of H. erectus that were on the way to modern human capacity. The Lomekwi tools and the improved Oldwan artefacts spanned 1.7 Ma at least before H. erectus revolutionised manufacture to produce the bi-facial Acheulian hand ‘axe’, and going beyond that took almost a million years of little change in both tools and anatomy until the emergence of archaic modern humans.

Note added 28 May 2015: Within a week palaeoanthropologists’ focus shifted to the Afar Depression in Ethiopia where a new species of hominin has emerged from Pliocene sediments dated to between 3.3 and 3.5 Ma (Haile-Selassie, Y et al. 2015. New species from Ethiopia expands Middle Pliocene hominin diversity. Nature, v. 521, p. 483-488. doi:1038/nature14448). Australopithecus deyiremeda is represented by fragments of two lower- and one upper jaw plus several other lower facial specimens. So the species is differentiated from other hominins by dentition alone, but that is unmistakably distinct from extensive data on Au. afarensis which lived within a few kilometres over the same period. Until the last 15 to 20 years it was thought that Au. afarensis was the sole hominin around in the Middle Pliocene of East and Central Africa, but now it seems there may have been as many as five, the three mentioned above, plus Au. bahrelghazali from Chad and an as yet undesignated fossilised foot from Afar. For possibly three closely related species to coexist in Afar is difficult to understand: possibly they occupied different niches in the local food web or employed different strategies (Spoor, F. 2015. The middle Pliocene gets crowded. Nature, v. 521, p. 432-433). Another question is: did they all make and use tools? For the Lomekwi tools K. platyops is a candidate, but for the cut marks on bones at Dikika in Afar there are at least two: Au. afarensis and Au. deyiremeda. So multiple tool makers living at the same time suggests some earlier originator of the ‘tradition’.

Note added 4 June 2015: Add southern Africa into the equation and there is yet more breaking news about coeval hominin diversity. US, Canadian, South African and French collaborators have finally started to resolve the achingly complex stratigraphy of the fossil-rich Sterkfontein cave deposits in South Africa by using a novel approach to estimating ages of materials’ last exposure to cosmic rays (Granger, D.E. et al. 2015. New Cosmogenic burial ages for Sterkfontein member 2 Australopithecus and Member 5 Oldowan. Nature, v. 522, p. 85-88). Specifically, they managed to date the tumbling into a deep sinkhole of a recently found, almost complete skeleton of an australopithecine. It still resembles no other some 70 years after a less complete specimen was found by Raymond Dart in the mid 1940s. It was first informally dubbed ‘Little Foot’ and then Au. prometheus and up to now has been regarded as an odd contemporary of 2.2 Ma old Au. africanus. The new dating gives an age of about 3.7 Ma: so at least 6 hominids occupied Africa in the Middle Pliocene. It is beginning to look like a previously unsuspected time of sudden diversification.

A certain shyness about research misconduct in the UK

Since Earth Pages was launched at the start of the 21st century there have been highly publicised cases of gross misconduct by researchers, including plagiarism, ‘massaging ‘data and even sabotaging the work of others, as well as lesser cases where publications were withdrawn or removed from journals. The most notorious have been from the USA, Japan, the Netherlands and a number of other advanced countries. But sharp practices in science are not well known in the UK; indeed I can’t recollect more than one case that reached the same degree of coverage as the most notorious instances. Yet, in 2009, Daniele Fanelli of the University of Edinbugh reported the results of her analysis of accessible information from the UK about this matter. She found that about 2% of British scientists, who had been interviewed or answered questionnaires, answered ‘Yes’ when asked if they ever fabricated or falsified research data, or if they altered or modified results to improve the outcome. Up to one third admitted other questionable practices or knew of them having been committed by colleagues. Fanelli doesn’t refer to more grievous matters such as sabotage or exploitation of students’ work.

The silence from British Universities on research misconduct has become such an embarrassment that it was a subject of an Editorial and a News In Focus Report in the 21 May issue of Nature . While there are guidelines that urge British universities to publish annual reports of their investigations into misconduct, for 2013-14 only 12 such reports have been published : of the 88 universities contacted by the informal UK Research Integrity Office, 30 institutions responded to UKRIO’s survey. These reports covered 21 investigations, mostly unspecified, with 5 cases of plagiarism, 2 of falsification, 2 concerning authorship, 1 of fabrication and 1 breach of confidentiality. Three were upheld and 3 are pending.

These figures speak loudly for themselves: misconduct by researchers (and academics in general) is something that the halls of British academe ‘dinnae care to speak aboot’. As the author of UKRIO’s survey observed, ‘It’s just not credible’, although many of the universities that she contacted claim that such reports were in progress. A likely story… We all know that the ‘filthy snout’ (Tom Wolfe The Bonfire of the Vanities) does ‘come popping to the surface’, but is buried in confidentiality by university Research Committees, leaving any victims dangling in a sorry psychological state and allowing journals’ peer review system to catch any perpetrators before they reach the press, which it is rarely able to do. It takes a case as severe as that of Andrew Wakefield’s fraudulent 1998 paper in the Lancet associating the MMR vaccine with autism to see justice done.

Snowball Earth events pinned down

The Period that lasted from 850 to 635 million years ago, the Cryogenian, takes its name from evidence for two and perhaps three episodes of glaciation at low latitudes. It has been suggested that, in some way, they were instrumental in the decisive stage of biological evolution from which metazoan eukaryotes emerged: the spectacular Ediacaran fossil assemblages follow on the heels of the last such event Although controversies about the reality of tropical latitudes experiencing ice caps have died away, there remains the issue of synchronicity of such frigid events on all continents, which is the central feature of so-called ‘Snowball Earth’ events. While each continent does reveal evidence for two low latitude glaciations – the Sturtian (~710 Ma) and the later Marinoan (~635 Ma) – in the form of diamictites (sediments probably dropped from floating ice and ice caps) it has proved difficult to date their start and duration. That is, the cold episodes may have been diachronous – similar conditions occurring at different localities at different times. Geochronology has, however, moved on since the early disputes over Snowball Earths and more reliable and precise dates for beginnings and ends are possible and have been achieved in several places (Rooney, A.D. et al. 2015. A Cryogenian chronology: Two long-lasting synchronous Neoproterozoic glaciations. Geology, v. 43, p. 459-462).

One computer simulation of conditions during a...
Computer simulation of conditions during a Snowball Earth period. (credit: Macmillan Publishers Ltd: Hyde et al., Nature 405:425-429, 2000)

Rooney and colleagues from Harvard and the University of Houston in the USA used rhenium-osmium radiometric dating in Canada, Zambia and Mongolia. The Re-Os method is especially useful for sulfide minerals as in the pyritic black shales that occur extensively in the Cryogenian, generally preceding and following the glacial diamictites and their distinctive carbonate caps. Combined with a few ages obtained by other workers using the Re-Os method and U-Pb dating of volcanic units that fortuitously occur immediately beneath or within diamictites, Rooney et al. establish coincident start and stop dates and thus durations of both the Sturtian and Marinoan glacial events: 717 to 660 Ma and 640 to 635 Ma respectively on all three continents. Their data is also said to refute the global extent and even the very existence of an earlier, Kaigas glacial event (~740 Ma) previous recorded from diamictites in Namibia, the Congo, Canada and central Asia. This assertion is based on the absence of diamictites with that age in the area that they studied in Canada and their own dating of a diamictite in Zambia, which is one that others assigned to the Kaigas event

The dating is convincing evidence for global glaciation on land and continental margins in the Cryogenian, as all the dates are from areas based on older continental crust. But the concept of Snowball Earth, in its extreme form, is that the oceans were ice-capped too as the name suggests, which remains to be convincingly demonstrated. That would only be achieved by suitably dated diamictites located on obducted oceanic crust in an ophiolite complex. Moreover, there are plenty more Cryogenian diamictites on other palaeo-continents and formed at different palaeolatitudes that remain to be dated (see here)

Earthquake hazard news

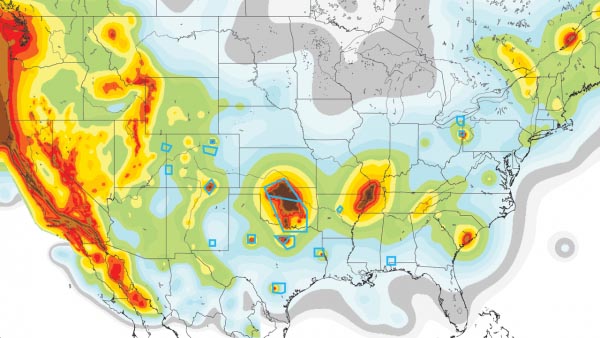
Assessments of seismic risk have relied until recently on records of destructive earthquakes going back centuries and their relationship to tectonic features, mainly active faults. They usually predict up to 50 years ahead. The US Geological Survey has now shifted focus to very recent records mainly of small to medium tremors, some of which have appeared in what are tectonically stable areas as well as the background seismicity in tectonically restless regions. This enables the short-term risk (around one year) to be examined. To the scientists’ surprise, the new modelling completely changes regional maps of seismic risk. The probabilities in the short-term of potentially dangerous ground movements in 17 oil- and gas-rich areas rival those in areas threatened by continual, tectonic jostling, such as California. The new ‘hot spots’ relate to industrial activity, primarily the disposal of wastewater from petroleum operations by pumping it into deep aquifers.

USGS map highlighting short-term earthquake risk zones. Blue boxes indicate areas with induced earthquakes (source: US Geological Survey)

Fluid injection increases hydrostatic pressure in aquifers and also in the spaces associated with once inactive fault and fracture systems. All parts of the crust are stressed to some extent but the presence of fluids and over-pressuring increases the tendency for rock failure. While anti-fracking campaigners have focussed partly on seismic risk – fracking has caused tremors around magnitudes 2 to 3 – the process is a rapid one-off injection involving small fluid volumes compared with petroleum waste-water disposal. All petroleum production carries water as well as oil and gas to wellheads. Coming from great depth it is formation water held in pores since sedimentary deposition, which is environmentally damaging because of its high content of dissolved salts and elevated temperature. Environmental protection demands that disposal must return it to depth.

The main worry is that waste water disposal might trigger movements with magnitudes up to 7.0: in 2011 a magnitude 5.6 earthquake hit a town in oil-producing Oklahoma and damaged many buildings. Currently, US building regulations rely on earthquake risk maps that consider a 50-year timescale, but they take little account of industrially induced seismicity. So the new data is likely to cause quite a stir. These are changing times, however, as the oil price fluctuates wildly. So production may well shift from field to field seeking sustainable rates of profit, and induced seismicity may well change as a result.

None of these areas are likely to experience the horrors of the 25 April 2015 magnitude 7.8 earthquake in Nepal. However, it also occurred in an area expected to be relatively stable compared with the rest of the Himalayan region. The only previous major tremor there was recorded in the 14th century. This supposedly ‘low-risk’ area overlies a zone in which small tremors or microearthquakes occur all the time. Such zones – and this one extends along much of the length of the Himalaya – seem to mark where fault depths are large enough for displacements to take place continually by plastic flow, thereby relieving stresses. Most of the large earthquakes have taken place south of the microseismic zone where the shallow parts of the Indian plate are brittle and have become locked. The recent event is raising concerns that it is a precursor of further large earthquakes in Nepal. Its capital Kathmandu is especially susceptible as it is partly founded on lake sediments that easily liquefy.

Note added: 13 May 2015. Nepal suffered another major shock (magnitude 7.3) on 12 May in the vicinity of Mount Everest. It too seems to have occurred in the zone of microearthquakes formerly thought to mark a zone where the crust fails continually bu plastic deformation thereby relieving stresses. Kathmandu was this time at the edge of the shake zone

Two large, reorganised landscapes

Where tectonic processes proceed quickly it is only to be expected that the land surface undergoes dramatic changes and that big features form. Exactly which processes lay behind very striking landforms may have been worked out long ago; or old ideas from the heyday of geomorphology have perhaps lingered longer than they should. Two tectonically active regions that have a long history of study are the Himalaya and Iceland: one a model of long-lived and rapid uplift driven by collisional tectonics; the other likewise, as a product of extension and rapid build-up of flood basalt flows. Major features of both have been shown to be not quite what they seem.
Substantial parts of the India-Asia collision zone contain broad patches of high, low-relief plateaus separated by deeply incised river gorges. In its eastern parts rise 3 of the largest rivers in SE Asia: the Yangtse; the Mekong and the Salween, which flow roughly parallel to the east and south-east for about 1000 km from their sources in the Tibetan Plateau. Their trajectories partly follow some enormous strike-slip fault that accommodated the relative motion of two continent-bearing plates over the last 50 million years. As well as the crustal thickening that attended the collision, vast amounts of uplifted material have been eroded from the three major gorges. Thickening and unloading have been the key to producing the largest tracts of high land on the planet. Yet between the gorges and their many tributaries in the eastern part of the collision zone are many tracts of high land with only moderate relief rather than sharp ridges. Because the Eurasian plate prior to India’s impact might reasonably be expected to have been only moderately high, if not low lying, and with a mature and muted landscape, a long-lived theory has been that these elevated plateaus are uplifted relics of this former landscape that were dissected by progressively deepening river incision. Much the same idea has been applied to similar mega features, and even coincident peaks in more completely eroded highlands.

Drainage basins of the Yangtse, Mekong and Salween rivers, with low-relief surfaces in buff and cream. Figure 1 in Yang et al. 2015 (credit: Nature)

In the India-Asian collision zone the supposedly ‘relic’ plateaus have been used to reconstruct the pre-collision land surface and the degree of bulging it has undergone since. However, the advent of accurate digital terrain elevation data has enabled the modelling of not only the large rivers but also of the tributary streams that make up major drainage. As well as the directional aspects of drainages their along-channel slopes can be analysed (Yong, R. et al. 2015. In situ low-relief landscape formation as a result of river network disruption. Nature, v. 520, p. 526-529). Rong Yang of the Swiss Federal Institute of Technology and colleagues from the same department and Ben-Gurion University of the Negev, Israel have been able to show that matters are far more complex than once believed. The tributary drainages of the Yangtse, Mekong and Salween gorges appear to have been repeatedly been disrupted by the complexities of deformation. One important factor has been drainage capture or piracy, in which drainages with greater energy erode towards the heads of their catchments until they intercept a major drainage in another sub-basin, thereby ‘stealing’ the energy of the water that it carries. The ‘pirate’ stream then erodes more powerfully in its lower reaches, whereas the basin burgled of much of its energy becomes more sluggishly evolving thereafter and increasingly left anomalous high in the regional terrain: it evolves to liken what previously it had been supposed to be – a relic of the pre-collision landscape.
Many of the rivers in Iceland occupy gorges that contain a succession of large waterfalls. Upstream of each is a wide rock terrace, and downstream the gorge is eroded into such a terrace. Much of Iceland is composed of lava flows piled one above another, as befits the only substantial land that straddles a constructive plate margin – the mid-Atlantic Ridge. Being famous also for its substantial ice caps that are relics of one far larger during the last glacial maximum, it has proved irresistible for geomorphologists to assign the gorge-fall-terrace repetition to gradual uplift due to isostatic rebound as the former ice cap melted and unloaded the underlying lithosphere. As relative sea-level fell each river gained more gravitational potential energy to cut back up its channel, which resulted in a succession of upstream migrating waterfalls and gorges below them. Individual lava flows, being highly resistant to abrasion cease to be affected once cut by a gorge; hence the terraces. But it is now possible to establish the date when each terrace first became exposed to cosmic-ray bombardment, using the amount of cosmogenic 3He that has accumulated in the basalts that form the terrace surfaces (Baynes, E.R. et al. 2015. Erosion during extreme flood events dominates Holocene canyon evolution in northeast Iceland. Proceedings of the National Academy of Science, doi:10.1073/pnas.1415443112).

Valley of Jökulsá á Fjöllum past Dettifoss, Jö...
Gorge incised in basalt flows, Jökulsárgljúfur National Park, Iceland (credit: Wikipedia)

The British-German team from the University of Edinburgh and Deutsches GeoForschungsZentrum, Potsdam worked on terraces of the Jökulsárgljúfur canyon, discovering that three terraces formed abruptly in the Holocene, at 9, 5 and 2 ka ago, with no evidence for any gradual erosion by abrasion. Each terrace was cut suddenly, probably aided by the highly jointed nature of the overlying lava flow that would encourage toppling of blocks given sufficient energy. The team suggests that each represents not stages in uplift, but individual megafloods, perhaps caused by catastrophic glacial melting during subglacial eruptions or failures of dams formed by moraines or ice lobes.

What followed the Giant Impact (read Lord Mayor’s Show)?

The dominance of the Lunar Highlands by feldspar-rich anorthosites, which form when feldspars that crystallise from magmas float because of their lower density, gave rise to the idea that the Moon initially formed as a totally molten mass. That this probably resulted because the early Earth collided with a Mars-sized protoplanet stems from the almost identical chemical composition of the lunar and terrestrial mantles, as worked out from the composition of younger basalts derived from both, together with the vast energy needed to support a large molten planetary body condensing from a plasma cloud orbiting the Earth. Such a giant impact is also implicated in the final stages of core formation within the Earth.

Artist's depiction of the giant impact that is...
Artist’s depiction (after William K. Hartmann) of the giant impact that is hypothesized to have formed the Moon. (credit: Wikipedia)

A core formed from molten iron alloyed with nickel would have acted as a chemical attractor for all other elements that have an affinity for metallic iron: the siderophile elements, such as gold and platinum. Yet the chemistry of post-moon formation basaltic melts derived from the Earth’s mantle contain considerably more of these elements than expected, a feature that has led geochemists to wonder whether a large proportion of the mantle arrived – or was accreted – after the giant impact.

A tool that has proved useful in geochemistry on the scale of entire planets – well, just the Earth and Moon so far – is measuring the isotopic composition of tungsten, a lithophile metal that has great affinity for silicates. One isotope is 182W that forms when a radioactive isotope of hafnium (182Hf) decays. The proportion of 182W relative to other tungsten isotopes has been shown to be about the same in Lunar Highland anorthosites as it is in the Earth’s mantle. This feature is believed to reflect Moon formation and its solidification after the parent 182Hf had all decayed away: the decay has a half-life of about 9 Ma and after 60 Ma since the formation of the Solar System (and a nearby supernova that both triggered it and flung unstable isotopes such as 182Hf into what became the Solar nebula) vanishingly small amounts would remain.

Oddly, two papers on tungsten and Earth-Moon evolution, having much the same aims, using similar, newly refined methods and with similar results appeared in the same recent issue of Nature (Touboul, M. et al. 2015. Tungsten isotopic evidence for disproportional late accretion to the Earth and Moon. Nature, v. 520, p. 530-533. Kruijer, T.S. et al. 2015. Lunar tungsten isotopic evidence for the late veneer. Nature, v. 520, p. 534-537). The two of them present analyses of glasses produced by large impacts into the lunar surface and probably the mantle, which flung them all over the place, maintaining the commonality of the ventures that might be explained by there being a limited number of suitable Apollo samples. Both report an excess of 182W in the lunar materials: indeed, almost the same excess given the methodological precisions. And, both conclude that Moon and Earth were identical just after formation, with a disproportional degree of later accretion of Solar nebula material to the Earth and Moon.

So, there we have it: it does look as if Earth continued to grow after it was whacked, and there is confirmation. Both papers conclude, perhaps predictably, that the early Solar System was a violent place about which there is much yet to be learned…

St Paul and the meteorite?

Dateline: Chelyabinsk, Russia 09.20 15 February 2013. As in many parts of Russia drivers in this Oblast in the Urals Economic District use an in-car camera during rush hour, hopefully to have proof of innocence in the event of a traffic accident. On this day, such cameras recorded a massive fireball streaking low across a clear, frosty sky. Some people on foot were temporarily blinded by its light, about 4 times that sunlight, and others were thrown off their feet by a large shock wave. Travelling at about 20 km s-1 the fireball exploded, the blast shattering windows where people were gazing at the remarkable sight, about 1500 needing medical treatment. This event is the first in modern times to record the atmospheric entry of a superbolide and air blast, probably similar to what happened in the deserted area of Tunguska in Siberia on 30 June 1908.

Meteor trail and fireball seen over industrial estate in Chelyabinsk, Russia (credit: Russia Today)

Cut to the Levant in the 1st century of the Common Era: on the road to Damascus a Jewish fundamentalist with Roman citizenship, sworn to destroy the early Christian movement, is on a mission to arrest Christians and take them in chains to Jerusalem. Saul witnesses a great light in the sky and a deafening sound that he believes is the voice of Jesus, saying ‘Saul, Saul, why persecutest thou me?’(Acts 9:4). He is flung off his feet, struck blind and convinced of the error of his calling. Three days later, in Damascus ‘…there fell from his eyes as it had been scales: and he received sight forthwith, and arose, and was baptized’ (Acts 9:18), taking the name Paul.

The conversion of Saul by Michaelangelo

William Hartmann of the Planetary Science Institute at the University of Arizona, among the first planetary scientists to propose the giant impact origin for the Moon (see next item) and in his case to visualise it in a famous painting, has drawn a somewhat obvious hypothesis linking the two events (Hartmann, W.K. 2015. Chelyabinsk, Zond IV, and a possible first-century fireball of historical importance. Meteoritics and Planetary Science, v. 50, p. 368-381: doi: 10.1111/maps.12428). These days such a scary observation is easily rationalised as a natural phenomenon, but in earlier times Hartmann believes such a shock would have convinced witness of the almighty power of the supernatural ‘in terms of current cultural conceptions’. He suggests that Saul of Tarsus may, at the time, have been struggling with his conscience about his attacks on his countrymen: hence his conversion. The phrase ‘ scales fell from his eyes’ has entered common parlance for sudden changes in mental state and attitude: in fact it matches an outcome of severe photokeratitis of the eye’s epithelial coating, the dead tissue eventually becoming detached, when clear sight is restored to some sufferers.
While claiming to have no intention of undermining anyone’s spiritual beliefs, Hartmann suggests that such rare and spectacular events are capable of having emotionally changed influential figures of the past and thereby re-routing the course of history. Hartmann cites modern cases of lesser bolide-entry phenomena, such as destruction of satellites over the US and Russia, which some witnesses misreported as rockets with lighted windows; i.e. UFOs. There are plenty of medieval cases where spiritual connotations were widely attached to strange natural phenomena. I have heard accounts from people living in Asmara, capital of Eritrea, who ascribed saintly intervention to a full solar halo with sun dogs connected by cruciform arcs on a misty morning in 1991. This occurred a few days before the occupying Ethiopian forces surrendered to Eritrean nationalist forces whose struggle for self determination had lasted for the previous three decades.

The dinosaur they could not kill: Brontosaurus is back

It would be pretty safe to say that everyone has heard of Brontosaurus, but in the 1970s the genus vanished from the palaeobiology lexicon. The ‘Bone Wars’ of post-Civil War US palaeontology stemmed from the astonishing prices that dinosaur skeletons fetched. The frenzy of competition to fill museums unearthed hundreds of specimens, but the financial enthusiasm did not extend to painstaking anatomy. Finding a new genus meant further profit so a slapdash approach to taxonomy might pay well. So it did with the dinosaur family Diplodocidae for Othniel Marsh, one of the fossil marauders. He along with his main competitor, Edward Cope, was a wizard fossicker, but lacked incentive to properly describe what he unearthed. In 1877 Marsh published a brief note about a new genus that he called Apatosaurus, then hurried off to for more booty. Two years later he returned from the field with another monster reptile, and casually made a brief case for the ‘Thunder Lizard’, Brontosaurus. Unlike his usage of ‘Deceptive Lizard’ for Apatosaurus, the English translation of Brontosaurus caught the public imagination and lingers to this day as the archetype for a mighty yet gentle, extinct beast. Yet, professional palaeontologists were soon onto the lax ways of Marsh and Cope, and by 1903 deemed Brontosaurus to be taxonomically indistinguishable from Apatosaurus, and as far as science was concerned the ‘Thunder Lizard’ was no more.

Illustration of a Brontosaurus (nowadays calle...
Artist’s impression of a Brontosaurus . The idea that it was wholly or mostly aquatic is now considered outdated. (credit: Wikipedia)

But, the legacy of frenzied fossil collecting of a century or more ago is huge collections that never made it to display, which form rich pickings for latter-day palaeontologists with all kinds of anatomical tools now at their disposal: the stuff of almost endless graduate studies. Emanuel Tschopp of the New University of Lisbon with colleagues took up the challenge of the Diplodocidae by examining 49 named specimens and 32 from closely related specimens as controls, measuring up to 477 skeletal features (Tschopp, E. et al. 2015. A specimen-level phylogenetic analysis and taxonomic revision of Diplodocidae (Dinosauria, Sauropoda). PeerJ, v. 3, doi10.771/peerj.857). An unintended consequence was their discovery that 6 specimens of what had become Apatosaurus excelsus (formerly Marsh’s Brontosaurus) differed from all other members of its genus in 12 or more key characteristics. It seems to taxonomists a little unfair that Brontosaurus should not be resurrected, and that looks likely.

Had this been about almost any other group of fossils, with the exception perhaps of the ever-popular tyrannosaurs, the lengthy paper would have passed unnoticed except by specialist palaeontologists. In a little over a week the open-access publication had more than 17 thousand views and 3300 copies were downloaded.

See also: Balter, M. 2015. Bully for Brontosaurus. Science, v. 348, p. 168

Magma rushed into largest layered intrusion

Chances are that the platinum in the catalytic converter that helps prevent your car emitting toxic gases in its exhaust fumes came from a vast igneous intrusion in South Africa known as the Bushveldt complex. The world’s most important source of noble metals formed by repeated differentiation of huge volumes of mafic magma to form thin, dense layers rich in sulfides, platinum group metals and chromium ore set in very thick layers of barren gabbro and other mafic to ultramafic rock. The intrusion is exposed over an area the size of Ireland and formed about 2 billion years ago. Its 370 000 to 600 000 km3 volume suggests that it was the magma chamber that fed flood basalts that erosion has since eroded away. Successive pulses of basaltic magma built up a total thickness of about 8 kilometres of layered rock.

English: black Chromitite and grey anorthosite...
Layered igneous rocks in the Bushveld Complex (credit: Wikipedia)

The final product of the Bushveldt differentiation process was minute pockets of material of more felsic composition trapped within overwhelmingly larger amounts of gabbro. One of the elements that ended up in these roughly granitic inclusions was zirconium that mafic minerals are unable to accommodate while basaltic magma is crystallising. That formed minute crystals of the mineral zircon (ZrSiO4) in the residual pockets, which in turn locked up a variety of other elements, including uranium. Zircon can be dated using uranium’s radioactive decay to form lead isotopes, its refusal to enter chemical reactions after its crystallisation makes U/Pb dates of zircon among the most reliable available for geochronology and the precision of such dates has become increasingly exquisite as mass spectrometry has improved. So, the Bushveldt complex now has among the best records of magma chamber evolution (Zeh, A. et al. 2015. The Bushveld Complex was emplaced and cooled in less than one million years – results of zirconology, and geotectonic implications. Earth and Planetary Science Letters, v. 418, p. 103-114).

Like a number of younger large igneous provinces, the Bushveldt complex took a very short time to form, about 950 thousand years at 2055 Ma ago. That is from magma emplacement to final crystallization when the zircon ages were set, so the accumulation of magma probably took only 100 thousand years. This suggests that magma blurted into the lower crust at an average rate of around 5 cubic kilometers per year, and quite probably even faster if the magmatism was episodic. It requires a major stretch of the imagination to suggest that this could have occurred by some passive process. Instead, the authors have suggested that while a plume of mantle material rose from well below the lithosphere a large slab of lower lithosphere, formed from dense eclogite, broke off and literally fell into the deeper mantle. The resulting changes in stress in the lower lithosphere would have acted as a pump to drive the plume upwards, causing it to melt as pressure dropped, and to squirt magma into the overlying continental crust. Although the authors do not mention it, this is reminiscent of the idea of large igneous provinces having sufficient power to eject large masses from the Earth’s surface: the Verneshot theory, recently exhumed in late 2014. The main difference is that the originators of the Verneshot theory appealed to explosive gas release.

A new explanation for banded iron formations (BIFs)

The main source for iron and steel has for more than half a century been Precambrian rock characterised by intricate interlayering of silica- and iron oxide-rich sediments known as banded iron formations or BIFs. They always appear in what were shallow-water parts of Precambrian sedimentary basins. Although much the same kind of material turns up in sequences from 3.8 to 0.6 Ga, by far the largest accumulations date from 2.6 to 1.8 Ga, epitomised by the vast BIFs of the Palaeoproterozoic Hamersley Basin in Western Australia. This peak of iron-ore deposition brackets the time (~2.4 Ga) when world-wide evidence suggests that the Earth’s atmosphere first acquired tangible amounts of free oxygen: the so-called ‘Great Oxidation Event’. Yet the preservation of such enormous amounts of oxidised iron compounds in BIFs is paradoxical for two reasons: the amount of freely available atmospheric oxygen at their acme was far lower than today; had the oceans contained much oxygen, dissolved ions of reduced Fe-2 would not have been able to pervade seawater as they had to for BIFs to have accumulated in shallow water. Iron-rich ocean water demands that its chemical state was highly reducing.

Oblique view of an open pit mine in banded iron formation at Mount Tom Price, Hamersley region Western Australia (Credit Google earth)

The paradox of highly oxidised sediments being deposited when oceans were highly reduced was resolved, or seemed to have been, in the late 20th century. It involved a hypothesis that reduced, Fe-rich water entered shallow, restricted basins where photosynthetic organisms – probably cyanobacteria – produced localised enrichments in dissolved oxygen so that the iron precipitated to form BIFs. Later work revealed oddities that seemed to suggest some direct role for the organisms themselves, a contradictory role for the co-dominant silica-rich cherty layers and even that another kind of bacteria that does not produce oxygen directly may have deposited oxidised iron minerals. Much of the research focussed on the Hamersley BIF deposits, and it comes as no surprise that another twist in the BIF saga has recently emerged from the same, enormous repository of evidence (Rasmussen, B. et al. 2015. Precipitation of iron silicate nanoparticles in early Precambrian oceans marks Earth’s first iron age. Geology, v. 43, p. 303-306).

The cherty laminations have received a great deal less attention than the iron oxides. It turns out that they are heaving with minute particles of iron silicate. These are mainly the minerals stilpnomelane [K(Fe,Mg)8(Si, Al)12(O, OH)27] and greenalite [(Fe)2–3Si2O5(OH)4] that account for up to 10% of the chert. They suggest that ferruginous, silica-enriched seawater continually precipitated a mixture of iron silicate and silica, with cyclical increases in the amount of iron-silicate. Being such a tiny size the nanoparticles would have had a very high surface area relative to their mass and would therefore have been highly reactive. The authors suggest that the present mineralogy of BIFs, which includes iron carbonates and, in some cases, sulfides as well as oxides may have resulted from post-depositional mineral reactions. Much the same features occur in 3.46 Ga Archaean BIFs at Marble Bar in Western Australia that are almost a billion years older that the Hamersley deposits, suggesting that a direct biological role in BIF formation may not have been necessary.

More on BIFs and the Great Oxidation Event

Anthropocene: what (or who) is it for?

The made-up word chrononymy could be applied to the study of the names of geological divisions and their places on the International Stratigraphic Chart. Until 2008 that was something of a slow-burner, as careers go. It all began with Giovanni Arduino and Johann Gotlob Lehman in the mid- to late 18th century, during the informal historic episode known as the Enlightenment. To them we owe the first statements of stratigraphic principles and the beginning of stratigraphic divisions: rocks divided into the major segments of Primitive, Secondary, Tertiary and Quaternary (Arduino). Thus stratigraphy seeks to set up a fundamental scale or chart for expressing Earth’s history as revealed by rocks. The first two divisions bit the dust long ago; Tertiary is now an informal synonym for the Cenozoic Era; only Quaternary clings on as the embattled Period at the end of the Cenozoic.  All 11 Systems/Periods of the Phanerozoic, their 37 Series/Epochs and 85 Stages/Ages in the latest version of the International Stratigraphic Chart have been thrashed out since then, much being accomplished in the late 19th and early 20th centuries. Curiously, the world body responsible for sharpening up the definition of this system of ‘chrononymy’, the International Commission on Stratigraphy (ICS), seems not to have seen fit to record the history of stratigraphy: a great mystery. Without it geologists would be unable to converse with one another and the world at large.

Yet now an increasing number of scientists are seriously proposing a new entry at the 4th level of division after Eon, Era and Period: a new Epoch that acknowledges the huge global impact of human activity on atmosphere, hydrosphere, biosphere and even lithosphere. They want it to be called the Anthropocene, and for some its eventual acceptance ought to relegate the current Holocene Epoch, in which humans invented agriculture, a form of economic intercourse and exchange known as capital and all the trappings of modern industry, to the 5th division or Stage. Earth-pages has been muttering about the Anthropocene for the past decade, as charted in a number of the links above, so if you want to know which way its author is leaning and how he came to find the proposal an unnecessary irritation, have a look at them. Last week things became sufficiently serious for another comment. Simon Lewis and Mark Maslin of the Department of Geography at University College London have summarised the scientific grounds alleged to justify an Anthropocene Epoch and its strict definition in a Nature Perspective (Lewis, S.J. & Maslin, M.A. 2015. Defining the Anthropocene. Nature, v. 519, p. 171-180).-=, which is interestingly discussed in the same Issue by Richard Monastersky.

Lewis and Maslin present two dates that their arguments and accepted stratigraphic protocols suggest as candidates for the start of the Anthropocene: 1610 and 1964 CE, both of which relate to features that are expressed by geological records that should last indefinitely. The first is a decline and eventual recovery in the atmospheric CO2 level recorded in high-resolution Antarctic ice core records between 1570 and 1620 CE that can be ascribed to the decline in the population of the Americas’ native peoples from an estimated 60 to 6 million. This result of the impact of European first colonisation – disease, slaughter, enslavement and famine – reduced agriculture and fire use and saw the regeneration of 5 x 10⁷ hectares of forest, which drew down CO2 globally. It also coincides with the coolest part of the Little Ice Age from 1594-1677 CE. They caution against the start of the Industrial Revolution as an alternative for a ‘Golden Spike’ since it was a diachronous event, beginning in Europe. Instead, they show that the second proposal for a start in 1964 has a good basis in the record of global anthropogenic effects on the Earth marked by the peak fallout of radioactive isotopes generated by atomic weapons tests during the Cold War, principally 14C with a 5730 year half life, together with others more long-lived. The year 1964 is also roughly when growth in all aspects of human activity really took off, which some dub in a slightly Tolkienesque manner the ‘Great Acceleration’. [There is a growing taste for this kind of hyperbole, e.g. the ‘Great Oxygenation Event’ around 2.4 Ga and the ‘Great Dying’ for the end-Permian mass extinction]. Yet they neglect to note that the geochronological origin point for times past has been defined as 1950 CE when nucleogenic 14C contaminated later materials as regards radiocarbon dating, which had just become feasible.   Lewis and Maslin conclude their Perspective as follows:

To a large extent the future of the only place where life is known to exist is being determined by the actions of humans. Yet, the power that humans wield is unlike any other force of nature, because it is reflexive and therefore can be used, withdrawn or modified. More widespread recognition that human actions are driving far-reaching changes to the life-supporting infrastructure of Earth may well have increasing philosophical, social, economic and political implications over the coming decades.

So the Anthropocene adds the future to the stratigraphic column, which seems more than slightly odd. As Richard Monastersky notes, it is in fact a political entity: part of some kind of agenda or manifesto; a sort of environmental agitprop from the ‘geos’. As if there were not dozens of rational reasons to change human impacts to haul society back from catastrophe, which many people outside the scientific community have good reason to see as  hot air on which there is never any concrete action by ‘the great and the good’. Monastersky also notes that the present Anthropocene record in naturally deposited geological materials accounts for less than a millimetre at the top of ocean-floor sediments. How long might the proposed Epoch last? If action to halt anthropogenic environmental change does eventually work, the Anthropocene will be  very short in historic terms let alone those which form the currency of geology. If it doesn’t, there will be nobody around able to document, let alone understand, the epochal events recorded in rocks. At its worst, for some alien, visiting planetary scientists, far in the future, an Anthropocene Epoch will almost certainly be far shorter than the 104 to 105 years represented by the hugely more important Palaeozoic-Mesozoic and Mesozoic-Cenozoic boundary sequences; but with no Wikipedia entry.

Not everybody gets a vote on these kinds of thing, such is the way that science is administered, but all is not lost. The final arbiter is the Executive Committee of the International Union of Geological Sciences (IUGS), but first the Anthropocene’s status as a new Epoch has to be approved by 60% of the ICS Subcommission on Quaternary Stratigraphy, if put to a vote. Then such a ‘supermajority’ would be needed from the chairs of all 16 of the ICS subcommissions that study Earth’s major time divisions. But first, the 37 members of the Subcommission on Quaternary Stratigraphy’s ‘Anthropocene’ working group have to decide whether or not to submit a proposal: things may drag on at an appropriately stratigraphic pace. Yet the real point is that the effect of human activity on Earth-system processes has been documented and discussed at length. I’ll give Marx the last word in this ‘The philosophers have only interpreted the world, in various ways. The point, however, is to change it’. A new stratigraphic Epoch doesn’t really seem to measure up to that…

Genus Homo pushed back nearly half a million years

Bill Deller, a friend whose Sunday is partly spent reading the Observer and Sunday Times from cover to cover, alerted me to a lengthy article by Britain’s doyen of paleoanthropologists Chris Stringer of the Natural History Museum. (Stringer, C. 2015. First human? The jawbone that makes us question where we’re from. Observer, 8 March 2015, p. 36). His piece sprang from two Reports published online in Science that describe about 1/3 of a hominin lower jaw unearthed – where else? – in the Afar Depression of Ethiopia. The discovery site of Ledi-Geraru is a mere 30 km from the most hominin-productive ground in Africa: Hadar and Dikika for Australopithecus afarensis (‘Lucy’ at 3.2 Ma and ‘Selam’ at 3.3 Ma, respectively); Gona for the earliest-known stone tools (2.6 Ma); and the previously earliest member of the genus Homo, also close to Hadar.

On some small objects mighty tales are hung, and the Ledi-Geraru jawbone and 6 teeth is one of them. It has features intermediate between Australopithecus and Homo, but more important is its age: Pliocene, around 2.8 to 2.75 Ma (Villmoare, B. And 8 others. Early Homo at 2.8 Ma from Ledi Geraru, Afar, Ethiopia. Science Express doi: 10.1126/science.aaa1343). The sediments from which Ethiopian geologist Chalachew Seyoum, studying at Arizona State University, extracted the jawbone formed in a river floodplain. Other fossils suggest open grassland rich with game, similar to that of the Serengeti in Tanzania, with tree-lined river courses. These were laid down at a time of climatic transition from humid to more arid conditions, that several authors have suggested to have provided the environmental stresses that drove evolutionary change, including that of hominins (DiMaggio, E.N. and 10 others 2015. Late Pliocene fossiliferous sedimentary record and the environmental context of early Homo from Afar, Ethiopia. Science Express doi: 10.1126/science.aaa1415).

Designating the jawbone as evidence for the earliest known member of our genus rests almost entirely on the teeth, and so is at best tentative awaiting further fossil material. The greatest complicating factor is that the earliest supposed fossils of Homo (i.e. H. habilis, H rudolfensis and others yet to be assigned a species identity) are a morphologically more mixed bunch than those younger than 2 Ma, such as H. ergaster and H. erectus. Indeed, every one of them has some significant peculiarity. That diversity even extends to the earliest humans to have left Africa, found in 1.8 Ma old sediments at Dmanisi in Georgia (Homo georgicus), where each of the 5 well-preserved skulls is unique.  The Dmanisi hominins have been likened to the type specimen of H. habilis, but such is the diversity of both that is probably a shot in the dark.

English: Cast replica of OH 7, the type specim...
Replica of OH 7, the deformed type specimen of Homo habilis. (credit: Wikipedia)

Coinciding with the new Ethiopian hominin papers a study was published in Nature the same week that describes how the type specimen of H. habilis (found, in close association with crude stone tools and cut bones, by Mary and Lewis Leakey at Olduvai Gorge, Tanzania in 1960) has been digitally restored from its somewhat deformed state when found (Spoor, F. et al. 2015. Reconstructed Homo habilis type OH 7 suggests deep-rooted species diversity in early Homo. Nature, v. 519, p. 83-86, doi:10.1038/nature14224). The restored lower jaw and teeth, and part of its cranium, deepened the mysterious diversity of the group of fossils for which it is the type specimen, but boosts its standing as regards probable brain size from one within the range of australopithecines to significantly larger –~750 ml compared with <600 ml – about half that of modern humans. The habilis diversity is largely to do with jaws and teeth: it is the estimated brain size as well as the type specimen’s association with tools and their use that elevates them all to human status. Yet, the reconstruction is said by some to raise the issue of a mosaic of early human species. The alternative is an unusual degree of shape diversity (polymorphism) among a single emerging species, which is not much favoured these days. An issue to consider is: what constitutes a species? For living organisms morphological similarity has to be set against the ability for fertile interbreeding. Small, geographically isolated populations of a single species often diverge markedly in terms of what they look like yet continue to be interfertile, the opposite being convergence in form by organisms that are completely unrelated.

Palaeontologists tend to go largely with division on grounds of form, so that when a specimen falls outside some agreed morphological statistics, it crosses a species boundary. Set against that the incontrovertible evidence that at least 3 recent human species interbred successfully to leave the mark in all non-African living humans. What if the first humans emerging from, probably, a well-defined population of australopithecines continued to interbreed with them, right up to the point when they became extinct about 2 Ma ago?

On a more concrete note, the Ledi Geraru hominin is a good candidate for the maker of the first stone tools found ‘just down the road’ at Gona!

Wet spells in Arabia and human migration

In September 2014, Earth Pages  reported how remote sensing had revealed clear signs of extensive fossil drainage systems and lakes at the heart of the Arabian Peninsula, now the hyper-arid Empty Quarter (Rub al Khali). Their association with human stone artifacts dated as far back as 211 ka, those with affinities to collections from East Africa clustering between 74-90 ka, supported the sub-continent possibly having been an early staging post for fully modern human migrants from Africa. Member of the same archaeological team based at Oxford University have now published late Pleistocene palaeoclimatic records from alluvial-fan sediments in the eastern United Arab Emirates that add detail to this hypothesis (Parton, A. ­et al. 2015. Alluvial fan records from southeast Arabia reveal multiple windows for human dispersal. Geology, advance online publication doi:10.1130/G36401.1).

The eastern part of the Empty Quarter is a vast bajada formed from coalesced alluvial fans deposited by floods rising in the Oman Mountains and flowing westwards to disappear in the great sand sea of dunes. Nowadays floods during the Arabian Sea monsoons are few and far between, and restricted to the west-facing mountain front. Yet, older alluvial fans extend far out into the Empty Quarter, some being worked for aggregate used in the frantic building boom in the UAE. In one of the quarries, about 100 km south of the Jebel Faya Upper Palaeolithic tool site , the alluvial deposit contains clear signs of cyclical deposition in the form of 13 repeated gradations from coarse to fine waterlain sediment, each capped by fossil soils and dune sands. The soils contain plant remains that suggest they formed when the area was colonized by extensive grasslands formed under humid conditions.

Dating the sequence reveals that 6 of the cycles formed over a 10 thousand-year period between 158 to 147 ka, which coincides with a peak in monsoon intensity roughly between 160 and 150 ka during the glacial period that preceded the last one. Three later cycles formed at times of monsoon maxima during the last interglacial and in the climatic decline leading to the last glacial maximum, at ~128 to 115 ka, 105 to 95 ka, 85 to 74 ka. So, contrary to the long-held notion that the Arabian Peninsula formed a hostile barrier to migration, from time to time it was a well watered area that probably had abundant game. Between times, though, it was a vast, inhospitably dry place.

English: SeaWiFS collected this view of the Ar...
Satellite view of the Arabian Peninsula. The Oman mountains sweep in a dark arc south eastwards from the Staits of Hormuz at the mouth of the Persian Gulf. The brownish grey area to the south of the arc is the bajada that borders the bright orange Empty Quarter (credit: NOAA)

The authors suggest that the climatic cyclicity was dominated by a 23 ka period. As regards the southern potential migration route out of Africa, via the Straits of Bab el Mandab, which has been highly favoured by palaeoanthropologists lately, opportunities for migration in the absence of boats would have depended on sea-level lows. They do not necessarily coincide with wet windows of opportunity for crossing the cyclically arid Arabian peninsula that would allow both survival and proceeding onwards to south and east Asia. So far as I can judge, the newly published work seems to favour a northward then eastward means of migration, independent of fluctuations in land-ice volume and sea level, whenever the driest areas received sufficient water to support vegetation and game. In fact most of NE Africa is subject to the Arabian Sea monsoons, and when they were at their least productive crossing much of Ethiopia’s Afar depression and the coastal areas of Eritrea, Sudan and Egypt would have been almost as difficult as the challenge of the Empty Quarter.

A tsunami and NW European Mesolithic settlements

About 8.2 ka ago sediments on the steep continental edge of the North and Norwegian Seas slid onto the abyssal plain of the North Atlantic. This huge mass displacement triggered a tsunami whose effects manifest themselves in sand inundations at the heads of inlets and fjords along the Norwegian and eastern Scottish coasts that reach up to 10 m above current sea level. At that time actual sea level was probably 10 m lower than at present as active melting of the last glacial ice sheets was still underway: the waves may have reached 20-30 m above the 8.2 ka sea level. So powerful were the tsunami waves in the constricted North Sea that they may have separated the British Isles from the European mainland by inundating Doggerland, the low-lying riverine plain that joined them before global sea level rose above their elevation at around the same time. Fishing vessels plying the sandbanks of the southern North Sea often trawl-up well preserved remains of land mammals and even human tools: almost certainly Doggerland was prime hunting territory during the Mesolithic, as well as an easily traversed link to the then British Peninsula. Mesolithic settlements close by tsunami deposits are known from Inverness in Scotland and Dysvikja north of Bergen in Norway and individual Mesolithic dwellings occur on the Northumberland coast. The tsunami must have had some effect on Mesolithic hunter gatherers who had migrated into a game-rich habitat. The question is: How devastating was it.

English: Maelmin - reconstruction of Mesolithi...
Reconstruction of Mesolithic hut based on evidence from two archaeological sites in Northumberland, UK. (credit: Lisa Jarvis; see http://www.maelmin.org.uk/index.html )

Hunter gatherers move seasonally with favoured game species, often returning to semi-permanent settlements for the least fruitful late-autumn to early spring season. The dominant prey animals, red deer and reindeer also tend to migrate to the hills in summer, partly to escape blood-feeding insects, returning to warmer, lower elevations for the winter. If that movement pattern dominated Mesolithic populations then the effects of the tsunami would have been most destructive in late-autumn to early spring. During warmer seasons, people may not even have noticed its effects although coastal habitations and boats may have been destroyed.

Splendid Feather Moss, Step Moss, Stair Step Moss
Stair-step moss (credit: Wikipedia)

Norwegian scientists Knut Rydgren and Stein Bondevik from Sogn og Fjordane University College, Sognda devised a clever means of working out the tsunami’s timing from mosses preserved in the sand inundations that added to near-shore marine sediments. (Rydgren, K. & Bondevik, S. 2015. Most growth patterns and timing of human exposure to a Mesolithic tsunami in the North Atlantic. Geology, v. 43, p. 111-114). Well-preserved stems of stair-step moss Hylocomium splendens still containing green chlorophyll occur, along with ripped up fragments of peat and soil, near the top of the tsunami deposit which has been uplifted by post-glacial isostatic uplift to form a bog. This moss grows shoots annually, the main growth spurt being at the end of the summer-early autumn growing season. Nineteen preserved samples preserved such new shoots that were as long as or longer than the preceding year’s shoots. This suggests that they were torn up by the tsunami while still alive towards the end of the growing season, around late-October. All around the North Sea Mesolithic people could have been returning from warm season hunting trips to sea-shore winter camps, only to have their dwellings, boats and food stores devastated, if indeed they survived such a terrifying event.

Glacial cycles and sea-floor spreading

The London Review of Books recently published a lengthy review (Godfrey-Smith, P. 2015. The Ant and the Steam Engine. London Review of Books, v. 37, 19 February 2015 issue, p. 18-20) of the latest contribution to Earth System Science by James Lovelock, the man who almost singlehandedly created that popular paradigm through his Gaia concept of a self-regulating Earth (Lovelock, J. A Rough Ride to the Future. Allen Lane: London; ISBN 978 0 241 00476 0). Coincidentally, on 5 February 2015 Science published online a startling account of the inner-outer-inner synergism of Earth processes and climate (Crowley, J.W. et al. 2015. Glacial cycles drive variations in the production of oceanic crust. Science doi:10.1126/science.1261508). In fact serendipity struck twice: the following day a similar online article appeared in a leading geophysics journal (Tolstoy, M. 2015. Mid-ocean ridge eruptions as a climate valve. Geophysical Research Letters, doi:10.1002/2014GL063015)

Both articles centred on the most common topographic features on the ocean floor, abyssal hills. These linear features trend parallel to seafloor spreading centres and the magnetic stripes, which chart the progressive additions to oceanic lithosphere at constructive margins. Abyssal hills are most common around intermediate- and fast-spreading ridges and have been widely regarded as fault-tilt blocks resulting from extensional forces where cooling of the lithosphere causes it to sag towards the abyssal plains. However, some have suggested a possible link with variations in magma production beneath ridge axes as pressure due to seawater depth varied with rising and falling sea level through repeated glacial cycles. Mantle melting beneath ridges results from depressurization of rising asthenosphere: so-called ‘adiabatic’ melting. Pressure changes equivalent to sea-level fluctuations of around 100-130 m should theoretically have an effect on magma productivity, falls resulting in additional volumes of lava erupted on the ocean floor and thus bathymetric highs.

English: A close-up showing mid-ocean ridge to...
Formation of mid-ocean ridge topography, including abyssal hills that parallel the ridge axis. (credit: Wikipedia)

A test of this hypothesis would be see how the elevation of the sea floor adjacent to spreading axes changes with the age of the underlying crust. John Crowley and colleagues from Oxford and Harvard Universities and the Korea Polar Research Institute analysed new bathymetry across the Australian-Antarctic Ridge, whereas Maya Tolstoy of Columbia University performed similar work across the Southern East Pacific Rise. In both studies frequency analysis of changes in bathymetry through time, as calibrated by local magnetic stripes, showed significant peaks at roughly 23, 41 and 100 ka in the first study and at 100 ka in the second. These correspond to the well known Milankovitch periods due to precession, changing axial tilt and orbital eccentricity: persuasive support for a glacial control over mid-ocean ridge magmatism.

Enlarged by 100% & sharpened file with IrfanView.
Periodicities of astronomical forcing and global climate over the last million years (credit: Wikipedia)

An interesting corollary of the observations may be that pulses in sea-floor eruption rates emit additional carbon dioxide, which eventually percolates through the ocean to add to its atmospheric concentration, which would result in climatic warming. The maximum effect would correspond to glacial maxima when sea level reached its lowest, the reduction in pressure stimulating the greatest magmatism. One of the puzzling features of glacial cycles over the last million years, when the 100 ka eccentricity signal dominates, is the marked asymmetry of the sea-level record; slowly declining to a glacial maximum and then a rapid rise due to warming and melting as the Earth changed to interglacial conditions. Atmospheric CO2 concentrations recorded by bubbles in polar ice cores show a close correlation with sea-level change indicated by oxygen isotope data from oceanic sediments. So it is possible that build-up of polar ice caps in a roundabout way eventually reverse cooling once they reach their greatest thickness and extents, by modulating ocean-ridge volcanism and thereby the greenhouse effect.