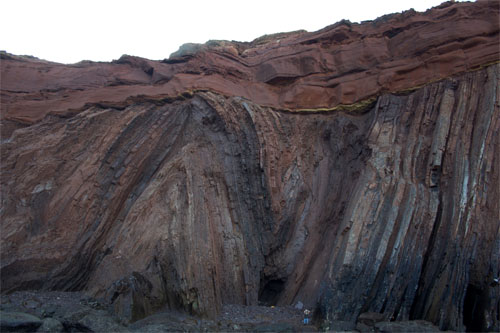
Angular unconformity at Telheiro Beach, Portugal (credit: Gabriela Bruno)
This image posted at Earth Science Picture of the Day would be hard to beat as the definitive angular unconformity. It shows Upper Carboniferous marine metagreywackes folded during the Variscan orogeny overlain by Triassic redbeds. Structurally it is uncannily similar to Hutton‘s famous unconformity at Siccar Point on the coast of SE Scotland, although the tight folding there is Caledonian in age and the unconformable redbeds are Devonian in age.
The earliest known remains of anatomically modern humans outside of Africa were found unearthed from the Skhul and Qafzeh caves in what is now northern Israel. Their context was that of deliberate burial at a time when climate was cooling from the last interglacial, between 90 to 120 ka. The Levant was also the repository for a number of well-preserved Neanderthal skeletons, most dating to between 35-65 ka, including ten individuals at Shanidar in today’s northern Iraq, some of whom were also deliberately buried including one whose grave reputedly contained evidence for a floral tribute. The 25 ka gap between the two populations has previous been regarded as evidence for lack of contact between them. However, the Tabun Cave in modern Israel has yielded tools attributed to Neanderthal Mousterian culture that may indicate their intermittent presence from 200 to 45 ka, and fossils of two individuals dated at ~122 and ~90 ka. The remains at Skhul and Qafzeh are significantly more rugged or robust than African contemporaries and have been considered possible candidates for Neanderthal-modern human hybrids. But whatever their parentage, it seems they became extinct as the climate of the Levant dried to desert conditions around 80 ka.
Entrance to the Shanidar Cave, northern Iraq, occupied by Neanderthals between 35-65 ka (credit: Wikipedia)
A more promising overlap between modern human and Neanderthal occupation comes with the discovery by a group of Israeli, US, Canadian, German and Austrian scientists of a much younger anatomically modern human cranium from the Manot Cave, also in northern Israel (Herschkovitz, I. and 23 others 2015. Levantine cranium from Manot Cave (Israel) foreshadows the first European modern humans. Nature (online) doi:10.1038/nature14134). The cranium has a U-Th radiometric age of ~55 ka, well within the time span of Neanderthal occupation. Moreover, Manot Cave is one of a cluster of occupied sites in northern Israel, with separations of only a few tens of kilometres: undoubtedly, this individual and companions more than likely met Neanderthals. The big question, of course, is did the neighbours interbreed? If so the Levant would be the confirmed as the probable source of hybridisation to which the DNA of non-African living humans points. There may be a insuperable difficulty in taking this further: it is thought that the high temperatures of the region, despite its dryness, may have destroyed any chance of reconstructing ancient genomes. Yet one of the first Neanderthal bones to yield useful genetic material was from Croatia, which is not a great deal cooler in summer.
A surprising number of animals pick up items from their surroundings and use them, mainly to get at otherwise inaccessible foodstuffs. What sets humans apart from such tool users is that we make them and for a long time part of our repertoire has been tools used to make other tools; so-called ‘machine tools’. An example is a piece of antler used to pressure-flake flint to give a stone blade a better edge, a more recent one is the increasing use of robots on assembly lines. Making a tool is impossible for a bird with only its beak and ill-adapted feet, while even a chimpanzee lacks various forms of grip needed for precisely directed force and manipulation. It was Frederick Engels who first focussed on the importance of the hand being freed to evolve the capacity for manual labour by the permanent adoption of an upright posture and gait, in his essay The Part Played by Labour in the Transition from Ape to Man written in 1876.
The earliest tools known turned up in 2.6 Ma old sediments at Gona in NE Ethiopia, while evidence for tool use is well accepted from cracked and sliced bones found in sediments dated at 2.5 Ma from Bouri in the same region. In neither case can the finds be tied to fossil remains of the makers and users, the earliest direct link emerging from famous Olduvai Gorge in western Tanzania, where crude Oldowan tools and worked bones occur with incomplete remains of a hominin, dubbed Homo habilis (‘handy man’) because of this association. Somewhat more controversial are bones that show cuts and scrape marks plus signs of having been cracked open that were found in a 3.4 Ma context at Dikika, also in Ethiopia, within the same sedimentary horizon as the young Australopithecus afarensis known as Selam (‘Hello’). The Dikika material is little different from 0.9 to 1.2 Ma younger bones at Bouri and Olduvai: the controversy seems to stem more from its much greater age and association with hominins deemed by some to have been incapable of creating tools.
Bone structure of the (right) human hand. (credit: Wikipedia)
An entirely novel approach to the issue of the first tools and their makers, which with little doubt would have tickled Engels no end, is a careful anatomical and physiological examination of fossil hominin hand bones in comparison with those of chimps and living humans (Skinner, M.M. et al. Human-like hand use in Australopithecus africanus. Science, v. 347, p. 395-399). The bones being scrutinized are the five metacarpals that form the links in the palms from muscles of the forearm to finger and thumb movements and thus to various kinds of grip. In humans there are a host of ways of gripping objects from the precision of opposed thumb and finger pinching, especially that using the forefinger, to the squeezing power grip that wraps thumb and all fingers around an object and makes a fist. The best a chimp can do is grabbing a branch, to which its knuckle-walking hands are well adapted. The tips of the metacarpals are mechanically loaded according to the types of grip used repeatedly in life and that works to modify the physical density of the tips’ spongy bone tissue in patterns that vary according to habitual usage of the hand and its digits. This new approach is reputedly far more diagnostic than the actual shape of metacarpal bones, and requires high-resolution CT scanning.
Known early human and Neanderthal tool-makers show very similar patterns: in fact they suggest far more heavy loading through various kinds of grip than the metacarpals of humans from the modern period. In 1.8 to 3.0 Ma old A. africanus and Paranthropus robustus (a gorilla-like but bipedal australopithecine) from South Africa metacarpals suggest that both were habitually using a tree-climbing grip, much as chimpanzees do, but more closely resembled modern human and Neanderthal committed tool users. Both were certainly capable of using forceful precision grips to make and use tools up to 0.5 Ma earlier than the date of the earliest known tools. So far the technique has not been applied to the palm bones of earlier hominins such as A. afarensis (2.9-3.9 Ma) andOrrorin tugenensis (~6 Ma). Despite the suggestion of tool-making capability, agreeing that it did take place in non-Homo hominins must await finds of tools, as well as signs of their use, in close association with fossil remains of their makers. The Dikika association is simply not enough. Yet, some bipedal being must have made tools before the date of the earliest ones (~2.6 Ma) discovered at Gona. Look at it this way: it is a lucky archaeologist who discovers every piece of evidence for a fundamental social change at one site. The fact that, by definition, the vast bulk of Pliocene and Pleistocene sediments that may contain the key evidence is either buried by younger material or was a victim of erosion, means that the chance of resolving the origin of the fundamental feature of human behaviour is tiny. The chance that scientists will continue looking is astronomically higher.
One of the central measures used to describe modern ecosystems is the ratio of foliage area to that of the ground surface – the leaf area index (LAI) – which expresses the openness of vegetation canopies. A high LAI helps to retain moisture in the soil, partly by shading and cooling the surface to reduce evaporation and partly by stopping surface soil from being battered to a concrete-like consistency by heavy rain, which reduces the amount of water that can infiltrate. It is possible to estimate LAI across today’s entire land area using satellite image data but a proxy for palaeoecological LAI has remained hard to find.
Hemispherical photograph used to calculate modern canopy cover. (credit: Wikipedia; photo by S.B. Weiss)
The outer coating of leaves in well-shaded (high LAI) areas tends to have protective or pavement cells that are larger and have more complicated shapes than does that of leaves in more open canopies. The framework of leaf cells is silica-based and made up of structures known as phytoliths whose morphologies vary in much the same way as the cells that they support. So theoretically it is possible to use fossil phytoliths in terrestrial sediments to estimate LAI variations through time in local canopies, but first the approach needs a means of calibration from living ecosystems. The vegetation of Central American Costa Rica varies through the entire range of possible LAI values, which leads to varying amounts of sunlight available to the leaves of cover plants. Measuring the area and the degree of shape-complexity of phytoliths in modern soils there shows that each is positively correlated with LAI.
A modern herbivorous mammal (lowland paca) from dense forest in Costa Rica. (Photo credit: Wikipedia)
Putting this approach to use in the Cenozoic terrestrial sediments of Patagonia, US and Argentinean palaeoecologists aimed to examine how the evolution of the teeth of herbivorous mammals – a major feature in their speciation – linked to changes in vegetation structure (Dunn, R.E. et al. 2015. Linked canopy, climate and faunal change in the Cenozoic of Patagonia. Science, v. 347, p. 258-261). Using phytoliths they were able to show that in the Eocene the area was covered by dense, closed forest canopies that gradually became more open towards the end of the Eocene to be replaced by open forest and shrubland habitats in the Oligocene and Miocene, with a brief period of regreening. It was during the period of more open vegetation that tooth structure underwent the most change. Chances are that the vegetation shifts began in response to the onset of Antarctic glaciation at the beginning of the Oligocene Epoch and related climate change at the northern margin of the Southern Ocean. Changes in the herbivore teeth may have been in response to the increasing amount of dust adhering to leaves as canopies became more open and soil increasingly dried out.
It’s good to know that the geosciences have had revolutionising developments to match those of the rest of science. Forget the Battle of Waterloo in 1815, which of course was ‘the nearest-run thing you ever saw in your life’ when the Brits were saved from defeat by the timely arrival of the Prussians: This year we can celebrate one that literally put geology on the map, kicked-off the systematic exploration for every kind of physical resource, thereby putting a great deal of money in the pockets of coal, petroleum and metal moguls and making geology a career rather than a pastime. In 1815 William Smith published A Delineation of the Strata of England and Wales with part of Scotland, which despite the title was a map showing the basic geology and structure of the whole of England and Wales: the first ever map showing accurately the distribution of rocks for an entire country. The original, at 2.6 by 1.8 m, dominates the main staircase at Burlington House, the home of the Geological Society of London.
William Smith’s A Delineation of the Strata of England and Wales with part of Scotland (1815)
Tom Sharpe has nicely summarized the key facts surrounding Smith’s masterpiece (Sharpe, T. 2015. The birth of the geological map. Science, v. 347, p. 230-232). One feature that I certainly did not know was that the colour scheme for the different stratigraphic units was based on the dominant colour of the rocks themselves, such as purples for the abundant slates of the Lower Palaeozoic, brown and red for the Old- and New Red Sandstone, greys and blacks for the Coal Measures and green for the Greensand, which until quite recently remained widely used to signify Cambrian, Ordovician and Silurian; Devonian and Permian; Upper Carboniferous and Cretaceous.
Although celebrated today, Smith’s map was panned by the gentlemen geologists of the Geol Soc, who attempted to do a better job, but failed ignominiously. William Smith was not a leisured chap of the Enlightenment, but worked for a living surveying coal mines, navigating canals and draining fens. Despite their antipathy, the Fellows of the Geological Society of London knew a good earner when they saw one and plagiarized Smith’s work and undercut his regular price for his map. As a result he ended up in a London debtors’ prison. Even on the day of his release in 1819, bailiffs seized his house and its contents. The Geol Soc eventually did honour Smith with its Wollaston Medal in 1831, its then president Adam Sedgwick dubbing him ‘the Father of English Geology’: by that time geology had become a profession…
One of the most daring hypotheses of modern geosciences: is that of the ‘Verneshot’ reported by Earth Pages in 2004. Jason Phipps Morgan and colleagues explored the possible consequences of a build-up of volatiles in plume-related magmas at the base of thick continental lithosphere beneath cratons, prior to the eruption of continental flood basalts. They suggested that pressure would eventually result in an explosive release at a lithospheric weak point, followed by collapse above the plume head that would propagate upwards, at hypersonic speeds. Modelling the forces involved, the authors of the novel idea considered that they would be sufficient to fling huge rock masses into orbit. Verneshots might neatly explain the circumstances around mass extinctions, such as their coincidence with continental flood basalt events; large impact structures, most likely at the antipode of the event; global debris layers containing shocked rock, melt spherules; unusual element suites and compounds (including fullerenes); and enough toxic gas to cause biological devastation.
Ten years on, Verneshots are back, again in the prestigious journal Earth and Planetary Science Letters, and this time among the co-authors are Morgan père et fils (W. Jason a founder of plate tectonics, and Jason P. who launched the idea). This time the yet-to-be –accepted hypothesis comes with evidence of an extremely unusual and fortuitous kind (Vannucchi, P. et al. 2015. Direct evidence of ancient shock metamorphism at the site of the 1908 Tunguska event. Earth and Planetary Science Letters, v. 409, p. 168-174). The origin of the paper lies in an attempt to verify reports of shocked quartz in samples collected close to the centre of the 2000 km2 devastation that resulted from what is now accepted to have been a comet or asteroid air-burst explosion in June 1908 in the Tunguska region of Siberia. Apart from a disputed 300 m crater in the area, the Tunguska Event left no long-lived sign: it ‘merely’ knocked over millions of trees. However, its epicenter lay in a 10 km depression ringed by hills, that has been suggested to be a volcanic centre associated with the end-Permian Siberian Traps.
Trees knocked down and burned over hundreds of square km by the 1908 Tunguska Event (credit: Leonid Alekseyevich Kulik deceased)
The reported shocked quartz locality turned out to associated with an isolated occurrence of quartz-rich sand and rounded clasts of quartzite that contains sedimentary structures. The occurrence is surrounded by basalts of the Siberian Traps, yet is situated topographically above them. The quartzite is thought to be Permian terrestrial sandstone that commonly underlies much of the remaining extent of Siberian Traps.
Quartzite clasts do indeed contain shocked quartz, together with pseudotachylite glass veinlets, quartz and feldspar crystal growth on sedimentary grains and silica-rich glassy spherules. These features are not uniquely diagnostic of shock metamorphism, but are oddly absent from the surrounding Siberian Traps nearby, which suggests that whatever formed them predated the final eruptive stages of the end-Permian large igneous province. Indeed it would be unlikely that airburst of some extraterrestrial bolide in 1908 could produce the metamorphic features of the quartzites without setting ablaze the trees that it felled. A second possibility, that the Tunguska Depression is a Permo-Triassic impact crater and the quartzites being part of an associated central uplift runs into the unlikely coincidence of lying less than 5 km from the 1908 epicentre.
A third hypothesis is that the Tunguska Depression is a massive diatreme associated with a Verneshot. Another odd association lies 8 km to the south of the epicentre, a carbonatite that is one of many, along with smaller pipe-like structures all possibly linked to magmatic gas escape. The Tunguska Event, a mighty puzzle in its own right, may perhaps be eclipsed. Will silence return as it did after the original Verneshot hypothesis was published? Quite possibly, but another quirk about the Siberian Traps was reported by Earth Pages in mid-2014. In a contribution to a link between this massive end-Permian volcanic effusion and the Permian-Triassic mass extinction it was noted that in the Chinese sedimentary repository of evidence for the extinction there is an isolated spike in the abundance of nickel that is almost certainly of volcanic origin, but only the one when repeated flood basalt events perhaps ought to have led to a series of nickel anomalies. One huge volcanic gas release as the Siberian Traps were building up?
In mid-December, British universities, their constituent units and departments, and most academics experienced the same kind of traumatic day familiar to 18-year olds awaiting the examination results on which their advancement to higher education, or not, depended. December 18th, 2014, was REF-Day. Since its predecessor (RAE-Day), 8 years before, a vast – by university standards – effort went into preparing bids on a department-by-department basis to rank them nationally and conflate individual assessments to build a sort of institutional league table for research excellence; hence REF stands for Research Excellence Framework (the RAE was the less meritorious-sounding Research Assessment Exercise). It resembled the Guide Michelin or Automobile Association star system for restaurants and hotels or guest houses. The reason for the 8-year frenzy of activity was that the outcomes aimed to inform the selective allocation of governmental research funding. Unsurprisingly, this kind of competition stemmed from the Tory government of Margaret Thatcher, which in 1986 set the scene for ‘performance-related’ funding rather than that based on peer review of each individual bid for major grants, which preceded it.
To itemise each aspect of the way the REF worked could take the majority of Earth Pages readers to an early and ignoble grave. It centred on departmental selection from its full-time researchers of those who were deemed to be ‘research active’ and those who were not, the former having to select four recently published works or ‘outputs’. They had to self-assess each according to its ‘impact’, defined as ‘an effect on, change or benefit to the economy, society, culture, public policy or services, health, the environment or quality of life, beyond academia’. Institutions vetted and bundled individual submissions, collated them in the subject areas designated by the REF, then sent them off to ‘REF Central’, where they were to be reviewed by subject-specialist panels that gave out the stars for each submitted item of work: **** = world-leading (30% were deemed to be); *** = internationally excellent (46%); ** = recognized internationally (20%); * = recognized nationally (3%); unclassified = below the standard of national recognition (1% – presumably those obviously lacking star quality were weeded out at institution level). There were more than 190 thousand ‘outputs’, which begs the questions; Were all of them read by at least one specialist panel member? Against what standards were they judged?
On average, each of the roughly 1000 panelists would have had to consider about 190 outputs in greater depth than a casual skim, or more if some were read by several panelists. Outputs were rated ‘in terms of their “originality, significance and rigour”, with reference to international research quality standards’, ‘the “reach and significance” of impacts on the economy, society and/or culture’ and the part they played in their department’s contribution to ‘the vitality and sustainability… of the wider discipline or research base’. On paper – and believe me, REF Central produced plenty of wordy PDFs of guidance – this level of scrutiny makes the adjective ‘daunting’ seem a bit of an understatement. Entering into this spirit of things in the gleeful manner of a Michelin or AA assessor does seem to me a bit hard to grasp. I wonder if the panels in reality just checked each submission for signs of an overly hubristic vision of self-worth.
To some extent, the issue of each output’s citation count or other bibliometric measure must at some stage have come into REF reckoning, and here is what spurred me to defy normal cautions about boredom as a contributor to general organ failure. Physicist Reinhard Werner of Leibniz University in Hanover, Germany believes that deciding on funding and hiring, or firing, needs to steer well-clear of impact factors, citations and other kinds of bibliometrics (Werner, R. 2015 The focus on bibliometrics makes papers less useful. Nature, v. 517, p. 245). Scientists cite other works for many reasons, some worthy and some less so. But it is rare that in doing so we express any opinion on the overall significance of the work that we choose to cite. Yet, conversely, a researcher can choose a field, phrase some findings and submit to such and such journal that will boost their citation frequency and impact. Just by writing about some mundane topic in a publicly accessible way, reviewing the work of lots of other people, or simply writing about this or that topic as observed or measured in an especially highly populous country where science is really booming does much the same thing. Werner makes a telling point, ‘When we believe that we will be judged by silly criteria, we will adapt and behave in silly ways’. Although he does not touch on the absurdities of the REF – why on Earth would he? – Werner comments on distortion of the job market, and peer-reviewed journals. He also pleas for a return to proper scrutiny of scientific merit and, I suspect, for cutting hubris off at the roots.
The early 21st century seems to have been plagued by very powerful earthquakes: 217 greater than Magnitude 7.0; 19 > Magnitude 8.0 and 2 >Magnitude 9.0. Although some lesser seismic events kill, those above M 7.0 have a far greater potential for fatal consequences. Over 700 thousand people have died from their effects: ~20 000 in the 2001 Gujarat earthquake (M 7.7); ~29 000 in 2003 Bam earthquake (M 6.6); ~250 000 in the 2004 Indian Ocean tsunami that stemmed from a M 9.1 earthquake off western Sumatra; ~95 000 in the 2005 Kashmir earthquake (M7.6); ~87 000 in the 2008 Sichuan earthquake (M 7.9); up to 316 000 in the 2010 Haiti earthquake (M 7.0); ~20 000 in the 2011 tsunami that hit NE Japan from the M 9.0 Tohoku earthquake. The 26 December 2004 Indian Ocean tsunamis spelled out the far-reaching risk to populated coastal areas that face oceans prone to seismicity or large coastal landslips, but also the need for warning systems: tsunamis travel far more slowly than seismic waves and , except for directly adjacent areas, there is good chance of escape given a timely alert. Yet, historically http://earthquake.usgs.gov/earthquakes/world/most_destructive.php, deadly risk is most often posed by earthquakes that occur beneath densely populated continental crust. Note that the most publicised earthquake that hit San Francisco in 1906 (at M 7.8) that lies on the world’s best-known fault, the San Andreas, caused between 700 and 3000 fatalities, a sizable proportion of which resulted from the subsequent fire. For continental earthquakes the biggest factor in deadly risk, outside of population density, is that of building standards.
A poor neighbourhood in Port au Prince, Haiti following the 2010 earthquake measuring >7 on the Richter scale. (credit: Wikipedia)
It barely needs stating that earthquakes are due to movement on faults, and these can leave distinct signs at or near to the surface, such as scarps, offsets of linear features such as roads, and broad rises or falls in the land surface. However, if they are due to faulting that does not break the surface – so-called ‘blind’ faults – very little record is left for geologists to analyse. But if it is possible to see actual breaks and shifts exposed by shallow excavations through geologically young materials, as in road cuts or trenches, then it is possible to work out an actual history of movements and their dimensions. It has also become increasingly possible to date the movements precisely using radiometric or luminescence means: a key element in establishing seismic risk is the historic frequency of events on active faults. Some of the most dangerous active faults are those at mountain fronts, such as the Himalaya and the American cordilleras, which often take the form of surface-breaking thrusts that are relative easy to analyse, although little work has been done to date. A notable study is on the West Andean Thrust that breaks cover east of Chile’s capital Santiago with a population of around 6 million (Vargas, G. Et al. 2014. Probing large intraplate earthquakes at the west flank of the Andes. Geology, v. 42, p. 1083-1086). This fault forms a prominent series of scarps in Santiago’s eastern suburbs, but for most of its length along the Andean Front it is ‘blind’. The last highly destructive on-shore earthquake in western South America was due to thrust movement that devastated the western Argentinean city of Mendoza in 1861. But the potential for large intraplate earthquakes is high along the entire west flank of the Andes.
Vargas and colleagues from France and the US excavated a 5 m deep trench through alluvium and colluvium over a distance of 25 m across one of the scarps associated with the San Ramon Thrust. They found excellent evidence of metre-sized displacement of some prominent units within the young sediments, sufficient to detect the effects of two distinct, major earthquakes, each producing horizontal shifts of up to 5 m. Individual sediment strata were dateable using radiocarbon and optically stimulated luminescence techniques. The earlier displacement occurred at around 17-19 ka and the second at about 8 ka. Various methods of estimation of the likely earthquake magnitudes of the displacements yielded values of about M 7.2 to 7.5 for both. That is quite sufficient for devastation of now nearby Santiago and, worryingly, another movement may be likely in the foreseeable future.
The “marching caterpillars” of the Basin and Range province, showing the San Andreas Fault in green (credit: University of Maryland, USA)
The Basin and Range province of the western US is one of the world’s largest products of continental extension. Being semi-arid, sedimentation has been unable to keep pace with crustal thinning thereby giving form to its name: linear mountain ridges separated by sediment-filled basins. Despite the extreme extension the Basin and Range has an average elevation of about 1400 m, although it is well below that of the Sierra Nevada range (2000+ m) that flanks it to the west. Throughout the Mesozoic, subduction towards the east beneath the North American plate produced voluminous magmas and fold-thrust belts adding to the continental crust in a manner similar to that still occurring in the South American Andes. Extension began in earnest during the Eocene (~45 Ma) and continues today. Much of the theory regarding continental extension – listric normal faults and detachments, fault-tilt blocks, core complexes etc. – stems from studies in this huge terrain. As regards the evolution of the Basin and Range, it has been widely thought that by the Late Oligocene (~25 Ma) the thickened Cordilleran crust had been reduced to a plateau no higher than the present Sierra Nevada, which subsequent extension reduced to the present Basin and Range.
The Eocene to Miocene extensional history was punctuated by huge episodes of explosive volcanism from which hot ash flowed laterally for hundreds of kilometres, relics of which are still widespread. Such ignimbrites are often very porous and were aquifers while still exposed, until buried by sediment and subsequent nuée ardent flows. Groundwater at the time of first exposure altered the volcanic glass shards from which ignimbrites are formed, so that the oxygen and hydrogen making up what was originally rainwater is now locked in the altered ash flows. The hydrogen isotopic composition of such meteoric water is known to vary with the altitude of the clouds shedding it. Water containing the heavier hydrogen isotope deuterium (D) is preferentially precipitated at low altitudes, so that high altitude rainfall is significantly depleted in it. Because of this the alteration can give clues to the former topographic elevation of the ignimbrites when they first rushed across the land surface. Applying this method to the repeated ignimbrite events in what is now the Basin and Range has given a good idea of the actual evolution of the land surface in the western US during the Palaeogene (Cassel, E.J. et al. 2014. Profile of a paleo-orogen: high topography across the present-day Basin and Range from 40-23 Ma. Geology, v. 42, p. 1007-1010).
The results present a major surprise. In the Eocene, elevation across the area was, as anticipated, a little more than the present Sierra Nevada (2000-2500 m). This fell back to roughly 2000 m, again as theory would suggest. But by the Late Oligocene (23-27 Ma) elevation expected to have declined further over the Basin and Range actually leapt to between 2500-3500 m, up to 2.1 km higher than it is today: the opposite of prediction. Effectively, despite evidence for Palaeogene extension the crust was buoyed-up probably by an upwelling of the asthenosphere and increased heat flow. The unexpected uplift occurred towards the end of subduction of oceanic lithosphere beneath western North America, the dynamics of which prevented the westward collapse of an earlier orogen. When subduction ended and the plate-margin tectonics became strike slip, as witnessed by the San Andreas Fault, the continental crust slid apart in the manner of books on a library shelf if a bookend is removed.
Related articles
Johnson, S.K. 2015. From rain to ranges. Scientific American, v. 312 (January 2015), p. 12-13.
Original fossils of Pithecanthropus erectus (now Homo erectus) found By Eugene Dubois in Java in 1891 (credit: Wikipedia)
Eugene Dubois, an anatomist at the University of Amsterdam in the late 19th century, became enthralled by an idea that humans had evolved in what is now Indonesia, contrary to Charles Darwin’s suggestion of an African origin. So much so that Dubois took the extraordinary step of joining the Dutch army and scrounging a posting to the Dutch East Indies to facilitate his search for a ‘missing link’, accompanied by his wife and newborn daughter. After a four-year quest, in 1891 he discovered the upper cranium and brow of a being that was obviously related to us, but also quite distinct as regards its beetling brow ridges. Pithecanthropus erectus (now Homo erectus) raised a storm of controversy, sadly only resolved in Dubois’s favour after his death in 1940. Yet, as well as mounting the first deliberate search for human ancestors, Dubois collected everything possible in the sediments at Trinil, Java, so in a sense he was also an early palaeoecologist. The collection gathered dust in Leiden for the best part of a century, until archaeologist Josephine Joordens of the University of Leiden took on the task of reviewing its contents in 2007 (Joordens, J.C.A. and 20 others 2014. Homo erectus at Trinil on Java used shells for tool production and engraving. Nature (on-line): doi:10.1038/nature13962).
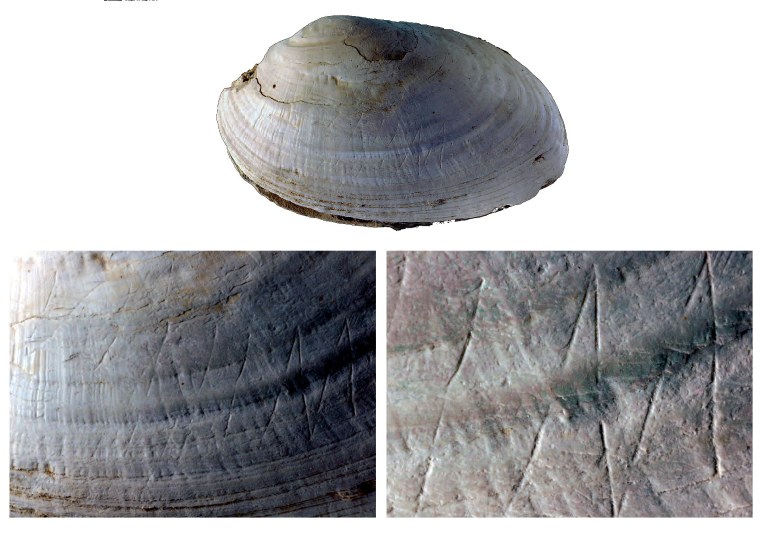
Progressively enlarged views of freshwater clam from Eugene Dubois’s collection from Trinil, showing clear evidence of deliberate engraving. (credit: Joordens et al., 2014 in Nature; photos by Wim Lustenhouwer, VU University Amsterdam)
Homo erectus clearly had a taste for freshwater clams and lots of their shells figure in the Trinil collection: all are of similar large size rather than showing a wide variation according to age, suggesting a shell midden rather than a natural assemblage. A piece of serendipity revealed what may prove to be the anthropological find of the year. High-quality photos of the shells taken by a visiting mollusc specialist showed up evidence that one of them had been meticulously engraved. Its surface had a near-perfectly geometric, zig-zag pattern deeply gouged by someone with a steady hand, who probably used an associated shark’s tooth as a scribing tool. Since the molluscs in life bear a dark, chitinous veneer the etching would have been more striking when freshly made. Another of these sturdy shells also show signs of having had its edge sharpened, suggesting that they were used for tools such as scrapers or graters.
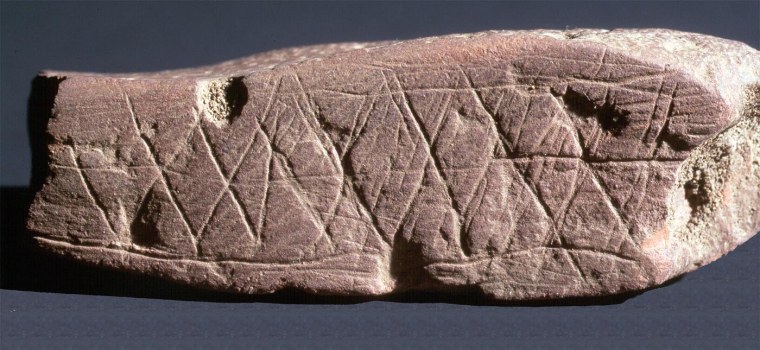
The stratigraphy at Trinil suggested that the engraved shell and tools were coeval with Homo erectus, but that needed proof. Using sediment grains trapped in the shells and a combination of 40Ar/39Ar and thermoluminescence dating, the team have shown that they and the human fossils from Trinil date to between 430 and 540 thousand years ago: at least 350 ka older than the very similar engravings made by an anatomically modern human on ochre that was found at Blombos Cave in South Africa. The next-oldest putative artwork is the controversial ‘Venus’ found at Berekhat Ram on the Israel-Syria border, dated between 250 and 280 ka.
Engraved ochre from Blombos Cave, South Africa. (credit: Chris Henshilwood)
Probably the majority of palaeoanthropologists have dismissed humans other than H. sapiens as being cognitively incapable of either abstract or figurative art. The general view is that the mental capacity to create art or design began with the creation of the Blombos engraving, was restricted to anatomically modern humans and only exploded in Europe after they had migrated there by about 40 ka. A few argue that portable art, such as the Trinil and Blombos engravings, is bound by its very nature to be rare and easily overlooked. Whether having some use – counting? – merely being the making of an idle ‘doodle’ or expressing some unknowable ritual significance, the Trinil etching is a result of creativity and controlled skill that could only be the product of the H. erectus mind. Moreover, the very close comparison with the 0.35 Ma younger Blombos engraving suggests the product of a consciousness little different from that of our direct ancestors of 75 ka ago.
While animals, especially dogs, underwent domestication the deliberate or unconscious human choice of favoured physiological and behavioural traits produced distinct differences between the ancestral species and the ‘breeds’ with which we are now familiar. In general domestication has resulted in dogs with reduced jaws and flatter faces, lower aggression, especially in the case of males, and reduced stressfulness in the company of humans and other tame dogs compared with their wolf ancestors. It is widely accepted that cats have ‘tamed themselves’ through the adoption of lifestyles associated with the benefits of close association with human communities, which have resulted in similar adaptations to those in more deliberately domesticated dogs. It is beginning to dawn on anthropologists that human social evolution may unwittingly have affected the course of our own evolution. Tighter social bonding among growing sizes of communities as brain capacity increased and the behavioural and cognitive attributes needed for that have been summarised recently by a group associated with the Social Brain hypothesis of Robin Dunbar of Oxford University, UK (Gamble, C., Gowlett, J. & Dunbar, R.I.M. 2014. Thinking Big: How the Evolution of Social Life Shaped the Human Mind. ISBN-13: 978-0500051801;Thames and Hudson: London).
It was Charles Darwin who first speculated that ‘Man in many respects may be compared with those animals which have long been domesticated’. But to what extent does the hominin fossil record support such a view? Collaborators from Duke University and the University of Iowa, USA, have set out to analyse physiological changes over the last 200 ka that may be explained in this way (Cieri, R.L. et al. 2014. Craniofacial feminization,social tolerance and the origins of behavioural modernity. Current Anthropology, v. 55, p. 419-443. Includes discussion and responses). They used the degree of projection of brow ridges, facial shape and cranial volume from 3 groups of Homo sapiens remains: skulls older than 80 ka (13 specimens); spanning 38 to 80 ka (41) and from recent humans (1367). They found that brow ridges shrank significantly over the last 80 thousand years, faces shortened and cranial capacity decreased, especially among males. This resulted in a convergence in appearance between males and females, which the authors attributed to general lowering of testosterone and stress hormone levels through selection for greater social tolerance: akin to similar physiognomic changes in domesticated dogs which DNA analyses have shown to be been linked with modification of genes associated with aggression regulation. The finding among dogs suggests that their domestication is accomplished by slower development; i.e. young animals are naturally less fearful and have a greater tendency to taming. This delayed development from foetus to adulthood, with retention in mature individuals of juvenile characteristics, is known as neoteny, and affects all manner of adult characteristics, including coloration, snout length and the adrenal glands: as adult dogs now more resemble wolf pups, so human adults are more like young chimps than elders. At a conference where Cieri et al.’s results were presented, it was observed that hunter gatherer bands are intolerant, to the point of capital punishment, of wife stealers, murderers and seriously dishonest men, whereas such reactions fall off significantly among members of larger social groups involved in agriculture and urban life. Such modern behavioural patterns tally with brow ridge, face length and cranial capacity, perhaps linked with selection for personalities more attuned to cooperation.
Comparison of Neanderthal and Modern human skulls from the Cleveland Museum of Natural History (credit: Wikipedia)
Although earlier human species, such as H. neanderthalensis, heidelbergensis and erectus had significantly different skull anatomy, each had prominent brow ridges that, on this account, may signify both greater exposure to testosterone and less social tolerance, and smaller group sizes. But, so far, analysis of the Neanderthal genome has not led to publication of any comments about testosterone or stress-hormone related genes. However, a clear strand of discussion is developing around evidence rather than mere speculation about psychological/cognitive aspects of human evolution that challenges the old-style ‘what-you-see-is-what-there-was’ (WYSWTW) archaeological dogma: a dialectic of social and biological relationships.
Related articles: Gibbons, A. 2014. How we tamed ourselves – and became modern. Science, v. 346, p. 405-406.
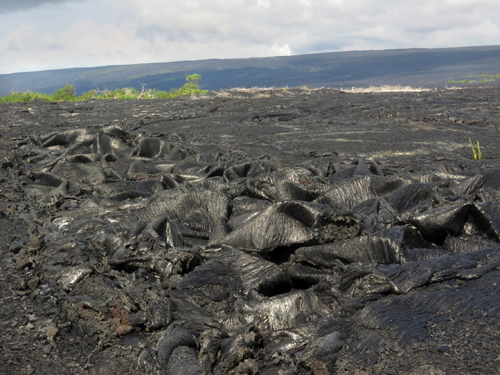
If any technical terms are likely to be remembered by anyone exposed to a bit of geological education, amongst them will be two that are Hawaiian Polynesian words: pahoehoe (‘pa hoy hoy’) and aa (‘a ah’). The first slides around the palate wonderfully while the latter give a sort of worrisome feel as if a large weight is about to land on one’s toes. Aa is lava with a blocky, broken and jagged surface, whereas pahoehoe refers to lava with the appearance of a freshly set torrent of toffee. November’s Picture of the Month is of basaltic lava that looks like it is chewable.
Pahoehoe lava from the Big Island of Hawaii. (Credit: Mila Zinkova)
When I learned about the unveiling of Lunar Mission One (LM1) , a few days after the global excitement about ESA’a Rosetta mission following Philae’s 12 November 2014 landing on a far-distant comet and success with its core experiments, it did cross my mind that here was a bit of a let-down in PR terms. There’s an old saying – ‘What can follow the Lord Mayor’s Show?’ – and the thrill of Philae’s landing rivalled any of the events at the 2012 London Olympics, plus the science it and Rosetta promise is likely to be about as leading-edge as it will get for quite some time. So what does LM1 offer that might achieve a similar scoop, and indeed your prospect of virtual immortality?
Unlike NASA or ESA missions, LM1 is to be a crowd-funded private enterprise by Lunar Missions Ltd, and for that the subscribers will want something in exchange. Through Kickstarter anyone can have a punt to help raise the initial £600 thousand goal by midnight on 17 December. Apparently that sum is to fund 3 years full-time work by a professional management team to raise further mission funds from commercial partners to take the project further: it will cost at least £0.5 billion. At this stage you can pledge any sum you wish, but what you get in return depends on your generosity. Highlights are: for £3 to 15 the reward is ‘Our eternal thanks and a place in space history’; >£15 gets you a certificate and a place in an online ‘wall of thanks’; >£30 escalates to your name being included in a digital ‘time capsule’ taken to the Moon and buried, plus membership of the Lunar Missions Club; >£60 entitles you to a voucher to invest in your own digital ‘memory box’ to go in the capsule – one of ‘millions and millions’ – and a vote on key decisions; for >£300 you can ‘Meet the Team’; >£600 gets you annual meetings and a chance to ballot for the landing module’s name; for higher contributions there are invitations to the launch (>£1200), sealing of the digital archive capsule and your name engraved on the lander (>£3000); and – wait for it – you get a place in the viewing gallery at Mission Control if you can stump up more than £5000.
For those contributing £60 or more, what goes in the much vaunted digital ‘Memory Box’ is on a sliding scale, from the equivalent of a text message to a strand of your hair and the DNA in it. One catch, if you are thinking of resurrection, is that it will be at the bottom of a 5 cm diameter hole at least 20 m deep. The buried digital archive will also contain a record of all living species on Earth and the entire history of humankind to date, but a continually updated copy will also be freely available online. Wikipedia seems not to be associated for some reason, but every item in this public archive will be peer-reviewed through an editorial board to whose deliberations schools, colleges and universities can contribute. The buried, multi-Terabyte, digital capsule is said to have a life of perhaps a billion years. Currently the longest lived data storage (~1500 years) is still ink on vellum, whereas the most advanced static and optical digital media are estimated to have a maximum 100 year lifetime, subject to technical obsolescence. On the plus side, privacy is guaranteed, partly by the nature of the storage. So, for £10000 Joe and Josie Soap will figure on a kind of cenotaph but who- or whatever digs up the module will learn absolutely nothing about them and but conceivably could clone them from their anonymous strands of hair.
What are the science goals for an LM1 landing scheduled for 2024 that cannot be achieved by lunar-lander and sample-return missions currently under state-funded development by China, Russia, NASA, Japan and India before LM1 reaches the ‘Go/No Go’ stage? The landing is planned for the Moon’s South Pole, on the rim of a major crater. There, LM1 will drill a hole to between 20-100 m deep, using a maximum of 1 kW of solar power – this ‘will also be a major leap forward for safer and more efficient remote drilling on Earth’: make of that claim what you will. Such a hole is said to enable sampling of pristine lunar rock in 15 cm lengths of 2.5 cm diameter core through the debris of the impact that caused the crater. The core samples are to be chemically analysed in the lander to test the hypothesis that Earth and Moon shared their origins. Future missions may pick up the cores and return them for more detailed analysis on Earth. But consider this: the oldest rocks known from the Apollo programme are approximately 4.4 billion year-old, feldspar-rich anorthosites that are thought to have formed the lunar highlands through fractional crystallisation of an early magma ocean that immediately followed Moon formation. Any unfractionated lunar material is only likely, if at all, at far greater depths than 20 m, and none was found or even suggested among the 0.4 tonnes of samples returned by the Apollo missions, which have been repeatedly analysed using advanced instruments. Indeed, near-surface debris from a crater rim is unlikely to be any more diverse lithologically than the various kinds of lunar surface from which the Apollo samples were collected, and may be contaminated by whatever caused the cratering and by the immense, long-lived heating at the impact site itself.
Lunar Ferroan Anorthosite #60025 (Plagioclase Feldspar). Collected by Apollo 16 from the Lunar Highlands near Descartes Crater. (credit: National Museum of Natural History in Washington, D.C.)
Compared with the prospect of advancing understanding of the origins of life and the Earth’s oceans, and the early stages of Solar System evolution from data provided by Rosetta and Philae, LM1 might seem less exciting, though the buzz being hyped is that it would be a People’s Mission. Yet those who place their punt on it and the commercial concerns that ultimately earn from it are two different sets of people. The ambitious global education wing will, of course, face competition from the growth of MOOCs in the science, technology, engineering and maths area that have a considerable head start, but it does have a noble ring to it. Whatever, if you make a pledge before midnight on 17 December this year and the ‘pump-priming’ target is not met by then, you pay nothing. If £600 thousand is raised there is no going back and only 10 years to wait. But what a challenge, you may well think… LM1 definitely has the edge over Virgin Galactica, but here on Earth there are probably a great many more vital challenges than either.
What was the most devastating natural disaster ever to face humans? It would be tempting to suggest the Indian Ocean tsunami of 26 December 2004, but that is because most people remember it with horror. In fact the worst the Earth ever flung at us was much further back in our history and left a huge spike of sulfates in the Greenland icecap at around 73 thousand years ago. This relic of volcanic aerosols that had blasted into the stratosphere was tracked back to a 100 by 30 km caldera in Sumatra now occupied by a lake (Lake Toba) that is 500 m deep in places and almost filled by a slightly off-centre island. The eruption explosively ejected 2800 cubic kilometres of magma, of which an estimated 800 km3 fell as ash across a wide swath of the tropics westwards of Sumatra at least as far as Arabia and East Africa; the line of march taken by anatomically modern humans migrating from Africa. In India and Malaysia the Toba ash layer reaches 5-10 m thickness and probably occurs undetected as a thin layer across the entire tropics. Around 1010 tonnes of sulfuric acid belched out, some to enter and linger in the stratosphere, which is estimated to have caused an average decrease in average global temperatures of 3.0 to 3.5 °C for several years. Studies of human mtDNA hint at a genetic bottleneck around the time of Toba’s eruption and a large decrease, perhaps as much as 60%, in the global population of Homo sapiens. But humans survived or quickly filled devastated land in India, where stone tools are found both below and just above the Toba ash layer.
Landsat image (120 km across) of Lake Toba, the largest volcanic crater lake in the world. (credit: Wikipedia)
The largest volcanic eruption in the last 26 Ma, there can be little doubt that no other natural catastrophe had as large an influence on humanity as did Toba. Of course, slower processes such as climate change and ups and downs of sea level lay behind the repeated spread of humans out of Africa and probably their evolution as a whole. The drama of the Toba event has drawn attention to the massive risk posed by supervolcanoes in general, such as that centred on Yellowstone in the NW US, which show signs of activity 640 ka after its last major explosive event. Toba certainly is not dead, for its peculiar island of Samosir has been uplifted steadily since the eruption by about 450 m, probably due to influx of magma deep beneath the surface, and experiences shallow earthquakes. What lies in the guts of supervolcanoes is literally a hot topic and a new 3-D imaging method has been applied to Toba.
Traditional village on Samosir island, Lake Toba. (credit: Wikipedia)
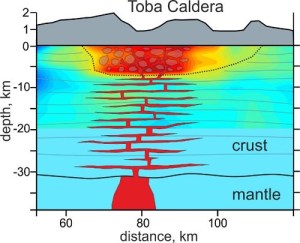
Seismic tomography that uses background or ambient seismic noise has become a powerful technique for studying the crust and lithosphere when small-amplitude short-wavelength Rayleigh and Love surface waves are monitored to pick up subsurface reflecting bodies and measure variation in wave speed with depth. The greater the density of seismometers deployed, the finer the resolution of deep crustal features and 40 such detectors are in place around Lake Toba. A team of Russian, French and German geophysicists have reported new results bearing on how magma may be accumulating beneath the vast caldera (Jaxibulatov, K. et al. 2014. A large magmatic sill complex beneath the Toba caldera. Science, v. 346, p. 617-619). Down to about 7 km the tomography has picked up a structurally homogeneous low-speed zone directly beneath Samosir Island that the authors attribute to the 73 ka explosive eruption. Beneath that several magma sills appear to dominate the sub-caldera crust, possibly responsible for the post eruption uplift within the caldera: the precursor to a layered intrusive body and each an increment towards a further huge eruption.
Interpretation of seismic tomography cross section of Toba. Greens to reds increasingly negative shear speed anomaly. Showing magma sills in lower crust and 74 ka damage zone above 7 km. (credit: Jaxibulatov et al. 2014
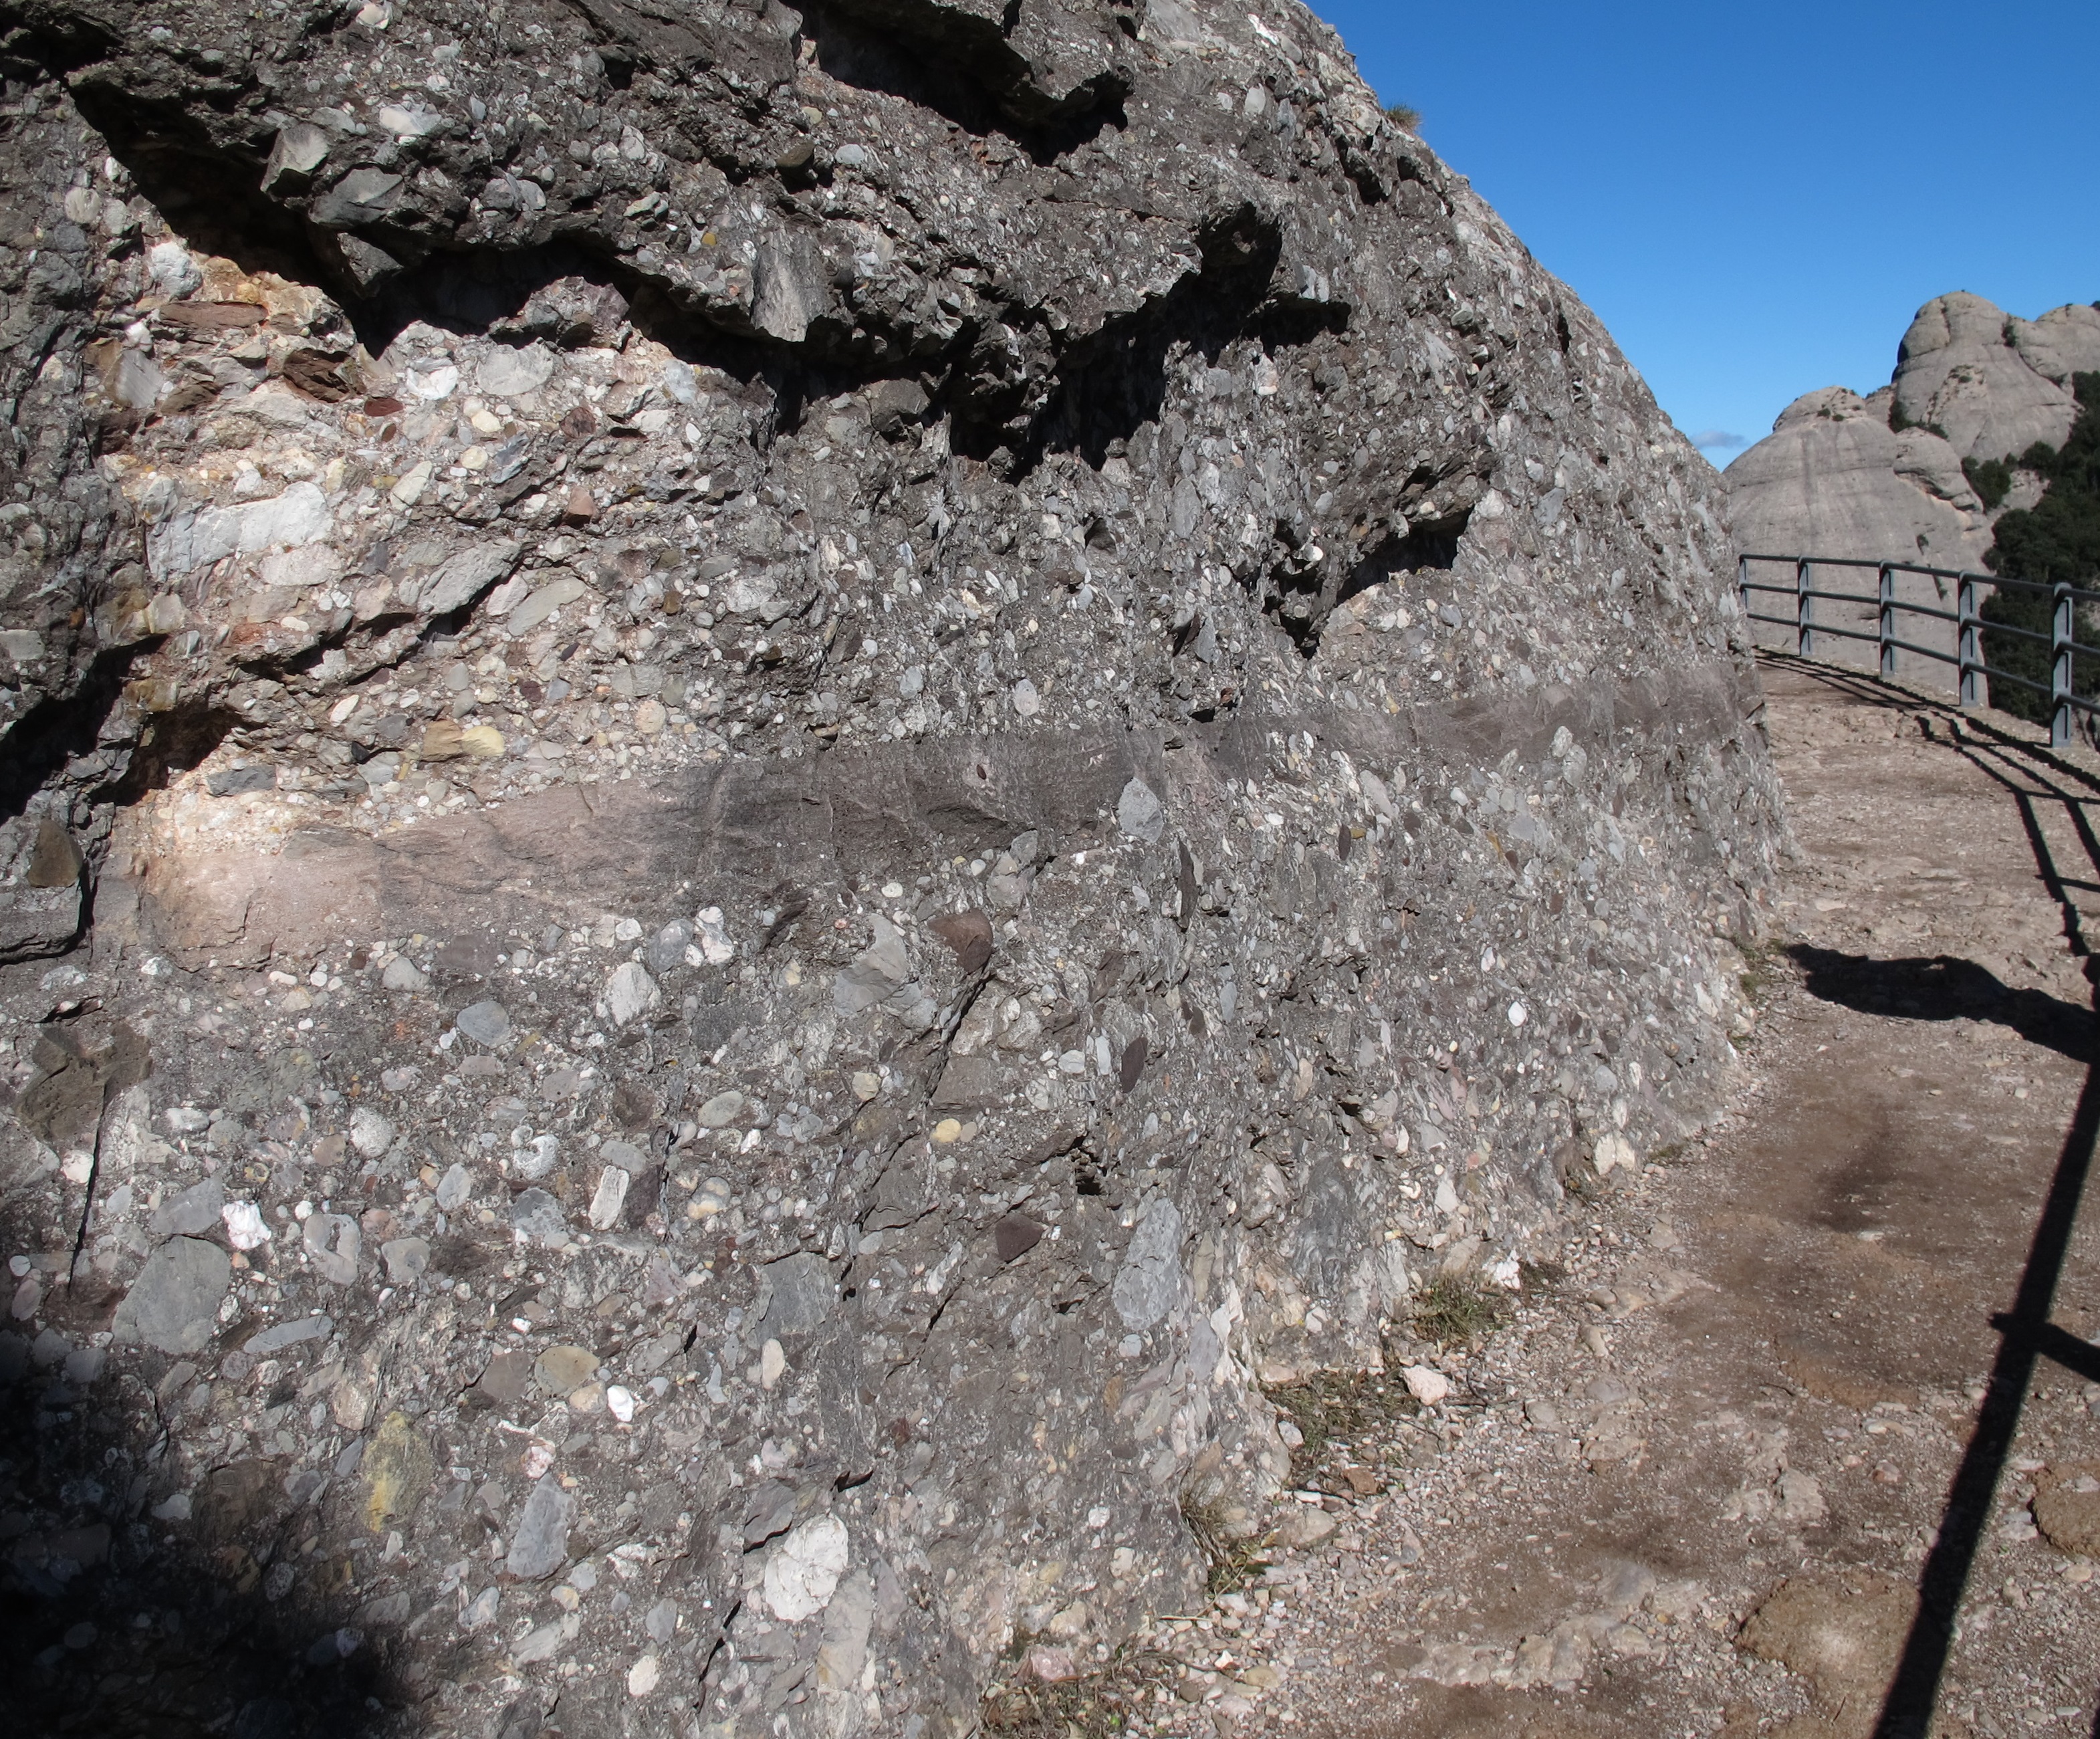
The Montserrat mountains are part of the Pre-Coastal Range of Catalonia in Spain and rise close to the capital Barcelona to form a spectacular backdrop.
Their peculiar pinnacled form results from their comprising tough, well-cemented thick conglomerates, pink in colour and having formed in an early Cenozoic delta. The conglomerates are in very thick, homogeneous beds riven by vertical joints. These two features control the serrated and pinnacled topography, from which is derived the ranges’ Catalan name.
Cenozoic conglomerates of the Monserrat mountains, Catalonia (credit: Wikipedia)
Since discovery of its fossilised remains in Liang Bua cave on the Indonesian island of Flores was discovered in 2004 the diminutive Homo floresienesis, dubbed the ‘hobbit’ by the media, has remained a popular news item each time controversies surrounding it have flared. To mark the tenth anniversary of its publication of a paper describing the remains Nature has summarised the recollections of many of those involved in trying to understand the significance of H. floresiensis(Callaway, E. 2014. Tales of the hobbit. Nature, v. 514, p. 422-426). Two main schools of thought continue in dispute, one holding that it is anatomically so different from anatomically modern humans and earlier members of the genus Homo that it constitutes a new species, despite its youngest member dating back only 18 ka, the other that it is H. sapiens, its tiny size having resulted from some kind of genetic disorder, such as microcephaly or Down’s syndrome. There have been so many attempts to expunge the idea of such an odd fossil cohabiting an island with fully modern humans yet being a different and perhaps extremely archaic species that such an outlook itself seems somewhat pathological.
Replica of the Homo floresiensis skull from Liang Bua cave, Flores, Indonesia (credit: Wikipedia)
The evidence presented to force H. floresiensis into a deformed human mould has never been convincing, and the best way of combating that view is to document from a ‘non-combatant ‘standpoint the many ways in which its anatomy differs from ours and how it might have arisen; a job to which Chris Stringer of the Museum of Natural History in London is amply qualified (Stringer, S. 2014. Small remains still pose big problems. Nature, v. 514, p. 427-429). He, like the original discoverers, feels this is a case of evolution of small stature due to a limited population being isolated for a long time on a relatively small island, which is just what happened to elephants that colonised Flores to become the pigmy Stegodon that H. floresiensis seemingly hunted. These tiny Flores dwellers (adults were about 1 m tall) used fire and made tools, similar ones dating as far back as ~1 Ma. Stringer mentions the possibility of first human colonisation about that time by Asian H. erectus but also the view that if it happened once there may have been several waves of immigration to Flores. The unusual ‘hobbit’ anatomy is not restricted to tiny size and a small skull and brain cavity (400 cm3), but includes odd hips, wrist bones, shoulder joint and collar bone. In fact the remains bear as much or more resemblance to australopithecines like ‘Lucy’ (3.2 Ma) than to other members of our genus, even H. erectus that has been proposed as its possible ancestor. Could they be far-travelled descendants of the 1.8 Ma old H. georgicus from Dmanisi in Georgia? More fossils clearly need to be found, and Stringer raises the possibility of the search being widened to other islands east of Java, such as Sulawesi, the Philippines and Timor. He hints that in such a tectonically active region tsunamis may have led to animals and humans saving themselves and then being current dispersed on rafts of broken vegetation, rather like some survivors of the 2004 Indian Ocean tsunami who ended up 150 miles from their homes by such a means.
Another story that is set to ‘run and run’ is that of ‘alien’ DNA in the human genome and productive relations between early out-of-Africa migrants with Neanderthals, Denisovans and perhaps yet a mysterious, earlier human species. The oldest (45 ka) anatomically modern human genome sequence so far charted is from a leg bone found by a mammoth-ivory prospector in Siberian permafrost (Fu, Q. and 27 others 2014. Genome sequence of a 45,000-year-old modern human from western Siberia. Nature, v. 514, p. 445-449). Like a great many living non-Africans this individual carried about 2 % Neanderthal DNA, but unlike living people the 45 ka genome has it in significantly longer segments. That allowed the authors to re-estimate the timing of the genetic flow from Neanderthals into the individual’s ancestors. Previous estimates from living DNA geve the possibility of that being between 37-86 ka, but this closer data suggests that it happened between 7 to 13 ka before the date of the fossil femur, i.e. narrowing it down to between 52 and 58 ka closer to the widely suggested time of African exodus around 60 ka (but see an Earth Pages item from September 2014)
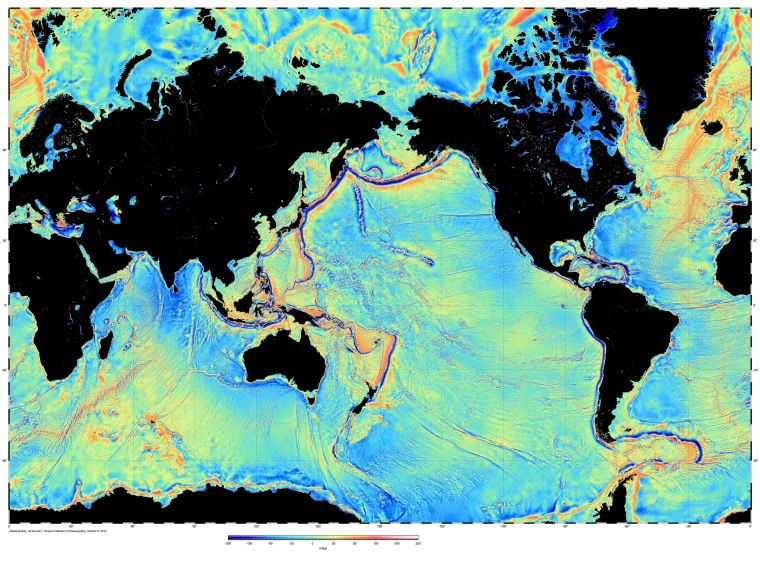
By far the least costly means of surveying the ocean floor on a global scale is the use of data remotely sensed from Earth orbit. That may sound absurd: how can it be possible to peer through thousands of metres of seawater? The answer comes from a practical application of lateral thinking. As well as being influenced by lunar and solar tidal attraction, sea level also depends on the Earth’s gravity field; that is, on the distribution of mass beneath the sea surface – how deep the water is and on varying density of rocks that lie beneath the sea floor. Water having a low density, the deeper it is the lower the overall gravitational attraction, and vice versa. Consequently, seawater is attracted towards shallower areas, standing high over, say, a seamount and low over the abyssal plains and trenches. Measuring sea-surface elevation defines the true shape that Earth would take if the entire surface was covered by water – the geoid – and is both a key to variations in gravity over the oceans and to bathymetry.
Radar altimeters can measure the average height of the sea surface to within a couple of centimetres: the roughness and tidal fluctuations are ‘ironed out’ by measurements every couple of weeks as the satellite passes on a regular orbital schedule. There is absolutely no way this systematic and highly accurate approach could be achieved by ship-borne bathymetric or gravity measurements, although such surveys help check the results from radar altimetry over widely spaced transects. Even after 40 years of accurate mapping with hundreds of ship-borne echo sounders 50% of the ocean floor is more than 10 km from such a depth measurement (80% lacks depth soundings)
This approach has been used since the first radar altimeter was placed in orbit on Seasat, launched in 1978, which revolutionised bathymetry and the details of plate tectonic features on the ocean floor. Since then, improvements in measurements of sea-surface elevation and the computer processing needed to extract the information from complex radar data have show more detail. The latest refinement stems from two satellites, NASA’s Jason-1(2001) and the European Space Agency’s Cryosat-2 (2010) (Sandwell, D.T. et al. 2014. New global marine gravity model from CryoSat-2 and Jason-1 reveals buried tectonic structure. Science, v. 346. p. 65-67; see also Hwang, C & Chang, E.T.Y. 2014. Seafloor secrets revealed. Science, v. 346. p. 32-33). If you have Google Earth you can view the marine gravity data by clicking here. The maps throw light on previously unknown tectonic features beneath the China Sea (large faults buried by sediments), the Gulf of Mexico (an extinct spreading centre) and the South Atlantic (a major propagating rift) as well as thousands of seamounts.
Global gravity over the oceans derived from Jason-1 and Cryosat-2 radar altimetry (credit: Scripps Institution of Oceanography)
There are many ways of processing the data, and so years of fruitful interpretation lie ahead of oceanographers and tectonicians, with more data likely from other suitably equipped satellites: sea-surface height studies are also essential in mapping changing surface currents, variations in water density and salinity, sea-ice thickness, eddies, superswells and changes due to processes linked to El Niño.
The first generally recognised piece of artwork is abstract in the extreme: a worked piece of hematite with a complex linear pattern etched into it. It comes from Blombos Cave in South Africa, together with similarly engraved bone, shell ornaments and advances in stone tool kits.
Artifacts from Blombos Cave, South Africa (credit: Wikipedia; copyright held by Chris Henshilwood)
Dated at 100 ka, the Blombos culture is regarded by many palaeoanthropologists as the start of the ‘First Human Revolution’. Yet most believe that such a massive cultural shift only properly manifested itself around 40 ka in Europe shortly after its colonisation by anatomically modern humans. It was then that lifelike pictures of animals began to appear on the walls of caves, such as those discovered in Chauvet Cave in France and radiocarbon dated to between 35.5 to 38.8 ka.
Drawing of horses in the Chauvet cave. (credit: Wikipedia)
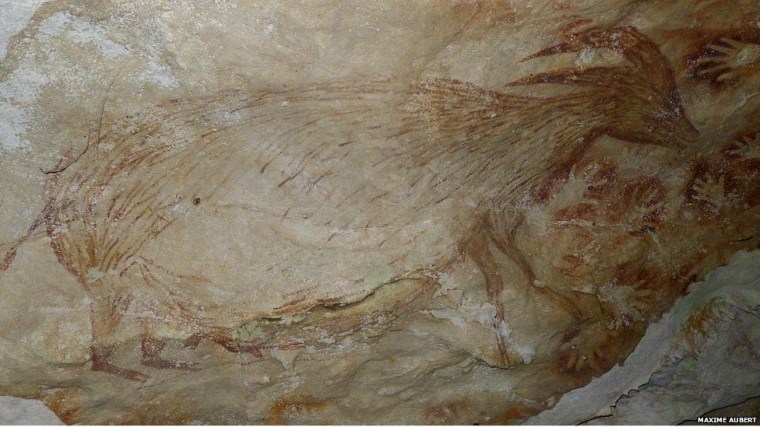
Such a Eurocentric view is based on the lack of evidence for precedent art of this kind from elsewhere. The adage that 'absence of evidence is not evidence of absence' - attributed to Carl Sagan - recently popped up with sophisticated dating of cave art in the Indonesian island of Sulawesi. The cave-riddled limestones of southern Sulawesi have long been known for artwork on the roofs of caves and in some of their darker recesses, including sketches of local animals, humans and a great many stencils made by blowing a spray of pigment over a hand placed on a rock face. The pictures were thought to be relatively recent. Painting of a dwarf water buffalo and stencils of human hands from a cave in SW Sulawesi (credit: Maxim Aubert, Griffith University, Australia)
A joint Australian-Indonesian group of Archaeologists used a specialist technique to date them (Aubert, M. and 9 others 2014. Pleistocene cave art from Sulawesi, Indonesia. Nature, v. 514, p. 223-227. See also Roebroeks, W. 2014. Art on the move. Nature (News & Views), v. 514, p. 170-171). Like many paintings in limestone caves, with time they become coated with calcite film deposited from water flowing over the rock surface, known as flowstone or speleothem. It is possible to date the film layers using the uranium-series method to derive a maximum age for the encased pigment from speleothem beneath it and a minimum age from the layer immediately overlaying it. One of the hand stencils proved to be the oldest found anywhere, with a minimum age of 39.9 ka, while sketches of animals ranged from 35.4 to 35.7 ka. To see more images and view an interactive video about the Sulawesi finds click here.
The discovery by Maxime Auberts and his colleagues has set the cat among the pigeons as regards the origin of visual art. The paintings’ roughly coincident age with the earliest in Europe raises three possibilities: the artistic muse struck simultaneously with people widely separated since their ancestors’ emergence from Africa; somehow the skills were quickly carried a third of the way around the world from one place to the other; the original migrants from Africa took artistic ability of this kind with them to Eurasia, perhaps as early as 125 ka ago.
Three points need to be considered: whether in Europe or eastern Indonesia, cave art is preserved either on the roofs or in the deep recesses of caves, where it is more likely to survive then in more exposed sites; preservation by speleothem enhances longevity and the oldest works are in limestone caves; many more archaeologists have researched caves in Europe than in the far larger areas of Asia and Africa. A view worth considering is that art may have begun outdoors, in a well-lit site on whatever ‘canvas’ presented itself. The artists’ choice of cave walls in Europe and Indonesia may have resulted from the need for shelter from rain and/or cold, whereas much of Africa and Australia poses little need for ‘interior design’. Besides, what if art began on the most easily available canvas of all – human skin! My guess is that the record will widen in space and deepen in time.
Large features on the near side of the Moon give us the illusion of the Man-in-the-Moon gazing down benevolently once a month. The lightest parts are the ancient lunar highlands made from feldspar-rich anorthosite, hence their high albedo. The dark components, originally thought to be seas or maria, are now known to be large areas of flood basalt formed about half a billion years after the Moon’s origin. Some show signs of a circular structure and have been assigned to the magmatic aftermath of truly gigantic impacts during the 4.1-3.8 Ga Late Heavy Bombardment. The largest mare feature, with a diameter of 3200 km, is Oceanus Procellarum, which has a more irregular shape, though it envelopes some smaller maria with partially circular outlines.
Full Moon viewed from Earth. Oceanus Procellarum is the large, irregular dark feature at left. (credit: Wikipedia)
A key line of investigation to improve knowledge of the lunar maria is the structure of the Moon’s gravitational field above them. Obviously, this can only be achieved by an orbiting experiment, and in early 2012 NASA launched one to provide detailed gravitational information: the Gravity Recovery and Interior Laboratory (GRAIL) whose early results were summarised by EPN in December 2012. GRAIL used two satellites orbiting in a tandem configuration similar to the US-German Gravity Recovery and Climate Experiment (GRACE) launched in 2002 to measure variations over time in the Earth’s gravity field. The Grail orbiters flew in a low orbit and eventually crashed into the Moon in December 2012, after producing lots of data whose processing continues.
The latest finding from GRAIL concerns the gravity structure of the Procellarum region (Andrews-Hanna, J.C. and 13 others 2014. Structure and evolution of the lunar Procellarum region as revealed by GRAIL gravity data. Nature, v. 514, p. 68-71) have yielded a major surprise. Instead of a system of anomalies combining circular arcs, as might be expected from a product of major impacts, the basaltic basin has a border made up of many linear segments that define an unusually angular structure.
The topography and gravity structure of the Moon. Oceanus Procellarum is roughly at the centre. Note: the images cover both near- and far side of the Moon. (credit: Andrews-Hanna et al 2014)
The features only become apparent from the gravity data after they have been converted to the first derivative of the Bouguer anomaly (its gradient). Interpreting the features has to explain the angularity, which looks far more like an outcome of tectonics than bombardments. The features have been explained as rift structures through which basaltic magma oozed to the surface, perhaps feeding the vast outpourings of mare basalts, unusually rich in potassium (K), rare-earth elements (REE) and phosphorus (P) know as KREEP basalts. The Procellarum polygonal structure encompasses those parts of the lunar surface that are richest in the radioactive isotopes of potassium, thorium and uranium (measured from orbit by a gamma-ray spectrometer) – thorium concentration is shown in the figure.
Tectonics there may be on the Moon, but the authors are not suggesting plate tectonics but rather structures formed as a huge mass of radioactively heated lunar lithosphere cooled down at a faster rate than the rest of the outer Moon. Nor are they casting doubt on the Late Heavy Bombardment, for there is no escaping the presence of both topographic and gravity-defined circular features, just that the biggest expanse of basaltic surface on the Moon may have erupted for other reasons than a huge impact.
A friend recently moved to the Napa Valley in California, almost certainly motivated by the vast area given over to the grape and the quality of Napa wines. Shortly after the flit, in the middle of some minor refurbishment, he had quite a shock; a Magnitude 6.0 earthquake at 3:20 a.m. local time on 24 August, the worst in northern California for 25 years. My friend lives only 15 km from the epicentre in South Napa, but his house was undamaged. His confidence in the move remains unshaken, however, as there was no effect on this year’s grape harvest.
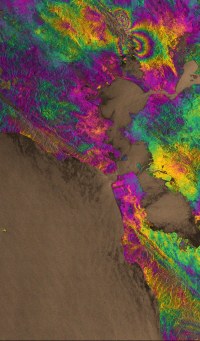
The event was monitored by the European Space Agency’s Sentinel-1A high-resolution radar satellite that entered orbit in April 2014. Sentinel revisits any area on the ground every 12 days, has all-weather/day-night imaging capacity, a 250 km-wide image swath with 10 m spatial resolution and is designed to analyse ground movements using interferometry between radar data before and after events. Interferometric radar imaging or InSAR relies on changes in the phase of radar waves between two dates of ‘illumination’ of the ground – radar images normally use only the amplitude of a radar wave, ignoring its phase – and potentially can measure shifts in ground elevation of the order of centimetres.
Interferometric Sentinel-1A radar image of the area around San Francisco showing the ground movement for the period before and after the Napa Valley earthquake (NE corner) of 24 August 2014 (credit: ESA)
The image records ground movement in small steps of elevation that are assigned colours, the sequence blue-green-yellow-red-magenta spans a ground shift of about 3 cm. If several of these ‘fringes’ are closely spaced over relatively small areas this is due to significant motions locally. Broad areas with little change in colour have barely moved in the period between the dates of the two images.
The epicentre of the South Napa earthquake clearly shows up at the NE corner of the image, like half a ‘bull’s eye’. A closer look at the enlarged image (click on the image) shows two such features sharply bounded to the west by a line: that coincides with the West Napa Fault.
My friend lives to the west of the faults where the broad areas of colour signify much smaller motions than in the main affected area. He woke and left the building thinking this was a foreshock of a much more destructive event, and had an anxious few days. The United States Geological Survey estimated that during the main ‘quake 15,000 people experienced severe shaking, 106,000 people felt very strong shaking, 176,000 felt strong shaking, and 738,000 felt moderate shaking. But there was only one fatality and 13 hospitalised casualties.
This month’s stunning image from Earth Science Picture of the Day, taken on 8 September this year is of Iceland’s biggest fissure eruption (video clip) since 1875, in the Holuhraun lava field, which began on 31 August this year. The flow is about to meet the Jokulsa a Fjollum, a large river flowing from Iceland’s largest ice cap Vatnajokull. At the time of writing (29 September) lava is flowing along the river bed at around 1 km each day. So far, the flow has spread over 44 square kilometres, and risks blocking the Jokulsa a Fjollum where it flows through a narrow channel bounded by older lava flows. If that happens the river will form a substantial lake until it is able to flow over and erode the bedrock, and will also leave one of the country’s spectacular waterfalls (Sellfoss) dry.
Aerial View of Jökulsá á Fjöllum, Iceland, downstream of Holuhraun (credit: Wikipedia)
The fissure is connected to the large Bárðarbunga stratovolcano that lies beneath Vatnajokull, which is currently showing signs of subsidence, at about 40 cm each day, and seismicity. There are concerns that this activity may presage an eruption there which may melt large volumes of ice and perhaps release a flood or jökulhlaup from beneath the icecap. Such a flood would likely follow the course of the Jokulsa a Fjollum river.
It is barely credible that only two decades ago geoscientists who argued that extraterrestrial impacts had once had an important role in Earth history met with scorn from many of their peers; slightly mad, even bad and perhaps dangerous to know. Yet clear evidence for impacts has grown steadily, especially in the time before 2.5 billion years ago known as the Archaean (see EPN for March 2003 , April 2005, July 2012 , May 2014). Even in the 1990s, when it should have been clear from the golden years of lunar exploration that our neighbour had been battered at the outset of the Archaean, claims for terrestrial evidence of the tail-end of that cataclysmic event were eyed askance. Now, one of the pioneer researchers into the oldest terrestrial impacts, Don Lowe of Stanford University, California has, with two colleagues, reported finds of yet more impact-related spherule beds from the famous Archaean repository of the Barberton Mountains in South Africa (Lowe, D.R. et al. 2014. Recently discovered 3.42-3.23 Ga impact layers, Barberton Belt, South Africa: 3.8 Ga detrital zircons, Archaean impact history and tectonic implications. Geology, v. 42, p. 747-750).
Barberton greenstone belt, South Africa (credit: Barberton World Heritage Site)
Like four other such layers at Barberton, those newly described contain several types of spherules, degraded to microcrystalline alteration products of the original glasses. Some of them contain clear evidence of originally molten droplets having welded together on deposition. Their contrasted geochemistry reveals target rocks ranging in composition from well-sorted quartz sands to intermediate, mafic and ultramafic igneous rocks. Some beds are overlain by chaotic deposits familiar from more recent times as products of tsunamis, with signs that the spherules themselves had been picked up and transported.
Dated by their stratigraphic relations to local felsic igneous rocks, the spherule beds arrived in pulses over a period of about 240 Ma between 3.42 to 3.23 Ga. Even more interesting, the overlying tsunami beds have yielded transported zircons that extend back to 3.8 Ga spanning the Archaean history of the Kaapvaal craton of which the Barberton greenstone belt rests and indeed that of many Eoarchaean cratons; the Earth’s oldest tangible continental crust. The zircons may reflect the depth to which the impacts penetrated, possibly the base of the continental crust. It isn’t easy to judge the size of the responsible impactors from the available evidence, but Lowe and colleagues suggest that they were much larger than that which closed the Mesozoic at the Cretaceous-Palaeogene boundary; perhaps of the order of 20-70 km across. So, although the late, heavy bombardment of the Moon seems to have closed at around 3.8 Ga, from evidence yielded by the Apollo programme, until at least half a billion years later large objects continued to hit the Earth more often than expected from the lunar record. Lowe has suggested that this tail-end of major bombardment on Earth may eventually have triggered the onset of plate tectonics as we know it now.
Aside from a swift but highly unlikely abandonment of fossil fuels, reduction of greenhouse warming depends to a large extent, possibly entirely, on somehow removing CO2 from the atmosphere. Currently the most researched approach is simply pumping emissions into underground storage in gas permeable rock, but an important target is incorporating anthropogenic carbon in carbonate minerals through chemical interaction with potentially reactive rocks. In a sense this is a quest to exploit equilibria involving carbon compounds that dominate natural chemical weathering and to sequester CO2 in solid, stable minerals.
The two most likely minerals to participate readily in weathering that involves CO2 dissolved in water are plagioclase feldspar, a calcium-rich aluminosilicate and olivine, a magnesium silicate. Both are abundant in mafic and ultramafic rocks, such as basalt and peridotite, which themselves are among the most common rocks exposed at the Earth’s surface. The two minerals, being anhydrous, are especially prone to weathering reactions involving acid waters that contain hydrogen ions, and in the presence of CO2 they yield stable carbonates of calcium and magnesium respectively. Despite lots of exposed basalts and ultramafic rocks, clearly such natural sequestration is incapable of absorbing emissions as fast as they are produced.
One means of speeding up weathering is to grind up plagioclase- and olivine-bearing rocks and spread the resulting gravel over large areas; as particles become smaller their surface area exposed to weathering increases. Yet it doesn’t take much pondering to realise that a great deal of energy would be needed to produce sufficient Ca- and Mg-rich gravel to take up the approximately 10 billion tonnes of CO2 being released each year by burning fossil fuels: though quick by geological standards the reaction rates involved are painfully slow in the sense of what the climatic future threatens to do. So is there any way in which these reactions might be speeded up?
Two biological agencies are known to accelerate chemical weathering, or are suspected to do so: plant roots and animals that live in soil. Ronald Dorn of Arizona State University set out to investigate the extent to which such agencies do sequester carbon dioxide, under the semi-arid conditions that prevail in Arizona and Texas (Dorn, R.I. 2014. Ants as a powerful biotic agent of olivine and plagioclase dissolution. Geology, v. 42, p. 771-774). His was such a simple experiment that it is a wonder it had not been conducted long ago; but it actually took more than half his working life. Spaced over a range of topographic elevations, Dorn used an augur at each site to drill five half-metre holes into the root mats of native trees, established ant and termite colonies and bare soil surfaces free of vegetation or animal colonies, filling each with sand-sized crushed basalt.
Film poster for Empire of the Ants (starring Joan Collins) (credit: Wikipedia)
Every five years thereafter he extracted the basalt sand from one of the holes at each site and each soil environment. To assess how much dissolution had occurred he checked for changes in porosity, and heated the samples to temperatures where carbonates break down to discover how much carbonate had been deposited. That way he was able to assess the cumulative changes over a 25 year period relative to the bare-ground control sites. The results are startling: root mats achieved 11 to 49 times more dissolution than the control; termites somewhat less, at 10 to 19 times; while ants achieved 53 to 177 times more dissolution. While it was certain that the samples had been continuously exposed to root mats throughout, the degree of exposure to termites and ants is unknown, so the animal enhancements of dissolution are probably minima.
Microscopic examination of mineral grains exposed to ant activity shows clear signs of surface pitting and other kinds of decay. Chemically, the samples showed that exposure to ants consistently increased levels of carbonate in the crushed basalt sand compared with controls, with levels rising by 2 to 4% by mass, with some variation according to ant species. Clearly, there is some scope for a role for ants in carbon sequestration and storage; after all, there are estimated to be around 1013 to 1016 individual ants living in the world’s soils. In the humid tropics the total mass of ants may be up to 4 times greater than all mammals, reptiles and amphibians combined. There is more to learn, but probably a mix of acid secretions and bioturbation by ants and termites is involved in their dramatic effect on weathering. One interesting speculation is that ants may even have played a role in global cooling through the Cenozoic, having evolved around 100 Ma ago.
The Arabian Peninsula from the SeaWIFS satellite (credit: Wikipedia)
From time to time between 130 and 75 ka fully modern humans entered the Levant from Africa, which is backed up by actual fossils. But up to about 2010 most palaeoanthropologists believed that they moved no further, because of the growth of surrounding deserts, and probably did not return to the Middle East until around 45 ka. The consensus for the decisive move out of Africa to Eurasia centred on crossings of the Straits of Bab el Mandab at the entrance to the Red Sea, when sea level fell to a level that would have allowed a crossing by rafting over narrow seaways. The most likely time for such n excursion was during a brief cool/dry episode around 67 ka that coincided with an 80 m fall in global sea level: the largest since the previous glacial maximum (see Evidence for early journeys from Africa to Asia).
In 2011 finds reported from the United Arab Emirates of ‘East African-looking’ Middle Palaeolithic tools in sediment layers dated at 125, 95 and 40 ka led some to speculate that there must have been an eastward move from the Levant by anatomically modern humans (see Human migration – latest news). That view stemmed from the fact that the earliest date was during the last interglacial when sea level would have been as high as it is today, and around 95 ka it would have been little different. That report coincided with others about freshwater springs having emanated from uplifted reefs around the edges of the Arabian Peninsula during the last interglacial, and the existence of substantial lakes deep within the subcontinent around that time (see Water sources and early migration from Africa). Substantial funding followed such exciting news and results of new research are just beginning to emerge (Lawler, A. 2014. In search of Green Arabia. Science, v. 345, p. 994-999).
Al Ain, a rare spring-fed oasis in the eastern Rub al Khali near the UAE-Oman border (credit: Wikipedia)
A team led by Michael Petraglia of the University of Oxford has used field surveys and remote sensing to reveal a great many, now-vanished lakes across the Arabian Peninsula, including many in the fearsome Rub al Khali or Empty Quarter. They are linked by an extensive, partly sand-hidden network of palaeochannels, which include several of the major wadis; a system that once drained towards the Persian Gulf. As well as abundant freshwater molluscs and other invertebrates, former lakeshore sediments are littered with huge numbers of stone tools, also with East African affinities (Scerri, E.M.L. et al. 2014. Unexpected technological heterogeneity in northern Arabia indicates complex Late Pleistocene demography at the gateway to Asia. Journal of Human Evolution, In Press http://dx.doi.org/10.1016/j.jhevol.2014.07.002). Using optically stimulated luminescence dating, which shows how long stone objects have been buried, the British team has found tools dating back as long as 211 ka, with a cluster of dates between 90 to 74 ka. Modern humans, Neanderthals and even Denisovans may have made these tools; only associated fossil remains will tell. Yet it is already clear that for lengthy periods – perhaps of a few hundred or thousand years – the hyper-arid interior of Arabia was decidedly habitable. It may have been a thriving outpost of emigrants from Africa, whose abandonment as climate shifted to extreme dryness as the last interglacial gave way to Ice Age conditions, could well have been the source of the great migration that colonised the rest of the habitable world. Petraglia’s team has already courted controversy with their claim for anatomically modern humans’ tools in South Indian volcanic ash beds that date to the Toba eruption around 74 ka: considerably earlier than the more widely accepted post-65 ka dates of human eastward migration.
Having belatedly discovered The Earth Science Picture of the Day website (it has been going since September 2000; as long as Earth Pages!) I thought readers of EPN might like the aesthetic boost that it provides. So, on the last day of the month I intend to insert a link to what I think is the best of those contributed to EPOD over the previous 4 weeks or so.