We have become accustomed to thinking that up to 90% of organisms were snuffed out by the catastrophe at the Permian-Triassic boundary 252 Ma ago. Those are the figures for marine organisms, whose record in sediments is the most complete. It has also been estimated to have lasted a mere 60 ka, and the recovery in the Early Triassic to have taken as long as 10 Ma. There are hints of three separate pulses of extinction related to: initial gas emission from the Siberian Traps; coal fires; and release of methane from sea-floor gas hydrates at the peak of global warming. Various terrestrial sequences record the collapse of dense woodlands, so that the Early Triassic is devoid of coals that are widespread in the preceding Late Permian. A new detailed study of terrestrial sediments in the Sydney Basin of eastern Australia reveals something new (Fielding, C.R. and 10 others 2019. Age and pattern of the southern high-latitude continental end-Permian extinction constrained by multiproxy analysis. Nature Communications, v. 10, online publications: DOI: 10.1038/s41467-018-07934-z).
The distinctive, tongue-like form of Glossopteris leaves that dominate the coal-bearing Permian strata of the southern coninents. Their occurrence in South America, Africa, India, Australia, New Zealand, and Antarctica prompted Alfred Wegener to suggest that these modern continents had been united in Pangaea by Permian times: a key to continental drift. (Credit: Getty Images)
Christopher Fielding or the University of Nebraska-Lincoln and colleagues focused on pollens, geochemistry and detailed dating of the sedimentary succession across the P-Tr boundary exposed on the New South Wales coast. The stratigraphy is intricately documented by a 1 km deep well core that penetrates a more or less unbroken fluviatile and deltaic sequence that contains eleven beds of volcanic ash. The igneous layers are key to calibrating age throughout the sequence (259.10 ± 0.17 to 247.87 ± 0.11 Ma using zircon U-Pb methods). The pollens change abruptly from those of a Permian flora, dominated by tongue-like glossopterid plants, to a different association that includes conifers. The change coincides with a geochemical ‘spike’ in the abundance of nickel and a brief change in the degree of alteration of detrital fledspars to clay minerals. The first implicates the delivery of massive amounts of nickel to the atmosphere, probably by the eruption of the Siberian Traps , which contain major economic nickel deposits. The second feature suggests a brief period of warmer and more humid climatic conditions. A third geochemical change is the onset of oscillations in the abundance of 13C that are thought to record major changes in plant life across the planet. These features would have been an easily predicted association with the 252 Ma mass extinction were it not for the fact that the radiometric dating places them about 400 thousand years before the well-known changes in global animal life. Detailed dating of the Siberian Traps links the collapse of Glossopteris and coal formation to the earliest extrusion of flood basalts, which suggests that the animal extinctions were driven by cumulative effects of the later outpourings
More than 50 years ago a group of schoolchildren discovered a fronded fossil (Charnia) in the Precambrian rocks of Charnwood Forest in the English Midlands. Since then it has been clear that multicellular life originated before the Cambrian Period, when the first tangible life had previously been considered to have emerged. Discovery of the rich Ediacaran fauna of quilted, baglike and disc-like animals in 635 Ma old Neoproterozoic sediments in South Australia, and many other occurrences re-established the start of the ‘carnival of animals’ in the Ediacaran Period (635 to 541 Ma). It happened to follow the climatic and environmental turmoil of at least two Snowball Earth episodes during the preceding Cryogenian Period (850 to 635 Ma), which has led to a flurry of suggestions for the transition from protozoan to metazoan life. Yet, applying a ‘molecular-clock’ approach to the genetic differences between living metazoan organisms seems to suggest a considerable earlier evolutionary event that started ‘life as we know it’. That may have been confirmed by a discovery in much older sediments in Gabon, West Africa.
A sequence of shallow-marine sediments in the Francevillian Series in Gabon was laid down at a time of fluctuating sea level around 2100 Ma ago, when the upper oceans had become oxygenated. In them are black shales that preserve an abundance of intricate sedimentary features. Among them are curious stringy structures rich in crystalline pyrite (Fe2S). They are infilled wiggly tubes that lie in the shale bedding. CT scans reveal that the bedding has been flattened around the tubules as it became lithified. So the tubes formed while the sediment was wet and soft (El Albani, A. and 22 others 2019. Organism motility in an oxygenated shallow-marine environment 2.1 billion years ago. Proceedings of the National Academy of Sciences, online preprint; DOI: 10.1073/pnas.1815721116). They look very like burrows. Up to 5 mm across, they can be considered large by comparison with almost all organisms known from that time. The exception comes from the same stratigraphic Series in Gabon. In 2010, El Albani and colleagues published an account of fossils preserved by pyrite that look like fried eggs, 1 to 2 cm across, with scalloped edges. Internal structures revealed by CT scanning include radial slits in the ‘whites’ and folding within the central ‘yolk’. That paper reported the geochemical presence in the host shales of steranes, which are breakdown products of steroids that are unique to eukaryotes. Could these organisms and the wiggly tube-like trace fossils indicate the presence of the earliest metazoans in the Francevillian Series?
Palaeoproterozoic fossils from the Francevillian Series in Gabon. Top: greytone photographs of burrow-like trace fossils (Credit: El Albani et al. 2019; Fig.1). Bottom: colour photograph and 3 CT scans of discoidal fossil (Credit: El Albani et al. 2010; Fig. 4).
Until the discoveries in Gabon, the oldest organic structure that had been suggested to be a metazoan was the rare Grypania, a spiral, strap-like fossil found in a variety of strata ranging in age from 1870 to 650 Ma. Being made of a structureless ribbon of graphite, Grypania seems most likely to have been made by colonial bacteria. The two Gabon life forms cannot be disposed of quite so easily. The discoids have organised structures rivalling those in Ediacaran animals, while the wiggly tubes clearly seem to indicate something capable of movement. In both cases preservation is by iron sulfide, which suggests the presence at some stage of chemo-autotrophic bacteria that reduce sulfate ions to sulfide. Could these not have formed mats taking up irregular discs and plates? The burrows may have been formed by unicellular eukaryotes, one type of which – the slime moulds – is capable of aggregating together to form multi-celled reproductive structures as well as living freely as single amoeba. Some form slug-like masses that are capable of movement; not metazoans, but perhaps their precursors.
Denisova Cave was named to commemorate an 18th century hermit called Denis, who used it as his refuge. The culmination of more than four decades of excavation, which followed the discovery there of Mousterian and Levallois tools there, has been the explosion onto the palaeoanthropological scene of Denisovan genomics, beginning in 2010 with sequenced DNA from a child’s finger bone. The same layer yielded Neanderthal DNA from a toe bone in 2013. Another layer yielded similar evidence in 2018 of an individual who had a Neanderthal father and a Denisovan mother. Application of the new technique of peptide mass fingerprinting, or zooarchaeology by mass spectrometry (ZooMS), to small, unidentifiable bone fragments from the cave sediments revealed further signs of Denisovan occupation and the first trace of anatomically modern humans (AMH). So far the tally is 4 Denisovans (two female children and two adult males), a Neanderthal woman and the astonishing hybrid. Analyses of the sediments themselves showed traces of both Neanderthal and Denisovan mtDNA from deeper in the stratigraphy than levels in which human fossils had been found, but which contained artefacts. The discovery of the first Denisovan DNA revealed that AMH migrants from Africa who reached the West Pacific islands about 65 ka ago carried fragments of that genome. As well as hybridising with Neanderthals some of the people who left Africa had interbred with Denisovans sufficiently often for genetic traces to have survived. Yet, until now, the ages of the analysed samples from the cave remained unknown.
That is no surprise for two reasons: cave sediments are complex, having been reworked over millennia to scramble their true stratigraphy; most of the organic remains defied 14C dating, being older than its maximum limit of determination. However, using alternative approaches has resulted in two papers in the latest issue of Nature. The first reports results from two methods that rely on the luminescence of grains of quartz and feldspar when stimulated, which measures the time since they were last exposed to light (Jacobs, Z. and 10 others 2019. Timing of archaic hominin occupation of Denisova Cave in southern Siberia. Nature, v. 565, p. 594-599; DOI: 0.1038/s41586-018-0843-2). Over 280 thousand grains in 103 sediment samples from different depths and various parts of the cave system have yielded a range of ages from 300 to 20 ka that span 3 glacial-interglacial cycles except for a few gaps, giving rough estimates of the timing of hominin occupation shown by fossils and soil layers that contain DNA. The youngest evidence for Denisovans is shown to be roughly 50 ka; a time when AMH was present elsewhere in Siberia. They lived at a time halfway between the 130 ka interglacial and the last glacial maximum. Two Neanderthals, a Denisovan and the hybrid occupied the site during the 130 ka interglacial. Soils from the previous warm episode from 250 to 200 ka contain both Neanderthal and Denisovan DNA traces. The oldest occupancy, marked by the presence of a Denisovan bone sample, was 300 ka ago, once again midway between an interglacial and a glacial maximum.
All the hominin remains found in Denisova Cave: Note the common scale. (Credit: Douka et al. 2019; extended data Figure 1)
The second paper (Douka, K. and 21 others 2019. Age estimates for hominin fossils and the onset of the Upper Palaeolithic at Denisova Cave. Nature, v. 565, p. 640–644; DOI: 10.1038/s41586-018-0870-z) focused on direct dating of the hominin fossils themselves – and thus their DNA content, important in trying to piece together timings of genetic mixing. In the absence of radiocarbon dates from the bones themselves because of most specimens’ >50 ka ages, except in the case of the youngest whose 14C age is at the 50 ka limit. They resorted to a hybrid technique based on a means of modelling fossils’ ages from differences in mtDNA between the specimens and that in the youngest hominin, which, luckily, was dateable by radiocarbon means. Weighted by dating of the actual sediments that contain them, the differences should become greater for successively older fossils because of random mutations: a variant of the ‘molecular clock’ approach. It’s complicated and depends on assuming that mitochondrial mutation rate was the same as that in modern humans. Unsurprisingly the results are imprecise, but sufficient to match the hominin fossil occurrences with different environmental conditions
Pollen grains and vertebrate fossils from various levels in the cave system demonstrate the wide climatic and ecological conditions in which the various hominins lived. The warmest episodes supported broad-leafed forest, offering maximum resources for hominin survival. Those between interglacial and full glacial conditions were much less benign, with alternating dry and wet cold conditions that supported open steppe ecosystems. The oldest Denisovan occupation was at the close of a period of moderately warm and humid conditions that supported mixed conifer and broad-leafed trees that gave way to reduced tree cover.
As well as the presence of stone tools sporadically through the sedimentary sequence, in the youngest levels there are bone rings and pendants made from deer teeth; clearly ornamental items. Did the late Denisovans make them or do they signify anatomically modern human activity? Radiocarbon ages do not give a concrete answer, one of the pendants is about 45 ka old with an error that puts it just within the range of age variation of the oldest Denisovan fossil. No AMH remains have been found in Denisova Cave, but remains of a modern human male have been found at Ust’-Ishim, in NW Siberia. At 45 ka, he represents the earliest arrival of AMH in northern Asia. So it may have been members of this new population that left ornaments in Denisova, but, for the moment, artistic Denisovans are a possibility.
Further deployment of rapid screening for hominin bone fragments using the ZooMS method and analyses for traces of DNA in soils is likely to expand the geographic and time ranges of Denisovans and other close human relatives. Denisova Cave formed in Silurian limestones of the Altai Range, and there are other caves in those hills …
Related article: Dennel, R. 2019. Dating of hominin discoveries at Denisova. Nature, v. 565, p. 571-572; DOI: 10.1038/d41586-019-00264-0)
Massive open online courses (MOOCs for short) first mooted in 2006, surfaced with something of a pop in 2012. Intended to be open to all with Internet access, they promised a renaissance of higher education with the ’best’ professors, educational technologies and materials, flexibility, innovative assessment and accreditation (if chosen), no entry requirements, and very low cost at a time of relentlessly rising fees for conventional study. And they did not require attendance, although certificates of successful completion may be a currency for acceptance in conventional HE. They could be about literally anything at a variety of levels and involving a range of study times. By the end of 2016 MOOC programs had been set up by more than 700 universities worldwide, and around 58 million students had signed up to one of more courses. The general business model is described as ‘freemium’; i.e. a pricing strategy whereby a product or service is provided free of charge, with a premium charged for certification. There are innumerable variants of this model. The top providers are mainly consortia linking several universities and other academic and cultural entities. Futurelearn, although wholly owned by the formerly world-leading distance-learning distributor the British Open University, has 157 partners in Britain and globally. Its venture into the field involved its investing several tens of million UK pounds at start-up, which some believe was the source of its current financial difficulties.
The 11 January issue of Science published a brief account of the fortunes of a range of MOOC providers (Reich, J. & Ruipérez, J.A. 2019. The MOOC pivot. Science, v. 363, p. 130-131; DOI: 10.1126/science.aav7958) using data from edX that links Harvard University and MIT. The vast majority of learners who chose MOOCs never return after their first year. Growth in the market is concentrated almost entirely in affluent countries, whereas the model might seem tailor-made, and indeed vital, for less fortunate parts of the world. Completion rates are very low indeed, largely as a result of poor retention: since 2012 drop-out rates in the first year are greater than 80%. In the data used in the study both enrollments and certifications from 2012 to last year rose to peaks in the first three years (to 1.7 million and 50 thousand respectively) then fell sharply in the last two years (to <1 million and <20 thousand, respectively). Whatever the ‘mission’ of the providers – was it altruistic or seeking a revenue stream? – the MOOC experience seems to be falling by the wayside. Perhaps many students took MOOCs for self-enlightenment rather than for a credential, as their defenders maintain. Well, the figures suggest that few saw fit to continue the experience. Surely, if knowledge was passed on at a level commensurate with participants requirements in a manner that enthused them, a great many would have signed up for ‘more of the same’: clearly that didn’t happen.
The authors conclude with, ‘Dramatic expansion of educational opportunities to underserved populations will require political movements that change the focus, funding, and purpose of higher education; they will not be achieved through new technologies alone.’
The nickel in stainless steel, the platinum in catalytic converters and the gold in jewellery, electronic circuits and Fort Knox should all be much harder to find in the Earth’s crust. Had the early Earth formed only by accretion and then the massive chemical resetting mechanism of the collision that produced the Moon all three would lie far beyond reach. Both formation events would have led to an extremely hot young Earth; indeed the second is believed to have left the outer Earth and Moon completely molten. All three are siderophile metals and have such a strong affinity for metallic iron that they would mostly have been dragged down to each body’s core as it formed in the early few hundred million years of the Earth-Moon system, leaving very much less in the mantle than rock analyses show. This emerged as a central theme at the Origin of Life Conference held in Atlanta GA, USA in October 2018. The idea stemmed from two papers published in 2015 that reported excessive amounts in basaltic material from both Earth and Moon of a tungsten isotope (182W) that forms when a radioactive isotope of hafnium (182Hf), another strongly siderophile metal, decays. Hafnium too must have been strongly depleted in the outer parts of both bodies when their cores formed. The excesses are explained by substantial accretion of material rich in metallic iron to their outer layers shortly after Moon-formation, some being in large metallic asteroids able to penetrate to hundreds of kilometres. Hot iron is capable of removing oxygen from water vapour and other gases containing oxygen, thereby being oxidised. The counterpart would have been the release of massive amounts of hydrogen, carbon and other elements that form gases when combined with oxygen. The Earth’s atmosphere would have become highly reducing.
Had the atmosphere started out as an oxidising environment, as thought for many decades, it would have posed considerable difficulties for the generation at the surface of hydrocarbon compounds that are the sine qua non for the origin of life. That is why theories about abiogenesis (life formed from inorganic matter) hitherto have focussed on highly reducing environments such as deep-sea hydrothermal vents where hydrogen is produced by alteration of mantle minerals. The new idea revitalises Darwin’s original idea of life having originated in ‘a warm little pond’. How it has changed the game as regards the first step in life, the so-called ‘RNA World’ can be found in a detailed summary of the seemingly almost frenzied Origin of Life Conference (Service, R.F. 2019. Seeing the dawn. Science, v. 363, p. 116-119; DOI: 10.1126/science.363.6423.116).
Isotope geochemistry has also entered the mix in other regards, particularly that gleaned from tiny grains of the mineral zircon that survived intact from as little as 70 Ma after the Moon-forming and late-accretion events to end up (3 billion years ago) in the now famous Mount Narryer Quartzite of Western Australia. The oldest of these zircons (4.4 Ga) suggest that granitic rocks had formed the earliest vestiges of continental crust far back in the Hadean Eon: Only silica-rich magmas contain enough zirconium for zircon (ZrSiO4) to crystallise. Oxygen isotope studies of them suggest that at that very early date they had come into contact with liquid water, presumably at the Earth’s surface. That suggests that perhaps there were isolated islands of early continental materials; now vanished from the geological record. A 4.1 Ga zircon population revealed something more surprising: graphite flakes with carbon isotopes enriched in 12C that suggests the zircons may have incorporated carbon from living organisms.
A possible timeline for the origin of life during the Hadean Eon (Credit: Service, R.F. 2019, Science)
Such a suite of evidence has given organic chemists more environmental leeway to suggest a wealth of complex reactions at the Hadean surface that may have generated the early organic compounds needed as building blocks for RNA, such as aldehydes and sugars (specifically ribose that is part of both RNA and DNA), and the amino acids forming the A-C-G-U ‘letters’ of RNA, some catalysed by the now abundant siderophile metal nickel. One author seems gleefully to have resurrected Darwin’s ‘warm little pond’ by suggesting periodic exposure above sea level of abiogenic precursors to volcanic sulfur dioxide that could hasten some key reactions and create large masses of such precursors which rain would have channelled into ‘puddles and lakes’. The upshot is that the RNA World precursor to the self-replication conferred on subsequent life by DNA is speculated to have been around 4.35 Ga, 50 Ma after the Earth had cooled sufficiently to have surface water dotted with specks of continental material.
There are caveats in Robert Services summary, but the Atlanta conferences seems set to form a turning point in experimental palaeobiology studies.
Because it is so geologically active the Earth progressively erases signs of asteroid and comet impacts, by erosion, burial or even subduction in the case of the oceanic record. As a result, the number of known craters decreases with age. To judge the influence of violent extraterrestrial events in the past geologists therefore rely on secondary outcomes of such collisions, such as the occasional presence in the sedimentary record of shocked quartz grains, glassy spherules and geochemical anomalies of rare elements. The Moon, on the other hand, is so geologically sluggish that its surface preserves many of the large magnitude impacts during its history, except for those wiped out by later such events. For instance, a sizeable proportion of the lunar surface comprises its dark maria, which are flood basalts generated by gigantic impacts around 4 billion years ago. Older impacts can only be detected in its rugged, pale highland terrains, and they have been partially wiped out by later impact craters. The Moon’s surface therefore preserves the most complete record of the flux and sizes of objects that have crossed its orbit shared with the Earth.
The Earth presents a target thirteen times bigger than the cross sectional area of the Moon so it must have received 13 times more impacts in their joint history. Being about 81 times as massive as the Moon its stronger gravitational pull will have attracted yet more and all of them would have taken place at higher speeds. The lunar samples returned by the Apollo Missions have yielded varying ages for impact-glass spherules so that crater counts combined with evidence for their relative ages have been calibrated to some extent to give an idea of the bombardment history for the Earth Moon System. Until recently this was supposed to have tailed off exponentially since the Late Heavy Bombardment between 4.0 to 3.8 billion years ago. But the dating of the lunar record using radiometric ages of the small number of returned samples is inevitably extremely fuzzy. A team of planetary scientists from Canada, the US and Britain has developed a new approach to dating individual crater using image data from NASA’s Lunar Reconnaissance Orbiter (LRO) launched in 2009 (Mazrouei, S. et al. 2019. Earth and Moon impact flux increased at the end of the Paleozoic. Science, v. 363, p. 253-257; DOI: 10.1126/science.aar4058).
The method that they devised is, curiously, based on thermal imagery from the LRO’s Diviner instrument which records the Moon’s surface temperature. Comparison of day- and night-time temperatures produces a measure of surface materials’ ability to retain heat known as thermal inertia. A material with high thermal inertia stays warmer for longer at night. When a crater forms it partly fills with rock fragments excavated by the impact. When fresh these are full of large blocks of rock that were too massive to be blasted away. But these blocks are exposed to bombardment by lesser projectiles for the lifetime of the crater, which steadily reduces them to smaller fragments and eventually dust. Blocks of solid rock retain significantly more solar heat than do gravelly to dust-sized materials: thermal inertia of the crater floor therefore decreases steadily with age.
Blocky surface of a relatively young lunar crater (Credit: NASA)
As well as day- and night thermal data provided by the Diviner instrument, from which thermal inertia values are calculated, the LRO deploys two cameras that capture black and white images of the surface in the visible range, with a resolution of about a metre. They enable the blockiness of crater floors to be estimated. Sara Mazrouei and colleagues measured blockiness and thermal inertia of the floors of 111 craters more than 10 km across, ages of nine of which had been modelled independently using counts of smaller craters that subsequently accumulated on their floors shown by even finer resolution images from the Japanese Kaguya orbiter. Their results are surprising. About 290 Ma ago the rate of large impacts on the Moon increased by a factor of 2.6. This might explain why the Neoproterozoic and Palaeozoic Eras are deficient in terrestrial craters. Another inference from the results is that the number of objects in Earth-crossing orbits suddenly increased at the end of the Carboniferous. Maybe that resulted from an episode of collisions and break-up of large bodies in the Asteroid Belt or, perhaps, some kind of gravitational perturbation by Jupiter. The age-distribution of large craters on Earth is no help because of their ephemeral nature. Moreover, apart from Chicxulub that is bang on the K-Pg boundary, there is little evidence of an increase in impact-driven mass extinctions in the Mesozoic and Cenozoic. Nor for that matter did igneous activity or sediment deposition undergo any sudden changes. There are sediments that seem to have formed as a result of tsunami devastation, but none greater in magnitude than could have been caused by major earthquakes. Or … maybe geologists should have another look at the stratigraphic record.
The rift systems of Ethiopia, Kenya and Tanzania, and the limestone caverns near Johannesburg, South Africa have a long history of intensive archaeological study, rewarded by many finds of hominin skeletal remains and artifacts over the last century. Each region lays claim to be the birthplace of humans, that in South Africa being grandiloquently dubbed ‘The Cradle of Humankind’. Of course, the realistic chances of making discoveries and careers draws scientists and funds back to these regions again and again: a kind of self-fulfilling prophesy fueled by the old miners’ adage, ‘to find elephants you must go to elephant country’. The key site for the earliest stone tools was for a long time Tanzania’s Olduvai Gorge, thanks to finds of deliberately shaped choppers, hammer stones and sharp edges from about 2 Ma ago in close association with remains of Homo habilis by the Leakeys. Termed ‘Oldowan’, signs of this industry emerged from 2.6 Ma sediments in the Afar Depression of Ethiopia in 2010, but with no sign of who had made them. By 2015 the cachet of ‘first tools’ moved to Lomekwi on the shore of Lake Turkana in Kenya, dated to 3.3 Ma but again with no evidence for a maker. In fact the oldest evidence for the use of tools emerged with the 2010controversial discovery at Dikika in Afar of 3.4 Ma old bones that carry cut marks, but no sign of tools nor whoever had used them. However remains of Australopithecus afarensis occur only a few kilometers away.
Excavations outside the East African Rift System and South Africa are still few and far between, especially from before 1 Ma. The High Plateaus of eastern Algeria include one ancient site, near Ain Hanech, which yielded 1.8 Ma Oldowan stone artifacts as long ago as 1992. A nearby site at Ain Boucherit takes the North African record back to 2.4 Ma with both Oldowan tools and cut-marked bones of horse and antelope (Sahnouni, M. and 12 others 2018. 1.9-million- and 2.4-million-year-old artifacts and stone tool–cutmarked bones of from Ain Boucherit, Algeria. Science, v. 362, p. 1297-1301; DOI: 10.1126/science.aau0008). Tool makers had clearly diffused across what is now the Sahara Desert by that time. Given the distance between the Lomekwi and Dikika sites in East Africa that is hardly a surprise, provided climatic conditions were favourable. Michel Brunet’s discovery in 3.3 Ma old sediments of an australopithecine (Au. bahrelghazali) in central Chad demonstrates that early hominins were quite capable of spreading across the African continent. Yet, to wean palaeoanthropologists and their sponsors from hitherto fruitful, ‘elephant’ areas to a more ‘blue skies’ approach is likely to be difficult. There are plenty of sedimentary basins in Africa that preserve Miocene to Recent sediments that may yet turn up fossils and artifacts that take the science of human origins and peregrinations further and possibly in unexpected taxonomic directions
Pterosaurs, which include the pterodactyls and pteranodons, were the first vertebrates to achieve proper, flapping flight. In the popular imagination they are regarded as ‘flying dinosaurs’, whereas the anatomy of the two groups is significantly different. The first of them appeared in the Upper Triassic around 235 Ma ago, at roughly the same time as the earliest known dinosaurs. The anatomical differences make it difficult to decide on a common ancestry for the two. But detailed analysis of pterosaur anatomy suggests that they share enough features with dinosaurs, crocodiles and birds for all four groups to have descended from ancestral archosaurs that were living in the early Triassic, and they survived the mass extinction at the end of that Period. Birds, on the other hand, first appear in the fossil record during the Upper Jurassic 70 Ma later than pterosaurs. They are now widely regarded as descendants of early theropod dinosaurs, which are known commonly to have had fur and feathers.
Pterosaurs leapt into the public imagination in the final chapter of Sir Arthur Conan Doyle’s Lost World with a clatter of ‘dry, leathery wings’ as Professor George Challenger’s captive pterodactyl from northern Brazil’s isolated Roraima tepui plateau made its successful bid for escape from a Zoological Institute meeting in Queens Hall. Yet, far from being leathery, pterosaurs turned out, in the late 1990’s, to have carried filamentous pycnofibres akin to mammalian hair. Widespread reports in the world press during the week before Christmas in 2018 hailed a further development that may have rescued pterosaurs from Conan Doyle’s 1912 description before it sprang from its perch:
It was malicious, horrible, with two small red eyes as bright as points of burning coal. Its long, savage mouth, which it held half-open, was full of a double row of sharp-like teeth. Its shoulders were humped, and round them was draped what appeared to be a faded grey shawl. It was the devil of our childhood in person.
Two specimens from the Middle to Upper Jurassic Yanliiao lagerstätte in China show far more (Yang, Z. and 8 others 2018. Pterosaur integumentary structures with complex feather-like branching. Nature Ecology & Evolution, v. 3, p. 24-30; DOI: 10.1038/s41559-018-0728-7). Their pycnofibres show branching tufts, similar to those found in some theropods dinosaurs, including tyrannosaurs. They also resemble mammalian underfur fibres, whose air-trapping properties provide efficient thermal insulation. Both body and wings of these pterosaurs are furry, which the authors suggest may also have helped reduce drag during flight, while those around the mouth may have had a sensory function similar to those carried by some living birds. Moreover, some of the filaments contain black and red pigments.
Artist’s impression of a Jurassic anurognathid pterosaur from China (Credit: Yang et al 2018; Fig. 4)
Pterosaurs may have independently developed fur and feathers; a case of parallel evolution in response to similar evolutionary pressures facing dinosaurs, birds and mammals. Alternatively, they may have had a deep evolutionary origin in the common ancestors of all these animal groups as far back as the Upper Carboniferous and Lower Permian.
Radiocarbon dating is the most popular tool for assessing the ages of archaeological remains and producing climatic time series, as in lake- and sea-floor cores, provided that organic material can be recovered. Its precision has steadily improved, especially with the development of accelerator mass spectrometry, although it is still limited to the last 50 thousand years or so because of the short half-life of 14C (about 5,730 years,). The problem with dating based on radioactive 14C is its accuracy; i.e. does it always give a true date. This stems from the way in which 14C is produced – by cosmic rays interacting with nitrogen in the atmosphere. Cosmic irradiation varies with time and, consequently, so does the proportion of 14C in the atmosphere. It is the isotope’s proportion in atmospheric CO2 gas at any one time in the past, which is converted by photosynthesis to dateable organic materials, that determines the proportion remaining in a sample after decay through the time since the organism died and became fossilised. Various approaches have been used to allow for variations in 14C production, such as calibration to the time preserved in ancient timber by tree rings which can be independently radiocarbon dated. But that depends on timber from many different species of tree from different climatic zones, and that is affected by fractionation between the various isotopes of carbon in CO2, which varies between species of plant. But there is a better means of calibration.
The carbonate speleothem that forms stalactites and stalagmites by steady precipitation from rainwater, sometimes to produce visible layering, not only locks in 14C dissolved from the atmosphere by rainwater but also environmental radioactive isotopes of uranium and thorium. So, layers in speleothem may be dated by both methods for the period of time over which a stalagmite, for instance, has grown. This seems an ideal means of calibration, although there are snags; one being that the proportion of carbon in carbonates is dominated by that from ancient limestone that has been dissolved by slightly acid rainwater, which dilutes the amount of 14C in samples with so called ‘dead carbon’. Stalagmites in the Hulu Cave near Nanjing in China have particularly low dead-carbon fractions and have been used for the best calibrations so far, going back the current limit for radiocarbon dating of 54 ka (Cheng, H. and 14 others 2018. Atmospheric 14C/12C during the last glacial period from Hulku Cave. Science, v. 362, p. 1293-1297; DOI: 10.1126/science.aau0747). Precision steadily falls off with age because of the progressive reduction to very low amounts of 14C in the samples. Nevertheless, this study resolves fine detail not only of cosmic ray variation, but also of pulses of carbon dioxide release from the oceans which would also affect the availability of 14C for incorporation in organic materials because deep ocean water contains ‘old’ CO2.
Modern Tibetans thrive in the rarefied air at altitudes above 4 km partly because they benefit from a genetic mutation of the gene EPAS1, which regulates haemoglobin production. Surprisingly, the segment of Tibetan’s DNA that contains the mutation matches that present in the genome of an undated Denisovan girl’s finger bone found in the eponymous Siberian cave. The geneticists who made this discovery were able to estimate that Tibetans inherited the entire segment sometime in the last 40 thousand years through interbreeding with Denisovans, who probably were able to live at high altitude too. Wherever and whenever this took place the inheritance was retained because it clearly helped those who carried it to thrive in Tibet. The same segment is present in a few percent of living Han Chinese people, which suggests their ancestors and those of the Tibetans were members of the same group some 40 ka ago, most of the Han having lost the mutation subsequently.
That inheritance would have remained somewhat mysterious while the existing evidence for the colonisation of the Tibetan Plateau suggested sometime in the Holocene, possibly by migrating early farmers. A single archaeological site at 4600 m on the Plateau has changed all that (Zhang, X.L. and 15 others 2018. The earliest human occupation of the high-altitude Tibetan Plateau 40 thousand to 30 thousand years ago. Science, v. 362, p. 1049-1051; DOI: 10.1126/science.aat8824). The dig at Nwya Devu, which lies 250 km NW of Lhasa, has yielded a sequence of sediments (dated by optically stimulated luminescence at between 45 to 18 thousand years) that contains abundant stone tools made from locally occurring slate. The oldest coincides roughly with the age of the earliest anatomically modern human migrants into northern China, so the earliest Tibetans may well have been a branch of that same group of people, as suggested by the DNA of modern Tibetan and Han people. However, skeletal remains of both humans and their prey animals are yet to emerge from Nwya Devu, which leaves open the question of who they were. Anatomically modern humans or archaic humans, such as Denisovans?
The tools do not help to identify their likely makers. Slate is easy to work and typically yields flat blades with sharp, albeit not especially durable, edges; they are disposable perhaps explaining why so many were found at Nwya Devu. None show signs of pressure flaking that typify tools made from harder, more isotropic rock, such as flint. Yet they include a variety of use-types: scrapers; awls; burins and choppers as well as blades. The lack of associated remains of prey or hearths is suggested by the authors to signify that the site was a workshop; perhaps that will change with further excavation in the area. The age range suggests regular, if not permanent, occupancy for more than 20 ka
Related articles: Gibbons, A. 2014. Tibetans inherited high-altitude gene from ancient human. Science News,2 July 2014, Zhang J-F. & Dennell, R. 2018. The last of Asia conquered by Homo sapiens. Science, v. 362, p. 992-993; DOI: 10.1126/science.aav6863.
Between 541 and 543 CE, during the reign of the Roman Emperor Justinian, bubonic plague spread through countries bordering the Mediterranean Sea. This was a decade after Justinian’s forces had had begun to restore the Roman Empire’s lost territory in North Africa, Spain, Italy and the present-day Balkans by expeditions out of Byzantium (the Eastern Empire). At its height, the Plague of Justinian, was killing 5000 people each day in Constantinople, eventually to consume 20 to 40% of its population and between 25 to 50 million people across the empire. Like the European Black Death of the middle 14th century. The bacterium Yersinia pestis originated in Central Asia and is carried in the gut of fleas that live on rats. The ‘traditional’ explanation of both plagues was that plague spread westwards along the Silk Road and then with black rats that infested ship-borne grain cargoes. Plausible as that might seem, Yersinia pestis, fleas and rats have always existed and remain present to this day. Trade along the same routes continued unbroken for more than two millennia. Although plagues with the same agents recurred regularly, only the Plague of Justinian and the Black Death resulted in tens of million deaths over short periods. Some other factor seems likely to have boosted fatalities to such levels.
Monk administering the last rites to victims of the Plague of Justinian
Five years before plague struck the Byzantine historian Procopius recorded a long period of fog and haze that continually reduced sunlight; typical features of volcanic aerosol veils. Following this was the coldest decade in the past 2300 years, as recorded by tree-ring studies. It coincides with documentary evidence of famine in China, Ireland, the Middle East and Scandinavia.. A 72 m long ice core extracted from the Colle Gnifetti glacier in the Swiss Alps in 2013 records the last two millennia of local climatic change and global atmospheric dust levels. Sampled by laser slicing, the core has yielded a time series of data at a resolution of months or better. In 536 an Icelandic volcano emitted ash and probably sulfur dioxide over 18 months during which summer temperature fell by about 2°C. A second eruption followed in 540 to 541. ‘Volcanic winter’ conditions lasted from 536 to 545, amplifying the evidence from tree-ring data from the 1990’s.
The Plague of Justinian coincided with the second ‘volcanic winter’ after several years of regional famine. This scenario is paralleled by the better documented Great Famine of 1315-17 that ended the two centuries of economic prosperity during the 11th to 13th centuries. The period was marked by extreme levels of crime, disease, mass death, and even cannibalism and infanticide. In a population weakened through malnutrition to an extent that we can barely imagine in modern Europe, any pandemic disease would have resulted in the most affected dying in millions. Another parallel with the Plague of Justinian is that it followed the ending of four centuries of the Medieval Warm Period, during which vast quantities of land were successfully brought under the plough and the European population had tripled. That ended with a succession of major, sulfur-rich volcanic eruption in Indonesia at the end of the 13th century that heralded the Little Ice Age. Although geologists generally concern themselves with the social and economic consequences of a volcano’s lava and ash in its immediate vicinity– the ‘Pompeii view’ – its potential for global catastrophe is far greater in the case of really large (and often remote) events.
Chemical data from the same ice core reveals the broad economic consequences of the mid-sixth century plague. Lead concentrations in the ice, deposited as airborne pollution from smelting of lead sulfide ore to obtain silver bullion, fell and remained at low levels for a century. The recovery of silver production for coinage is marked by a spike in glacial lead concentration in 640; another parallel with the Black Death, which was followed by a collapse in silver production, albeit only for 4 to 5 years.
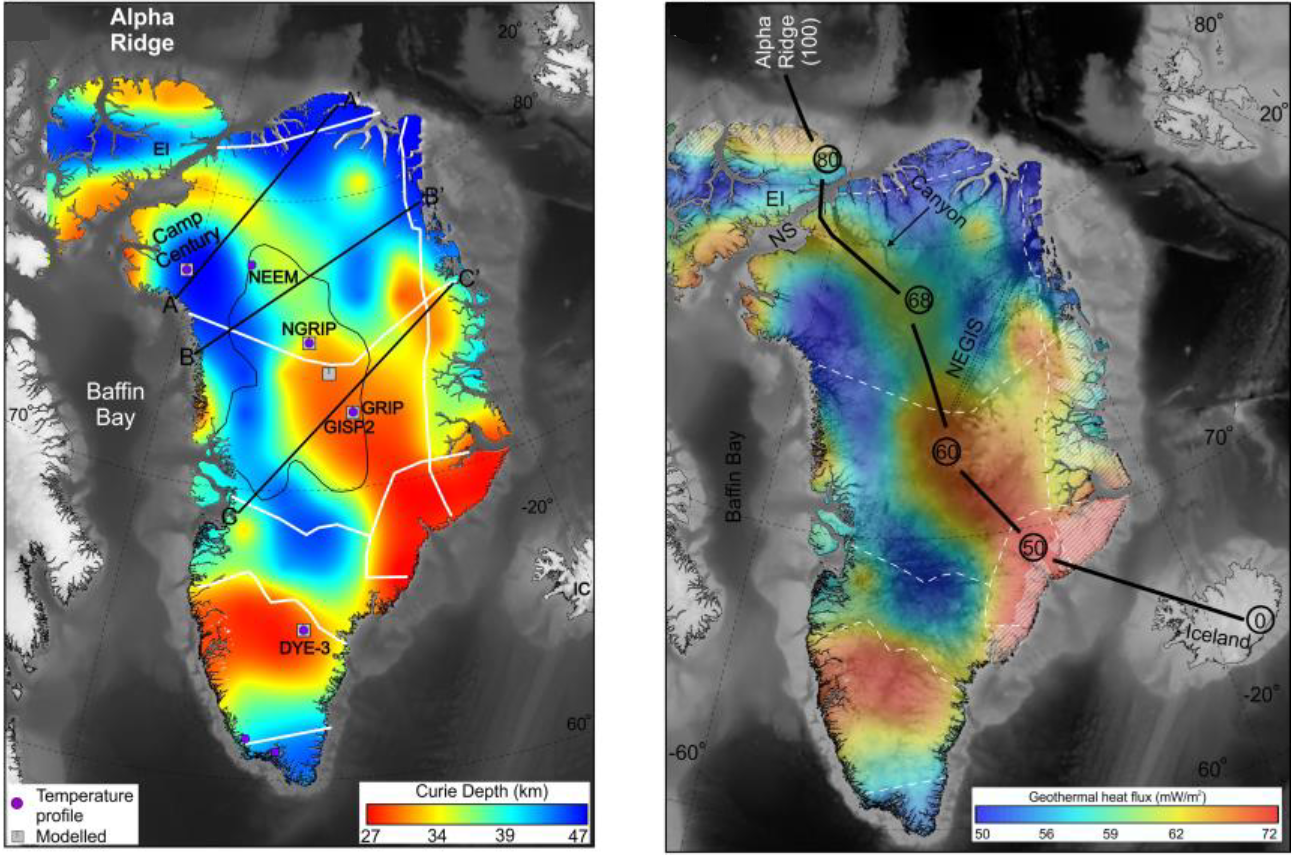
Radar microwaves are able to penetrate easily through several kilometres of ice. Using the arrival times of radar pulses reflected by the bedrock at glacial floor allows ice depth to be computed. When deployed along a network of flight lines during aerial surveys the radar returns of large areas can be converted to a grid of cells thereby producing an image of depth: the inverse of a digital elevation model. This is the only means of precisely mapping the thickness variations of an icecap, such as those that blanket Antarctica and Greenland. The topography of the subglacial surface gives an idea of how ice moves, the paths taken by liquid water at its base, and whether or not global warming may result in ice surges in parts of the icecap. The data can also reveal topographic and geological features hidden by the ice (see The Grand Greenland Canyon September 2013).
Colour-coded subglacial topography from radar sounding over the Hiawatha Glacier of NW Greenland (Credit: Kjaer et al. 2018; Fig. 1D)
Such a survey over the Hiawatha Glacier of NW Greenland has showed up something most peculiar (Kjaer, K.H. and 21 others 2018. A large impact crater beneath Hiawatha Glacier in northwest Greenland. Science Advances, v. 4, eaar8173; DOI: 10.1126/sciadv.aar8173). Part of the ice margin is an arc, which suggests the local bed topography takes the form of a 31km wide, circular depression. The exposed geology shows no sign of a structural control for such a basin, and is complex metamorphic basement of Palaeoproterozoic age. Measurements of ice-flow speeds are also anomalous, with an array of higher speeds suggesting accelerated flow across the depression. The radar image data confirm the presence of a subglacial basin, but one with an elevated rim and a central series of small peaks. These are characteristic of an impact structure that has only been eroded slightly; i.e. a fairly recent one and one of the twenty-five largest impact craters on Earth.. Detailed analysis of raw radar data in the form of profiles through the ice reveals that the upper part is finely layered and undisturbed. The layering continues into the ice surrounding the basin and is probably of Holocene age (<11.7 ka), based on dating of ice in cores through the surrounding icecap. The lower third is structurally complex and shows evidence for rocky debris. Sediment deposited by subglacial streams where they emerge along the arcuate rim contain grains of shocked quartz and glass, as well as expected minerals from the crystalline basement rocks. Some of the shocked material contains unusually high concentrations of transition-group metals, platinum-group elements and gold; further evidence for impact of extraterrestrial material – probably an iron asteroid that was originally more than 1 km in diameter. The famous Cape York iron meteorite, which weighs 31 t – worked by local Innuit to forge harpoon blades – fell in NW Greenland about 200 km away.
The central issue is not that Hiawatha Glacier conceals a large impact crater, but its age. It certainly predates the start of the Holocene and is no older than the start of Greenland glaciation about 2.6 Ma ago. That only Holocene ice layers are preserved above the disrupted ice that rests immediately on top of the crater raises once again the much-disputed possibility of an asteroid impact having triggered the Younger Dryas cooling event and associated extinctions of large mammals in North America at about 12.9 ka (see Impact cause for Younger Dryas draws flak May 2008). Only radiometric dating of the glassy material found in the glaciofluvial sediments will be able to resolve that particular controversy.
A range of indirect evidence has been used to suggest that life originated deep in the oceans around hydrothermal vents, such as signs of early organic matter in association with Archaean pillow lavas. One particularly persuasive observation is that a number of proteins and other cell chemicals are constructed around metal sulfide groups. Such sulfides are common around hydrothermal ‘smokers’ associated with oceanic rift systems. Moreover, Fischer-Tropsch reactions between carbon monoxide and hydrogen produce quite complex hydrocarbon molecules under laboratory conditions. Such hydrogenation of a carbon-bearing gas requires a catalyst, a commonly used one being chromium oxide (see Abiotic formation of hydrocarbons by oceanic hydrothermal circulationMay 2004). It also turns out that fluids emitted by sea-floor hydrothermal systems are sometimes rich in free hydrogen, formed by the breakdown of olivine in ultramafic rocks to form hydroxylated minerals such as serpentine and talc. The fact that chromium is abundant in ultramafic rocks, in the form of its oxide chromite, elevates the possibility that Fischer-Tropsch reactions may have been a crucial part of the life-forming process on the early Earth. What is needed is evidence that such reactions do occur in natural settings.
A white carbonate mound forming at the Lost City hydrothermal vent field on the Mid-Atlantic Ridge (Credit: Baross 2018)
One site on the mid-Atlantic ridge spreading centre, the Lost City vent field, operates because of serpentinisation of peridotites exposed on the ocean floor, to form carbonate-rich plumes and rocky towers; ‘white smokers’. So that is an obvious place to test the abiotic theory for the origin of life. Past analyses of the vents have yielded a whole range of organic molecules, including alkanes, formates, acetates and pyruvates, that are possible precursors for such a natural process. Revisiting Lost City with advanced analytical techniques has taken the quest a major step forward (Ménez, B. et al. 2018. Abiotic synthesis of amino acids in the recesses of the oceanic lithosphere. Nature, advance online publication; DOI: 10.1038/s41586-018-0684-z). The researchers from France and Kazakhstan focused on rock drilled from 170 m below the vent system, probably beyond the influence of surface contamination from living organisms. Using several methods they detected the nitrogen-containing amino acid tryptophan, and that alone. Had they detected other amino acids their exciting result would have been severely tempered by the possibility of surface organic contamination. The formation of tryptophan implies that its abiotic formation had to involve the reduction of elemental nitrogen (N2) to ammonia (NH3). Bénédicte Ménez and colleagues suggest that the iron-rich clay saponite, which is a common product of serpentine alteration at low temperatures, may have catalysed such reduction and amino-acid synthesis through Friedel–Crafts reactions. Fascinating as this discovery may be, it is just a step towards confirming life’s abiogenesis. It also permits speculation that similar evidence may be found elsewhere in the Solar System on rocky bodies, such as the moons Enceladus and Europa that orbit Saturn and Jupiter respectively. That is, if the rock base of hydrothermal systems thought to occur there can be reached.
Related article: Baross, J.A. 2018. The rocky road to biomolecules. Nature, v. 564, p. 42-43; DOI: 10.1038/d41586-018-07262-8.
The most widespread risk from natural hazards is, with little doubt, that posed by ground instability; landslides and landslips; mudflows; rock avalanches and a range of other categories in which large volumes of surface material are set in motion. They can be triggered by earthquakes, volcanism or heavy rainfall that changes the physical properties of rock and soil. Not only steep slopes pose a risk, for some affect ground with quite gentle topography, as witness the terrible scenes from Sulawesi triggered by the 28 September 2018 magnitude 7.5 earthquake beneath the Minhasa Peninsula. This set in motion mudflows on gently sloping ground when the seismic waves caused liquefaction of unconsolidated sediments that not only shattered dwellings by the lateral motion, but whole communities sank into the slurry with little trace. The rapid events left a death toll confirmed at 2010 people with about 5000 missing, feared to have been swallowed by the earth. In the last 9 months mass movement has resulted in fatalities in many places, the most publicised being in Uganda, Japan, Philippines, Sulawesi, Ethiopia, Sumatra, South India, Bangladesh, California, Nepal, and the list grows as it does every year.
Types of mass movement (Credit: US Geological Survey
As well as purely natural causes, human activities, such as deforestation, excavations and dumping of materials, greatly exacerbate risks. The South Wales former coal-mining communities commemorate every year the collapse of a mine spoil heap on a steep hillside on 21 October 1966 that engulfed a primary school at Aberfan, killing 116 small children and 28 adults. Wherever they occur, there seems to be little chance of escape for those in their path. Slowly it has become possible for geoscientists to outline areas that are potentially at risk from catastrophic mass wastage, sometimes from the distribution of scars of previous events on remotely sensed images, but increasingly by multivariate analysis of landscapes in terms of the factors that may contribute to future ground failures. The principal ones are: topographic slope and relief; annual rainfall, especially the likely precipitation in a single day; vegetation cover, particularly by trees; strength of surface rock and soils, including degrees of consolidation, interbedding and water content; geological structure, such as the trajectory of faults, degree of jointing and the dip of strata. Modelling risk has to grapple with the global scale of the problem, which cannot be addressed in the least developed regions by piecemeal local studies, although those are urgent, of course, in areas with recorded instances of catastrophic ground failure. Regional studies can screen vast areas of probably low risk so that meagre resources can focus on those that appear to be most dangerous to populated places.
Degree of risk from landslides of all types in the northern part of the East African Rift System (Credit: Broeckx et al. 2018; Fig. 6)
Belgian engineering geologists and GIS specialists have assembled a monumental risk assessment of Africa, together with a bibliography of all published work on mass movement across the continent (Broeckx, J. et al. 2018. A data-based landslide susceptibility map of Africa. Earth-Science Reviews, v. 185, p. 102-121; DOI: 10.1016/j.earscirev.2018.05.002). They point out that Google Earth’s 3-D viewing potential at fine spatial resolution provides a free and rapid means of mapping scars of previous earth movements in considerable detail over areas that data analysis suggests to be susceptible. Their paper provides continent-scale maps of the parameters that they used as well as maps showing several versions of their risk analysis. The supplementary data to the paper include downloadable, full-resolution maps of landslide susceptibility.
TerraSAR-X and Tandem-X satellites fly close to each other some 500km above the Earth
In 2007 and 2010 two radar-imaging satellites were launched by the German space agency DLR, TerraSAR-X and Tandem-X respectively. After 2010 both orbited in close, side-by-side formation, sometimes as little as 200 m apart. With one acting as a both a transmitter and receiver of microwave pulses, the other as a receiver, this set up allowed the two signals returning from the Earth’s surface to be matched. The slightly different positions of the platforms results in a time difference at which a pulse reflected from a point on the Earth’s surface reaches the two receiving antennas. This difference varies according to the topographic elevation of the point – in effect analogous to the parallax shift captured in conventional stereoscopic images but measured by the interference between the two signals. Although involving far more complex computation, such radar interferometry produces estimates of each point’s elevation and ultimately a 3-dimensional image of the Earth’s surface. After a period of commercial operation, DLR has decided to make part of the data available free of charge. Both systems use microwaves with a wavelength of around 3 cm (9.65 GHz frequency), which allows topographic elevation to be measured to a precision of ±1 m. Using orbits that cross the poles, each at an angle to the Equator, allows swaths from the dual system eventually to cover the whole planet, in the manner of winding a ball of string. Eventually, the data will permit the detection of vertical movements of one kind or another when multiple coverage of the Earth becomes available. However, the expected lifetime of the platforms is limited, so DLR plans to launch two 23.6 cm interferometric radar satellites to assess dynamic processes occurring on the Earth’s surface.
Side illuminated, colour-coded TanDEM-x elevation model of part of the Sahara desert, in the Tamanrasset province of central Algeria
The resolution of radar interferometry in the two dimensions of a map depends on many factors, some of which stem from the complex processing of the raw data. DLR global data is presented at three resolutions (pixel size): 12 m, the finest; 30 m and 90 m. For local acquisition even finer resolution is possible. Only the 90 m version is being released for free use. The first interferometric radar elevation data to be made freely available was from the NASA Shuttle Radar Topography Mission (SRTM) that was accomplished from the US Space Shuttle Endeavour in 2000, using a single instrument that incorporated two antennas separated by a 60 m long mast deployed from the Shuttle. SRTM acquired data only between latitudes 60° N and 60° S, using 23.6 cm L-band radar. As well as omitting high latitudes, the SRTM design limited actual elevation precision to about 4 m compared with the ±1 m from TerraSAR-X/TanDEM-X. SRTM data with a two-dimensional resolution of 30 m are freely available from the US Geological Survey.
Full global elevation data with a 30 m 2-D resolution and elevation precision of ±9 m have also been produced by the optical stereoscopic potential of the US-Japan ASTER imaging system and are freely available to all via the US Geological Survey. Unlike data produced by radar missions, the optical stereoscopic data from ASTER depend on cloud-free, daytime conditions, and accurate derivation of parallax can be prevented by areas of rugged terrain in deep shadow at the 10 am local-time when images are acquired.
Despite the limitation of TerraSAR-X/TanDEM-X elevation data to a 90 m 2-D resolution, and the consequent loss of textural detail in landscapes, they appear to have the edge in terms of completeness and vertical precision. To get elevation data from DLR requires personal registration after reading a lengthy screed of documentation about data acquisition.
Silcrete flake from Blombos with crosshatching drawn in red ochre. (Credit: C. Foster)
The Blombos Cave 300 km east of Cape Town is where the earliest signs of art produced by anatomically modern humans were found (see Snippets on human evolution October 2011). The most publicized was a shaped piece of ochre etched with a hashed pattern of lines (Henshilwood, C.S. et al. 2018. An abstract drawing from the 73,000-year-old levels at Blombos Cave, South Africa. Nature v. 561, online; DOI: 10.1038/s41586-018-0514-3). This and the ochre-processing workshop where it was found gave a date of about 100 ka, Now another item has hit the newsrooms; a ground piece of flinty silcrete that shows signs of being the product of knapping, on which has been drawn a similar pattern, which resembles the now ubiquitous ‘hashtag’ associated with Twitter. The level in the excavation from which it was removed gives an age of about 75 ka. Like the earlier artifact, it involved the use of ochre but in a way that has been said to be an example of drawing or painting, rather than etching. It is likely to have been produced by a sharpened piece of solid ochre, perhaps a kind of crayon
For some reason the object has been hyped as the earliest example of art and of advanced cognitive abilities. But the pattern is not as complex as that on the original etched ochre block from Blombos, or even those on a freshwater mussel from Trinil in Java that could have =been made by associated Homo erectus between 430 and 500 ka ago. This does not take the context at Blombos into account. There is ample evidence that ochre, along with charcoal and burnt seal bone, was being ground there and made into paint found in an abalone shell. It can be surmised that such paint was used for some kind of decoration that has not yet been discovered. That is quite possibly because it was used for body paint as similar materials are still widely used. Now anyone – male or female – who uses cosmetics today, be it foundation, lipstick, eye-liner and -shadow or the truly fabulous make-up used by the Kathakali performers of Kerala, takes an age to try and to decide on which of an almost imperceptible range of shades to apply. Ochres are like that, as any native Australian artist will tell you.
Lord Rama face paint in Kathakali
To me, the most likely origins of both kinds of Palaeolithic hashtag are: in the case of the ‘drawing’, checking the colour and ‘grindability’ of a sharpened piece of red ochre before use; and for the etched block, using a sharp tool to grind off small amounts from what may have been a well-used block of an especially valued hue.
A revised and updated edition of Steve Drury’s book Stepping Stones: The Making of Our Home World can now be downloaded as a free eBook
Two bone fragments from the Denisova Cave – the former abode of an 18th century Russian hermit called Denis – in the Altai region of Siberia yielded ancient DNA. One matches that from previously analysed Neanderthal remains and the other a genome that could only be ascribed to a hitherto unknown ancient-human population, now known as the Denisovans. Since their discovery further analysis of both modern and ancient DNA has shown that modern humans living outside of Africa contain a few percent of DNA from both ancient-human groups. Soon after leaving Africa some of their ancestors interbred with both; indeed a 40 ka-old modern-human jaw from Romania revealed genetic evidence that the individual had a Neanderthal great-great grandparent. Their descendants spread far and wide to populate Eurasia, Australasia and the Americas. Using the ancient DNA to peer back in time suggests that Neanderthals and Denisovans diverged from a common ancestor between 470 and 380 ka, itself having split from modern-human ancestry between 770 to 550 ka. Denisovan DNA also contains evidence that its ancestry included segments that could only have come from a totally unknown hominin species. Interestingly, DNA from the Neanderthal bone fragment found at Denisova contains fragments from an anatomically modern-human.
Tourists at the entrance to Denisova Cave, Russia (credit: Wikipedia)
With such riches from tiny fragments of human bones unearthed from the Denisova Cave, it is no surprise that the team led by Svante Pääbo at the Max Planck Institute for Evolutionary Anthropology in Leipzig, Germany, has subsequently analysed others that showed signs of human proteins. The latest ‘takes the biscuit’. A fragment of limb bone from someone who was at least 13 years old yielded DNA commensurate with their having been the child of a Neanderthal mother and a Denisovan father (Slon, V. and 18 others 2018. The genome of the offspring of a Neanderthal mother and a Denisovan father. Nature, v. 560, published on-line; doi: 10.1038/s41586-018-0455-x). Their child was a girl, who has been nicknamed ‘Denny’ by the team, though ‘Denise’ might seem more appropriate. The only clues to what her father, or any Denisovan, might have looked like stem from a few teeth and a skull fragment from the cave that have yielded Denisovan DNA. The teeth are much larger and the skull fragment is thicker than those of Neanderthals, suggesting that Denisovans were distinctly bigger and more robust than even the sturdy Neanderthals.
The father came from a population related to a later Denisovan found in the cave – the first to be sequenced. This suggests long-term occupancy of the area by Denisovans. But his genome also carries traces of Neanderthal ancestry. Surprisingly, the mother is more closely related to Croatian Neanderthals, rather than to an earlier Neanderthal found in the cave. Neanderthals were clearly capable of migrating between Europe and eastern Eurasia; more than 5000 km in this case. Even though very few archaic humans have been genetically sequenced it is beginning to look as if genetic mixing between diverse hominin groups in the last half million years was common, when they actually met. A custom of marrying outside a closely related group (exogamy) has been popular throughout recorded history; indeed it makes sound genetic sense. With the tiny human population density during the Late Pleistocene, it may then have been cause for mutual celebration. As documented in Chapters 2 and 3 of David Reich’s Who We Are and How We Got Here (Oxford University Press, 2018) human origins since about 470 ka until the present chart a history of episodic migrations and genetic mixing that certainly makes nonsense of earlier ideas of ‘racial purity’ and casts doubt even on the term ‘species’ as regards members of the genus Homo.
If we are ever to discover who the Denisovans were and what they looked like, the evidence is likely to come from East Asia at latitudes where climate favours preservation of DNA. Advanced sequencing equipment and techniques are now operational in China, where suspected Denisovan remains have been found
Africa is not only a large continent, but is subdivided into many different climatic zones and ecosystems and these have changed drastically over the last 2 Ma. It is further subdivided by terrain features, such as the courses of major rivers, large plateaus, tectonic rift systems and the mountains that frequently define their flanks. Getting around Africa is not easy today, was more difficult before modern transport, and many geomorphic provinces may have been mutually inaccessible in the distant past. For instance, the Sahara Desert forms a major barrier to travellers on foot because access to surface water is non-existent except at widely spaced oases. Without boats or rafts the Nile and Congo cannot be crossed for a thousand miles or more. Migration was perhaps a very rare event outside of periods of widespread humid climates or when great environmental stress forced people either to move or perish. Despite these physical and ecological divisions and barriers palaeoanthropologists have, until recently, tended to regard the evolution of Homo sapiens and earlier human and hominin species as having occurred within single populations: a linear view forced on them by scanty fossil remains and limited methodologies. Logically, when human numbers were small Africa probably had several isolated population Physical isolation would have engendered genetic isolation in which our ancestors evolved for tens of thousand years.
Anatomically modern human (AMH) remains found at Jebel Irhoud in Morocco turned out to be 315 ka old, displacing those from Ethiopia (190 ka) as the earliest known examples of AMH. Several more archaic H. sapiens fossils have turned up in southern Africa and as far afield as the Middle East, suggesting that the early evolution of AMH was in an Africa-wide context rather than in one area – the rift system of Ethiopia and Kenya – from which a new species radiated outwards. This breadth of finds has encouraged Eleanor Scerri of Oxford University and her many international colleagues to resurrect what was once a widely discarded hypothesis; a multiregional model of modern human origins, originally proposed to have arisen from pre-sapiens groups in Eurasia by Milford Wolpoff but which was sunk once genetic connections among living humans turned out to be rooted in Africa. (Scerri, E.M.L. and 22 others 2018. Did our species evolve in subdivided populations across Africa, and why does it matter? Trends in Ecology & Evolution, v. 33, p. 582-594; (PDF) doi: 10.1016/j.tree.2018.05.005). Scerri et al’s model is sited in Africa and the paper’s authors include several leading palaeoanthropologists who once opposed multiregionalism and established the Recent African Origin hypothesis on the back of the early genetic data.
Different early AMH cranium shapes: left Jebel Irhoud, Morocco (315 ka), right Qafzeh, the Levant (85 ka) (credit: Scerri et al, 2018; Figure 1)
From region to region in Africa, the oldest AMH crania show significant differences from each other, but within a distinct combination of features that clearly distinguish us from our fossil relatives and ancestors, such as Homo heidelbergensisfrom Zimbabwe and the primitive-looking H. naledifound in a South African cave in 2015. Improved dating now shows that the Zimbabwean H. heidelbergensis andH.naledi remains are roughly the same age as the Jebel Irhoud AMH specimens. The first has long been held as the progenitor of AMH and descended from H. antecessor, perhaps the common ancestor for AMH, Neanderthals and Denisovans about 700 ka ago. The three human species cohabited Africa early in the evolutionary history of AMH. It is now abundantly clear from ancient and modern genomes that AMH, Neanderthals and Denisovans interbred in Eurasia. The proximity in time and space of earlier African AMH to two more ancient human species opens up a similar possibility earlier in the emergence of all living humans. There is evidence for that too: Yoruba people living in West Africa, whose genomes have been analysed, carry up to 8% of genetic ancestry that originated in an unidentified ancient population that was non-sapiens. At present, DNA analysis with the same high precision and information content from other living Africans has not been performed, and deterioration of ancient DNA in African climates has so far thwarted genomic studies of ancient African fossils.
The new view of our origins points to repeated hybridisation involving other coexisting human species, as well as evolution in isolation, from the outset. It continued through later times while Neanderthals and Denisovans survived. Even recent human genetic history is peppered with intermingling of a great variety of migrants passing through all the habitable continents. Another issue: In the earliest times, were cultures exchanged as well as genes? The first appearance of AMH coincides with that of a new stone technology (Levallois technique), moving away from the earlier dominance by handaxes towards more delicate, leaf-shaped points, that characterise the African Middle Stone Age. Similar techniques reached Europe with the Neanderthals. Was this an invention of the earliest AMH or a joint venture?
You can find an excellent review of these issues in the September 2018 issue of Scientific American (Wong, K. 2018. Last hominin standing. Scientific American, v. 319(3), p. 56-61) along with several other articles on human evolution.
A revised and updated edition of Steve Drury’s book Stepping Stones: The Making of Our Home World can now be downloaded as a free eBook
Robert Stern of the University of Texas at Dallas, USA, and Taras Gerya of ETH, Zurich, have produced a masterly review of how subduction gets started from place to place, and from time to time in geological history (Stern, R.J. & Gerya, T. 2018. Subduction initiation in nature and models: A review. Tectonophysics, v. 744 (in press); (PDF). It is the foundering of oceanic lithosphere into the mantle and gravity that give modern plate tectonics the bulk of energy that drives it along by slab pull. Yet the mantle’s consumption of a lithospheric slab somehow has to be set in motion from the symmetrical spreading of ocean floor as occurs either side of a constructive margin. It could not happen were the lithosphere to retain its low bulk density relative to mantle peridotite for all time. Moreover, it wouldn’t last for long were the lithosphere not to retain its strength through hundreds of kilometres depth as it sinks into the mantle. Active subduction zones have consumed vast amounts of oceanic lithosphere, for more than 65 million years, especially in fast-spreading ocean basins such as the western and eastern Pacific. The record is held by the destructive margin on the west flank of South America where more than 150 million years-worth of eastern Pacific lithosphere has been swallowed. Yet in order for oceanic lithosphere, which is stronger than that beneath the continents, somehow to fail and begin to sink a linear weak zone must develop at the interface between two incipient new plates. On top of that, all subduction on Earth is one-sided. A simple mechanism involving just thermal convection predicts that both plates either side of a break would have similar density so both should sink, more or less symmetrically.
Various ways in which subduction may start. (Credit: Stern and Gerya 2018 – in press – Figure 4)
Geophysical observations reveal that terrestrial subduction can be divided into that which is induced by plate motions and changes in force balance within spreading plates, or spontaneously due to unique conditions developing along the line of initiation. In the first class are cases where a microcontinent is driven into another continental margin and extinguishes the subduction responsible, while spreading continues behind the accreted microcontinent drive older lithosphere beneath the suture (this may have happened in the past but is not seen today). Another, similar, induced case occurs where an oceanic island arc accretes by subduction beneath it so that subduction flips in polarity to consume the driving sea-floor spreading. The loading of oceanic lithosphere by sediments piled onto it by erosion of a continental margin may spontaneously collapse to result in subduction beneath the sedimentary wedge and the continent (again, not happening today, but inferred from examples inferred by earlier geological history). Spontaneous failure may also occur where old, cold lithosphere is juxtaposed with younger by transform faulting, or where a mantle plume heats up lithosphere to create a thermally weakened zone.
Stern and Gerya do not leave the issue at simple mechanics but discuss how plates may develop weak zones or inherit them from earlier tectonic events. The role of water released by metamorphism of descending materials may encourage the observed one-sidedness of subduction by reducing frictional resistance and plate strength and make the process self-sustaining. The paper also discusses the various permutations and combinations that affect the style of induced destructive margins in compressional and extensional environments and a whole variety of nuanced cases of spontaneous initiation. Numerical modelling of the subduction process plays an important, though somewhat bewildering role in discussion, as do considerations of the forces likely to be at play. Applying theoretical considerations to actual examples from the geological record are sublimely enlivening, as are speculations about the future evolution of the passive margins of the Atlantic. Clearly, there is a healthy future for field and mathematical study on the processes at destructive plate margins, such as building in the aspects of magmagenesis. Since Stern has built his career on study of long dead collusions zones, products of arc accretion etcetera, development of their understanding is undoubtedly the main thrust of his and Gerya’s tour de force. Stern provides a full PDF at his University of Texas website for the benefit of anyone who wants to delve deeper than space at Earth-pages and my limited intellect permit!
A fully revised edition of Steve Drury’s book Stepping Stones: The Making of Our Home World can now be downloaded as a free eBook
The Snowball Earth hypothesis first arose when Antarctic explorer Douglas Mawson (1882-1958)speculated towards the end of his career on an episode of global glaciations, based on his recognition in South Australia of thick Neoproterozoic glacial sediments. Further discoveries on every continent, together with precise dating and palaeomagnetic indications of the latitude at which they were laid down, have steadily concretised Mawson’s musings. It is now generally accepted that frigid conditions enveloped the globe at least twice – the Sturtian (~715 to 660 Ma) and Marinoan (650 to 635 Ma) glacial episodes – and perhaps more often during the Neoproterozoic Era. Such an astonishing idea has spurred intensive studies of geochemistry associated with the events, which showed rapid variations in carbon isotopes in ancient seawater, linked to the terrestrial carbon cycle that involves both life- and Earth processes. Strontium isotopes suggest that the Neoproterozoic launched erratic variation of continental erosion and weathering and related carbon sequestration that underpinned major climate changes in the succeeding Phanerozoic Eon. Increased marine phosphorus deposition and a change in sulfur isotopes indicate substantial change in the role of oxygen in seawater. The preceding part of the Proterozoic Eon is relatively featureless in most respects and is known to some geoscientists as the ‘Boring Billion’.
Artist’s impression of the glacial maximum of a Snowball Earth event (Source: NASA)
Noted tectonician Robert Stern and his colleague Nathan Miller, both of the University of Texas, USA, have produced a well- argued and -documented case (and probably cause for controversy) that suggests a fundamental change in the way the Precambrian Earth worked at the outset of the Neoproterozoic (Stern, R.J. & Miller, N.R. 2018. Did the transition to plate tectonics cause Neoproterozoic Snowball Earth. Terra Nova, v. 30, p. 87-94). To the geochemical and climatic changes they have added evidence from a host of upheavals in tectonics. Ophiolites and high-pressure, low-temperature metamorphic rocks, including those produced deep in the mantle, are direct indicators of plate tectonics and subduction. Both make their first, uncontested appearance in the Neoproterozoic. Stern and Miller ask the obvious question; Was this the start of plate tectonics? Most geologists would put this back to at least the end of the Archaean Eon (2,500 Ma) and some much earlier, hence the likelihood of some dispute with their views.
They consider the quiescent billion years (1,800 to 800 Ma) before all this upheaval to be evidence of a period of stagnant ‘lid tectonics’, despite the Rodinia supercontinent having been assembled in the latter part of the ‘Boring Billion’, although little convincing evidence has emerged to suggest it was an entity formed by plate tectonics driven by subduction. But how could the onset of subduction-driven tectonics have triggered Snowball Earth? An early explanation was that the Earth’s spin axis was much more tilted in the Neoproterozoic than it is at present (~23°). High obliquity could lead to extreme variability of seasons, particularly in the tropics. A major shift in axial tilt requires a redistribution of mass within a planetary body, leading to true polar wander, as opposed to the apparent polar wander that results from continental drift. There is evidence for such an episode around the time of Rodinia break-up at 800 Ma that others have suggested stemmed from the formation of a mantle superplume beneath the supercontinent.
Considering seventeen possible geodynamic, oceanographic and biotic causes that have been plausibly suggested for global glaciation Stern and Miller link all but one to a Neoproterozoic transition from lid- to plate tectonics. Readers may wish to examine the authors’ reasoning to make up their own minds – their paper is available for free download as a PDF from the publishers.
A fully revised edition of Steve Drury’s book Stepping Stones: The Making of Our Home World can now be downloaded as a free eBook
The longest river in the world, the Nile has all sorts of riveting connotations in terms of archaeology, Africa’s colonial history, the romance of early exploration and is currently the focus of disputes about rights to its waters. The last stems from its vast potential for irrigation and for hydropower. It is probably the most complex of all the major rivers of our planet because it stretches across so many climatic zones, topographic systems geological and tectonic provinces. Mohamed Abdelsalam of Oklahoma State University, who was born in the Sudan and began his career at the confluence of the White and Blue Nile in its capital Khartoum, is an ideal person to produce a modern scientific summary of how the Nile has evolved. That is because he has studied some of the key elements of the geology through which the river and its major tributaries travel, but most of all because he is a leading geological and geomorphological interpreter of remotely sensed data. Only space imagery can let us grasp the immense span and complexity of the Nile system. His recent review of its entirety (Abdelsalam, M.G. 2018. The Nile’s journey through space and time: A geological perspective. Earth Science Reviews, v. 177, p. 742-773; doi: 10.1016/j.earscirev.2018.01.010) is a tour de force, many years in the compilation, and it makes fittingly compulsive reading.
Abdelsalam lays out the geomorphology, underlying geology and regional tectonics of the Nile drainage basin, synthesized from publications over the last century, including his own work on the evolution of the Blue Nile in Ethiopia. On the regional scale elements of its complexity can be ascribed to the upwelling of mantle plumes beneath the Ethiopian Highlands and Red Sea, and under the Lake Plateau centred on Kenya, Tanzania, Rwanda and Burundi. These plumes are part of a much larger mantle mass rising from the core-mantle boundary beneath the African continent. Their influence on the lithosphere of north-east Africa began over 30 million years ago, producing vast outpourings of flood basalts followed by regional doming, the formation of large shield volcanoes and rifting to transform a once muted surface to one with a topographic range of up to 5 kilometres in the Nile’s two main source regions in Ethiopia and the Lakes Plateau.
The geological underpinnings of the Nile system (Credit: Abdelsalam 2018; Fig. 5)
The basin can be divided into six distinct provinces, from south to north the Lakes, Sudd, Central Sudan, Ethiopia – East Sudan, Cataract and Egyptian Niles. Each of them has had a different history; in fact, the making of the Nile system as we know it has taken at least 6 million years and probably longer. For instance, the Lakes Nile basin, founded mostly on Precambrian crystalline basement, seems original to have drained westward through the Congo system to the Atlantic Ocean. Sometime between 20 and 12 Ma the western branch of the East African Rift System began to form along with slow, broad uplift, hindering westward flow to create the forerunners of the Great Lakes. The flow was reversed around 2.5 Ma ago by the rise of the Rwenzori and Virunga massifs on the western rift flank and eventually forced northwards into the low-lying Sudd, breaching a major divide in Northern Uganda. The vast swamps there have acted as a buffer for sediment supply, other than the finest silts and clays, into the northern stretches of the White Nile. The Blue Nile’s tortuous trajectory evolved as the Ethiopian flood basalt province rose after 30 Ma, rifted to form the Lake Tana Basin and drained to initiate erosion into the rising plateau with the interference of huge shield volcanoes that formed as uplift proceeded.
Other events are recorded along the Nile’ general trajectory by huge, abandoned alluvial fans, relics of now vanished lakes and evidence from satellite radar of palaeo-drainages with reversed flow beneath the surface of the eastern Sahara. The system evolved episodically, in five or more steps, at the whim of broad tectonic processes that affected flow direction and erosive capacity. The Cataract Nile that cuts through hard basement rocks perhaps records the increase in energy added by the Blue Nile which, which in turn may have encouraged the drainage of the huge Sudd swamps that established the White Nile’s course. Even the Mediterranean Sea played a role: the Egyptian Nile may have formed when the sea vanished to expose a deep saline basin during the Messinian Salinity Crisis 5.5 Ma ago. This reduction in the regional base level of erosion possibly directed drainage into the present course of the Nile. The various provinces only became a unified drainage system during the last half million years, and that emerged in its present form as recently as 15 thousand years ago. But as Abdelsalam points out, there is a great deal to learn about the fabled river system. Hopefully his review will encourage others to take investigations forward and into previously unstudied regions.
Homo floresiensis from Liang Bua Cave, Flores, Indonesia. (Credit: Wikipedia)
In October 2004 the world’s news media headlined the discovery of fossil remains of a tiny adult human on the Indonesian island of Flores, dated at around 18 ka. At only 1 m tall, with a brain cavity around a third the size of ours, yet having used stone tools and fire she was a sensational find. Someone so tiny and with such a small brain seemed highly unlikely to some palaeoanthropologists. Others claimed she was of a different species altogether. Homo floresiensis was also challenged as a new species and attributed to some congenital cause of small stature in a modern human – H. sapiens had first colonised Flores between 50 and 35 ka. But the subsequent discovery of remains of nine more individuals revealed skeletal details that were definitely un-human, with a suggestion of greater affinity to H. erectus. Her stature even suggested to a few anthropologists that she may have descended from migrant H. habilis, previously known only from 2 Ma ago in East Africa. The issue of relatedness was partly resolved by further dating of the cave strata that entombed the ‘hobbit’ which pushed her back to between 190 to 50 ka, beyond the earliest date of modern human colonisation. Further fragmentary fossil finds in more easily dated sediments on Flores showed the earliest known H.floresiensis lived around 700 ka ago. Stone tools and butchered prey remains on the island go back to 1 Ma, when the hominin trail goes cold.
Liang Bua cave where the remains of Homo floresiensis were discovered in 2003. (credit: Wikipedia)
A plausible theory for these human’s ‘hobbit’-like size is an evolutionary process known as island dwarfism, akin to that which produced the tiny elephants (Stegodon) on which they preyed. Such dramatic size reduction may arise through the influence of stringently limited food resources on the evolution of descendants from a restricted founder population, genetically cut-off from larger, more widespread populations. It now appears that such dwarfism has also affected a modern human population living on Flores (Tucci, S and 14 others 2018. Evolutionary history and adaptation of a human pygmy population of Flores Island, Indonesia. Science, v. 361, p. 511-516; doi: 10.1126/science.aar8486). A group of people of diminished stature live within shouting distance of the Liang Bua cave in which Homo floresiensis was first discovered. On average adults in the village are about 1.45 m tall. They certainly are not relict H.floresiensis, just significantly smaller than other Indonesian people living on Flores.
Serena Tucci and colleagues analysed the DNA of 32 adult pygmies from the village of Rampasasa. They show no sign of DNA from any other archaic human population than the Neanderthal and Denisovan traces that every living person outside of Africa carries – the pygmies are not descendants of H.floresiensis and are little different from other Indonesians and the rest of us. The analysis does show, however, that their ancestors carried a mixture of DNA from East Asia and New Guinea; perhaps a result of several waves of migration between 50 and 5 ka. They also carry significantly more DNA segments that are linked to short stature than do other East Asians. This suggests natural selection favored existing genes for shortness while the pygmies’ ancestors were on Flores; in other words they display an example of island dwarfism akin to that probably explaining the ‘hobbits’. Moreover, the people of Rampasasa show signs of an evolutionary adaptation to an almost exclusively meat and seafood diet, possibly arising after they migrated to Flores and had to depend on the available fauna but little in the way of plant foods.
A fully revised edition of Steve Drury’s book Stepping Stones: The Making of Our Home World can now be downloaded as a free eBook
Around 63 Ma ago, during the Palaeocene Epoch, major igneous activity broke out in what are now both sides of the North Atlantic Ocean. After initial sputtering it culminated massively between 57 and 53 Ma. Relics are to be seen in Baffin Island, West and East Greenland, the Faeroes and north-western parts of the British Islands, in the form of flood basalts, dyke swarms and scattered remnants of central volcanoes. Offshore drilling on the North Atlantic’s continental shelves suggests that the volcanism extended over 1.3 million km2 and blurted out around 6.6 million km3 of magma. Not for nothing have the products of this event been categorised as a Large Igneous Province. Its formation took place before the North Atlantic existed. It began to form as this precursor magmatic paroxysm waned. Continued basaltic magma production created the ocean floor each side of the mid-Atlantic Ridge system to divide North America and Greenland from northern Europe. Sea floor spreading continues, rising above sea level in Iceland, which is underlain by a large mantle plume.
The plume beneath Iceland may have been present at a fixed position in the mantle for tens of million years. A hot spot over which plate movements have shifted lithosphere to be heated in a similar way to a sheet of paper dragged slowly over a candle flame. The Iceland plume may have left a hot-spot track similar to that involved in the Hawaiian island chain. The ocean floor to the east and west of Iceland is shallower and forms broad rides at right angles to the trend of the Mid-Atlantic Ridge system, judged to be such tracks that are still warm and buoyant after formation over the plume. But are there traces of earlier passage of drifting lithosphere over the plume. A way to detect older hot-spot tracks is through variations in geothermal heat flow through the continental surface, a linear pattern raising suspicions of such trace of passage. There is no sign to the east beneath Europe, so what about to the west. Greenland, being mainly blanketed in ice, is not a good place to conduct such a search as it would involve deep drilling through the ice at huge cost for each hole. But there is a roundabout way of obtaining geothermal information without even setting foot on Greenland’s icy wastes.
The geomagnetic field measured at the surface records anomalies in rock magnetisation in the solid Earth beneath. Near-surface variations due to large variations in rock types that comprise the continental crust appear as sharp, high frequency signals. Aeromagnetic surveys over Greenland are characterised by such noisy patterns because the subsurface geology is extremely complicated. However, the underlying upper mantle beneath all continents is geologically quite bland, but being uniformly rich in iron it contains a high proportion of magnetic minerals such as magnetite (Fe3O4). The upper mantle should therefore leave a signal in the surface geomagnetic field, albeit a commensurately bland one. Like radio signals that span a large range of wavelengths, Earth properties that vary spatially, such as the geomagnetic field, may be analysed using filters. Once the high-frequency geomagnetic features of the crust are filtered out what should remain is a signal that reflects the magnetic structure of the upper mantle. It should be more or less featureless, yet beneath Greenland it isn’t.
Estimated Curie depth variation below Greenland (left) converted to geothermal heat flow variation (right). (Credit: Martos et al. 2018; Figures 1b and 1c)
Magnetic anomalies are created by magnetisation induced in magnetic minerals in rocks by the Earth’s magnetic field. Yet minerals lose their ability to be magnetised at temperatures above a threshold known as the Curie point, which is 580 °C for magnetite, the most abundant magnetic mineral. Depending on the geothermal heat flow the Curie point is exceeded at some depth in the lithosphere. So magnetic anomalies can safely be assumed to be produced only by rocks above the so-called Curie depth. Yasmina Martos of the British Antarctic Survey (now at the University of Maryland) and scientists from Britain, the US and Spain used a complex procedure, including gravity data and a few direct measurements of heat flow below Greenland as well as filtered aeromagnetic data, to estimate the variation in Curie depth beneath the ice cap. (Martos, Y.M. et al. 2018. Geothermal heat flux reveals the Iceland hotspot track underneath Greenland. Geophysical Research Letters, v. 45, online publication; doi: 10.1029/2018GL078289). Using that as an inverse proxy for heat flow they were able to map the likely geothermal variation beneath the island. Rather than a random and narrow variation in depth, as would be expected for roughly uniform heat flow, the Curie depth varied in a non-random way by over 20 km, equivalent to roughly 20 mW m-2.
The shallowest Curie depth and highest estimated heat flow occurs in East Greenland around Scoresby Sund where the largest sequence of Palaeocene flood basalts occur. It is also on a line perpendicular to the mid-Atlantic Rift system that meets the active Iceland plume. Running north-west from Scoresby Sund is a zone of locally high estimated heat flow. Martos et al. suggest that this is the track of Greenland’s motion over the Iceland hot spot from about 80 Ma to the period of maximum on-shore volcanism and the start of sea-floor spreading at around 50 Ma.
A fully revised edition of Steve Drury’s book Stepping Stones: The Making of Our Home World can now be downloaded as a free eBook
The 2,300 km stretch of coral reefs and islands in the Coral Sea off the coast of Queensland, Australia is the largest single structure on Earth built by living organisms. The dominant reef builders are four hundred species of coral, most of which are a symbiosis that conjoins marine invertebrates in the class Anthozoa – part of the phylum Cnidaria – and photosynthesising single-celled eukaryotes known as dinoflagellates. These algae are mainly free-living marine plankton, some species of which evolved to be co-opted by corals. Their role in the symbiosis is complex; on the one hand providing energy in the form of sugars, glycerol and amino acids; on the other consuming the coral polyps’ carbon dioxide output. The latter is fixed, in the case of hard corals, by the secretion of calcium carbonate: the key to reef formation.
Marine photosynthesisers demand clear water in the upper few tens of metres of the sea, together with sunlight least affected by the atmosphere, as in the tropics where the sun rises to the zenith year round. The coral animal-algae connection limits reef growth to shallow seas, the top of the reef being close to mean sea level, sometimes rising above it at low tide. Hence the formation of fringing and barrier reefs. In the case of atoll reefs, a connection with sea-floor volcanoes that rose from hotspots on the oceanic abyssal plains to form active volcanic islands that began to sink once they became extinct. The pace at which reefs can grow is generally able to match that of crustal subsidence so that atolls remain throughout the Western Pacific. Reef growth is also capable of coping with global sea-level changes, so that the present top level of the Great Barrier Reef has been in balance with the generally static sea level of the Holocene since the ice caps of the last glaciation melted back to roughly their present extent about seven thousand years ago.
There are many cases of different reef levels on and around islands that match the sea-level fluctuations during the last Ice Age. High-resolution bathymetry produced by multi-beam sonar across the eastern edge of parts of the Great Barrier Reef reveals a series of submerged terraces down to almost 120 m below modern sea-level (Yokoyama, Y. and 17 others 2018. Rapid glaciation and a two-step sea level plunge in the Last Glacial Maximum. Nature, v. 559, p. 603-607; doi:10.1038/s41586-018-0335-4). Globally, the LGM began at around 31 ka when sea level fell by about 40 metres, thanks to massive accumulation of glacial ice at high latitudes. Previous studies to chart the changes in global mean sea level during the LGM suggested a steady fall until about 20 ka, followed by rapid rise as ice caps melted back. The multinational team led by Yusuke Yokoyama of the University of Tokyo, obtained precise ages of coral samples from different depths in drill cores through the coral terraces. These data revealed a more complex pattern of sea-level change, in particular a hitherto unsuspected plunge between 21.9 and 20.5 ka of 20 m to reach -118 m. This immediately preceded the warming-related rise that continued to Holocene levels.
High-resolution sonar images of the sea floor at two sites on the eastern edge of Australia’s Great Barrier Reef. They show terraces associated with, the lowest of which corresponds to the Last Glacial Maximum. (Credit: Yokoyama et al. 2018, Figure 1)
Curiously, this massive phenomenon is not shown by sea-level estimates derived from the records of changing oxygen isotopes in ocean-floor sediments and ice cores. The team’s complex modelling incorporated global changes in land and sea-bed levels, and thus changes in the volume of the ocean basins, due to the changing isostatic effects of both ice-cap and ocean masses. From these it is possible to reach an interesting conclusion (Whitehouse, P. 2018. Ancient ice sheet had a growth spurt. Nature, v. 603, p. 487-488; doi:10.1038/d41586-018-05760-3). Rather than an increase in snowfall onto ice-caps, their retreat may have been hindered by thickening of marginal floating ice shelves that created buttresses around Antarctica and the northern ice sheets. Slowed glacial flow to the oceans could have promoted ice sheet growth for a time as melting of calved icebergs was hindered, especially in the case of the ice sheet over northern North America. Certainly, this crucial climatic turning point was a lot more complex than previously believed.
Followers of Earth-pages News have been unable to access the site for more than three weeks due to a technical problem that disabled the earth-pages.co.uk link. The fault has been found and remedied. Apologies for the loss of service.


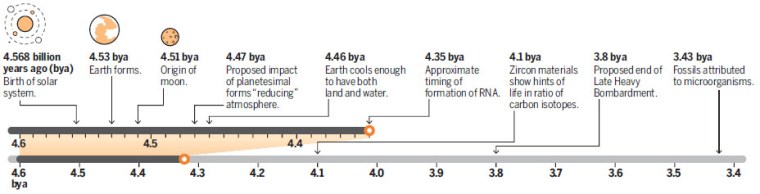

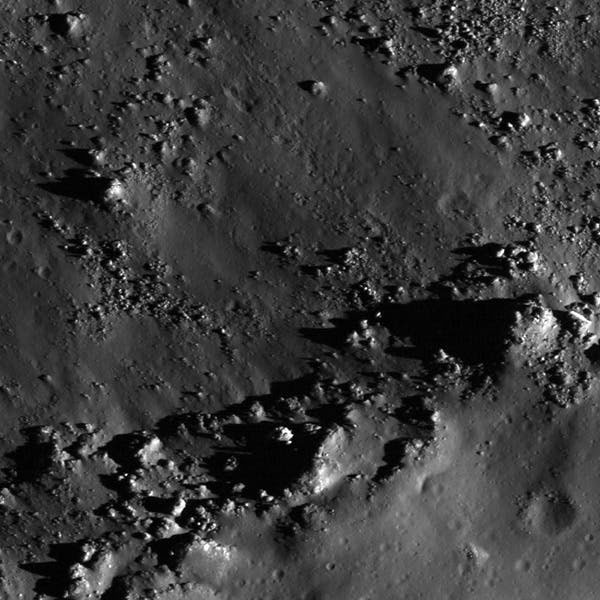


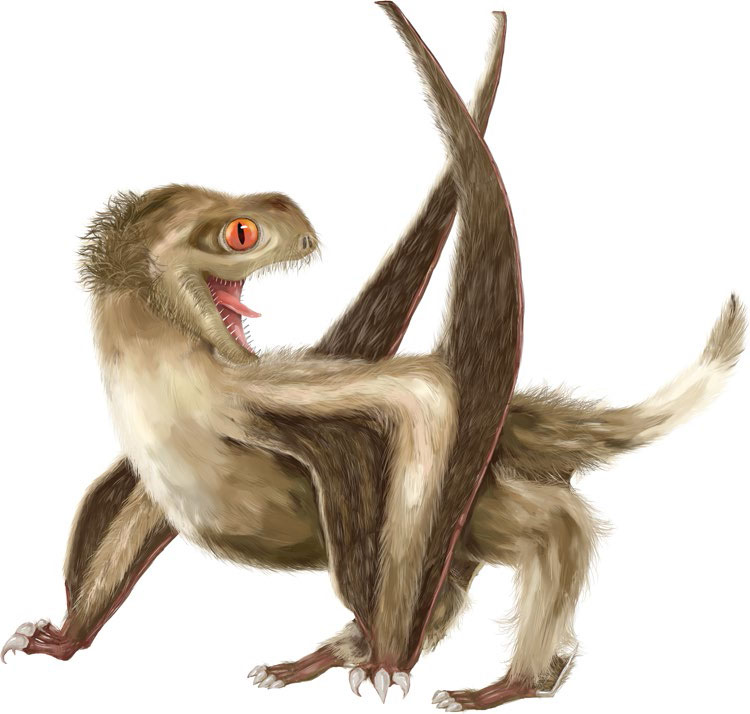


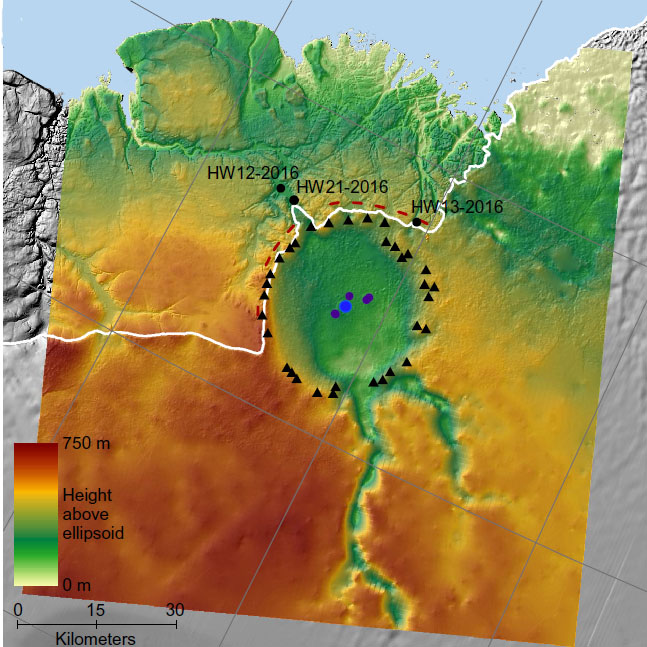


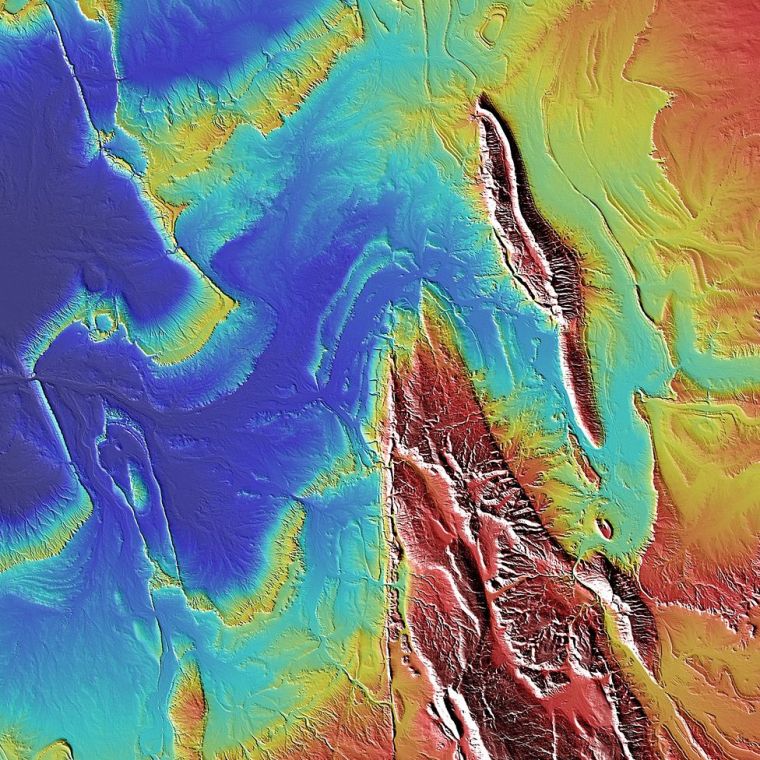


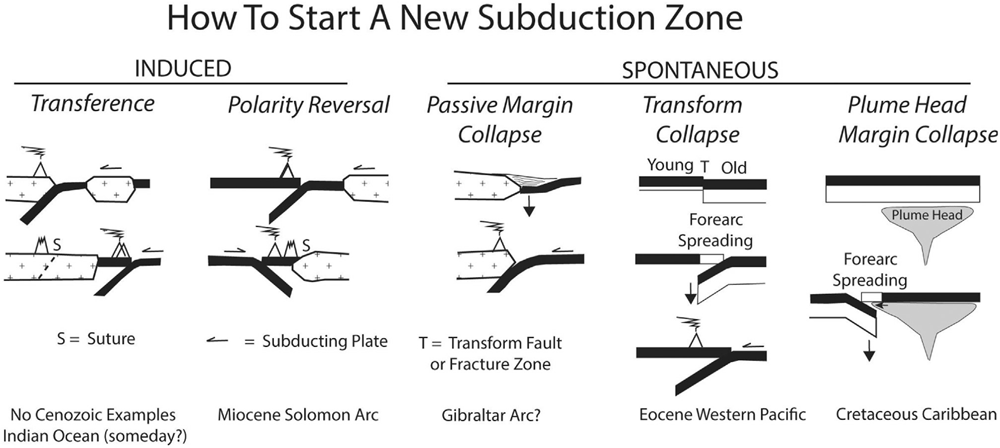


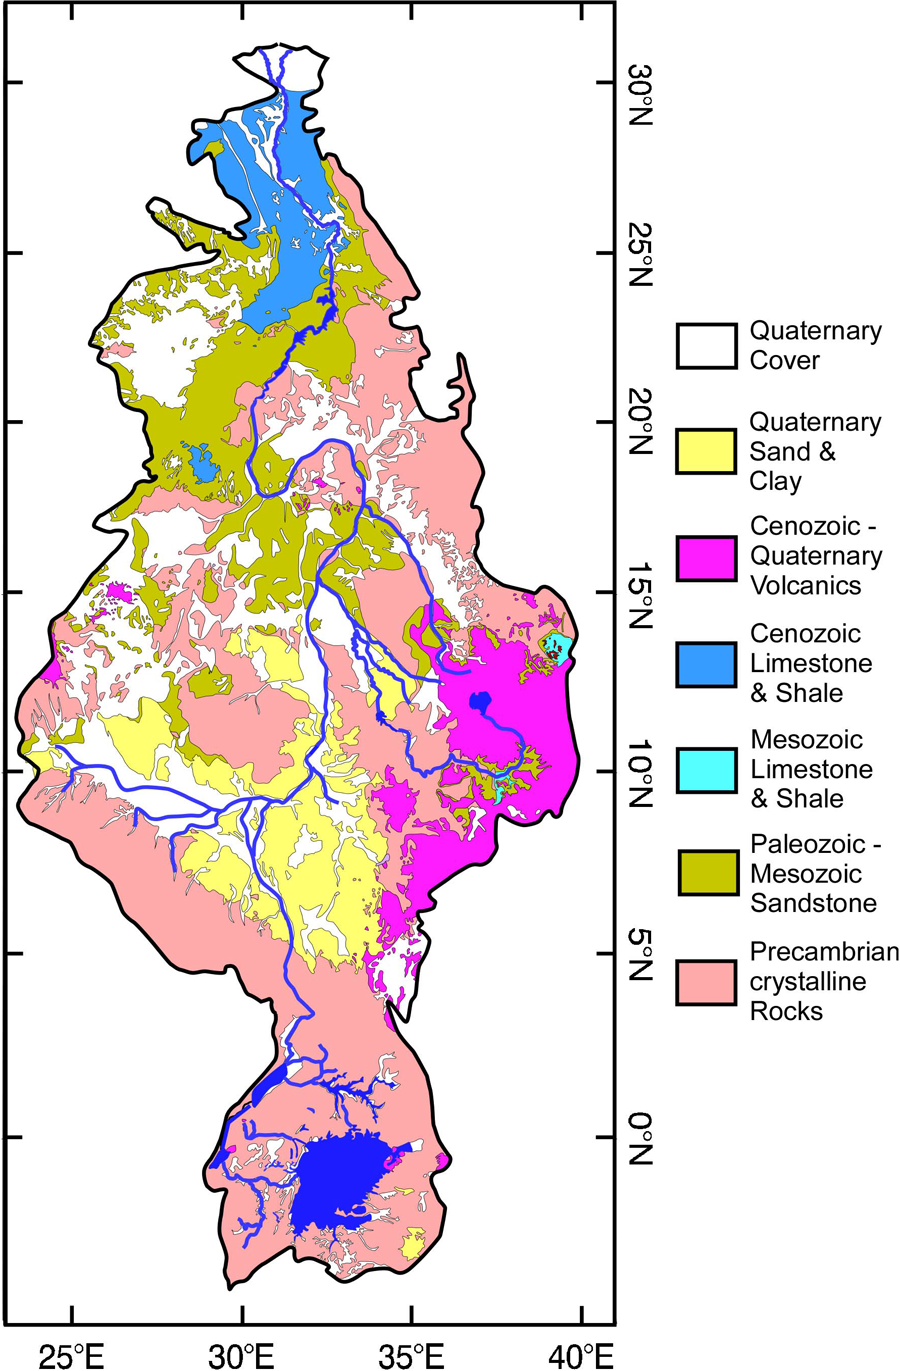

")