
By far the least costly means of surveying the ocean floor on a global scale is the use of data remotely sensed from Earth orbit. That may sound absurd: how can it be possible to peer through thousands of metres of seawater? The answer comes from a practical application of lateral thinking. As well as being influenced by lunar and solar tidal attraction, sea level also depends on the Earth’s gravity field; that is, on the distribution of mass beneath the sea surface – how deep the water is and on varying density of rocks that lie beneath the sea floor. Water having a low density, the deeper it is the lower the overall gravitational attraction, and vice versa. Consequently, seawater is attracted towards shallower areas, standing high over, say, a seamount and low over the abyssal plains and trenches. Measuring sea-surface elevation defines the true shape that Earth would take if the entire surface was covered by water – the geoid – and is both a key to variations in gravity over the oceans and to bathymetry.
Radar altimeters can measure the average height of the sea surface to within a couple of centimetres: the roughness and tidal fluctuations are ‘ironed out’ by measurements every couple of weeks as the satellite passes on a regular orbital schedule. There is absolutely no way this systematic and highly accurate approach could be achieved by ship-borne bathymetric or gravity measurements, although such surveys help check the results from radar altimetry over widely spaced transects. Even after 40 years of accurate mapping with hundreds of ship-borne echo sounders 50% of the ocean floor is more than 10 km from such a depth measurement (80% lacks depth soundings)
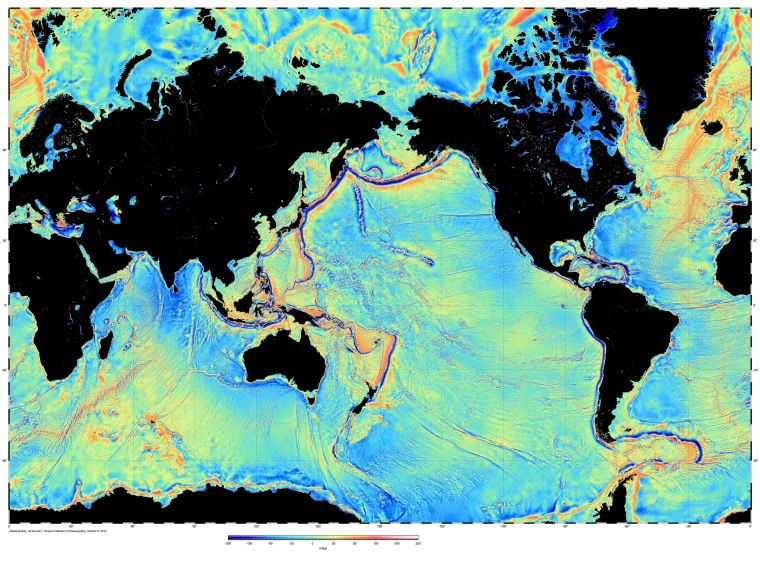
This approach has been used since the first radar altimeter was placed in orbit on Seasat, launched in 1978, which revolutionised bathymetry and the details of plate tectonic features on the ocean floor. Since then, improvements in measurements of sea-surface elevation and the computer processing needed to extract the information from complex radar data have show more detail. The latest refinement stems from two satellites, NASA’s Jason-1(2001) and the European Space Agency’s Cryosat-2 (2010) (Sandwell, D.T. et al. 2014. New global marine gravity model from CryoSat-2 and Jason-1 reveals buried tectonic structure. Science, v. 346. p. 65-67; see also Hwang, C & Chang, E.T.Y. 2014. Seafloor secrets revealed. Science, v. 346. p. 32-33). If you have Google Earth you can view the marine gravity data by clicking here. The maps throw light on previously unknown tectonic features beneath the China Sea (large faults buried by sediments), the Gulf of Mexico (an extinct spreading centre) and the South Atlantic (a major propagating rift) as well as thousands of seamounts.
There are many ways of processing the data, and so years of fruitful interpretation lie ahead of oceanographers and tectonicians, with more data likely from other suitably equipped satellites: sea-surface height studies are also essential in mapping changing surface currents, variations in water density and salinity, sea-ice thickness, eddies, superswells and changes due to processes linked to El Niño.


Reblogged this on Explosive Earth.
LikeLike