Balanced boulders and seismic hazard

The seismometer invented by early Chinese engineer Zhang Heng

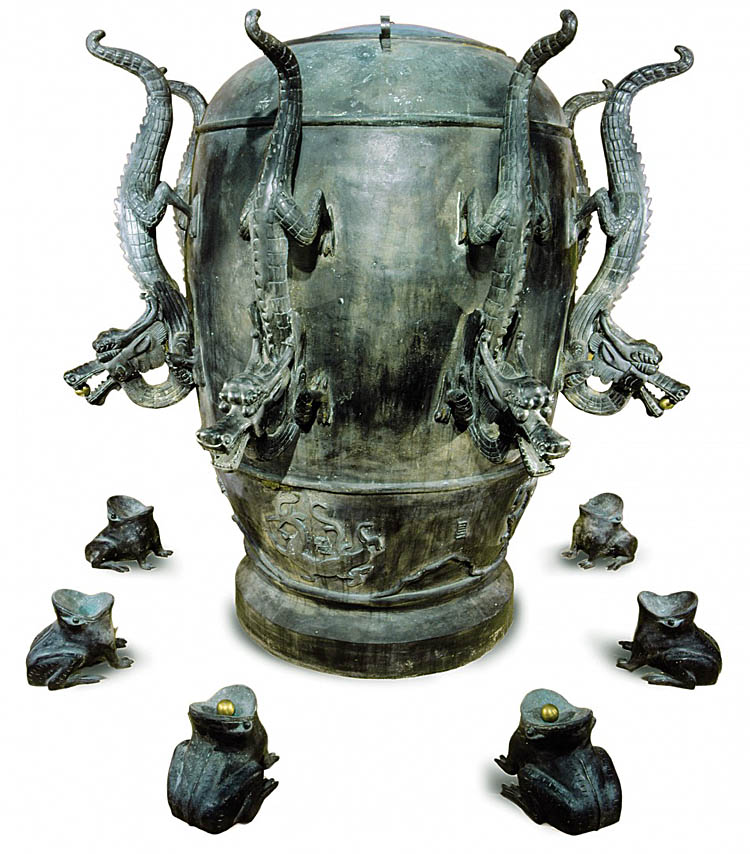
China has been plagued by natural disasters since the earliest historical writings. Devastating earthquakes have been a particular menace, the first recorded having occurred in 780 BC . During the Han dynasty in 132 CE, polymath Zhang Heng invented an ‘instrument for measuring the seasonal winds and the movements of the Earth’ (Houfeng Didong Yi, for short): the first seismometer. A pendulum mechanism in a large bronze jar activated one of eight dragons corresponding to the eight cardinal and intermediate compass directions (N, NE, E etc.) so that a bronze ball dropped from its mouth to be caught by a corresponding bronze toad. The device took advantage of unstable equilibrium in which a small disturbance will produce a large change: akin to a pencil balanced on its unsharpened end. Modern seismometers exploit the same basic principle of amplification of small motions. The natural world is also full of examples of unstable equilibrium, often the outcome of chemical and physical weathering. Examples are slope instability, materials that are on the brink of changing properties from those of a solid to a liquid state (thixotropic materials – see: Mud, mud, glorious mud August 2020) and rocks in which stress has built almost to the point of brittle failure: earthquakes themselves. But there are natural curiosities that not only express unstable equilibrium but have maintained it long enough to become … curious! Perched boulders, such as glacial erratics and the relics of slow erosion and weathering, are good examples. Seismicity could easily topple them, so that their continued presence signifies that large enough tremors haven’t yet happened.

A precarious boulder in coastal central California (credit: Anna Rood & Dylan Rood, Imperial College London)

Now it has become possible to judge how long their delicate existence has persisted, giving a clue to the long-term seismicity and thus the likely hazard in their vicinity (Rood, A.H. and 10 others 2020. Earthquake Hazard Uncertainties Improved Using Precariously Balanced Rocks. American Geological Union Advances, v. 1, ePDF e2020AV000182; DOI: 10.1029/2020AV000182). Anna Rood and her partner Dylan of Imperial College London, with colleagues from New Zealand, the US and Australia, found seven delicately balanced large boulders of silica-rich sedimentary rock in seismically active, coastal California. They had clearly withstood earthquake ground motions for some time. Using multiple photographs to produce accurate digital 3D renditions and modelling of resistance to shaking and rocking motions, the authors determined each precarious rock’s probable susceptibility to toppling as a result of earthquakes. How long each had withstood tectonic activity shows up from the mass-spectrometric determination of beryllium-10 isotopes produced by cosmic-ray bombardment of the outer layer. Comparing its surface abundance relative to that in the rock’s interior indicates the time since the boulders’ first exposure to cosmic rays. With allowance for former support from surrounding blocks, this gives a useful measure of the survival time of each boulder – its ‘fragility age’.

The boulder data provide a useful means of reducing the uncertainties inherent in conventional seismic hazard assessment, which are based on estimates of the frequency of seismic activity, the magnitude of historic ‘quakes, in most cases over the last few hundred years, and the underlying geology and tectonics. In the study area (near a coastal nuclear power station) the data have narrowed uncertainty down to almost a half that in existing risk models. Moreover, they establish that the highest-magnitude earthquakes to be expected every 10 thousand years (the ‘worst case scenario’) were 27% less than otherwise estimated. This is especially useful for coastal California, where the most threatening faults lie off shore and are less amenable to geological investigation.

See also:  Strange precariously balanced rocks provide earthquake forecasting clues. (SciTech Daily; 1 October 2020) 

Judging earthquake risk

The early 21st century seems to have been plagued by very powerful earthquakes: 217 greater than Magnitude 7.0; 19 > Magnitude 8.0 and 2 >Magnitude 9.0. Although some lesser seismic events kill, those above M 7.0 have a far greater potential for fatal consequences. Over 700 thousand people have died from their effects: ~20 000 in the 2001 Gujarat earthquake (M 7.7); ~29 000 in 2003 Bam earthquake (M 6.6); ~250 000 in the 2004 Indian Ocean tsunami that stemmed from a M 9.1 earthquake off western Sumatra; ~95 000 in the 2005 Kashmir earthquake (M7.6); ~87 000 in the 2008 Sichuan earthquake (M 7.9); up to 316 000 in the 2010 Haiti earthquake (M 7.0); ~20 000 in the 2011 tsunami that hit NE Japan from the M 9.0 Tohoku earthquake. The 26 December 2004 Indian Ocean tsunamis spelled out the far-reaching risk to populated coastal areas that face oceans prone to seismicity or large coastal landslips, but also the need for warning systems: tsunamis travel far more slowly than seismic waves and , except for directly adjacent areas, there is good chance of escape given a timely alert. Yet, historically http://earthquake.usgs.gov/earthquakes/world/most_destructive.php, deadly risk is most often posed by earthquakes that occur beneath densely populated continental crust. Note that the most publicised earthquake that hit San Francisco in 1906 (at M 7.8) that lies on the world’s best-known fault, the San Andreas, caused between 700 and 3000 fatalities, a sizable proportion of which resulted from the subsequent fire. For continental earthquakes the biggest factor in deadly risk, outside of population density, is that of building standards.

English: A poor neighbourhood shows the damage...
A poor neighbourhood in Port au Prince, Haiti following the 2010 earthquake measuring >7 on the Richter scale. (credit: Wikipedia)

It barely needs stating that earthquakes are due to movement on faults, and these can leave distinct signs at or near to the surface, such as scarps, offsets of linear features such as roads, and broad rises or falls in the land surface. However, if they are due to faulting that does not break the surface – so-called ‘blind’ faults – very little record is left for geologists to analyse. But if it is possible to see actual breaks and shifts exposed by shallow excavations through geologically young materials, as in road cuts or trenches, then it is possible to work out an actual history of movements and their dimensions. It has also become increasingly possible to date the movements precisely using radiometric or luminescence means: a key element in establishing seismic risk is the historic frequency of events on active faults. Some of the most dangerous active faults are those at mountain fronts, such as the Himalaya and the American cordilleras, which often take the form of surface-breaking thrusts that are relative easy to analyse, although little work has been done to date. A notable study is on the West Andean Thrust that breaks cover east of Chile’s capital Santiago with a population of around 6 million (Vargas, G. Et al. 2014. Probing large intraplate earthquakes at the west flank of the Andes. Geology, v. 42, p. 1083-1086). This fault forms a prominent series of scarps in Santiago’s eastern suburbs, but for most of its length along the Andean Front it is ‘blind’. The last highly destructive on-shore earthquake in western South America was due to thrust movement that devastated the western Argentinean city of Mendoza in 1861. But the potential for large intraplate earthquakes is high along the entire west flank of the Andes.

Vargas and colleagues from France and the US excavated a 5 m deep trench through alluvium and colluvium over a distance of 25 m across one of the scarps associated with the San Ramon Thrust. They found excellent evidence of metre-sized displacement of some prominent units within the young sediments, sufficient to detect the effects of two distinct, major earthquakes, each producing horizontal shifts of up to 5 m. Individual sediment strata were dateable using radiocarbon and optically stimulated luminescence techniques. The earlier displacement occurred at around 17-19 ka and the second at about 8 ka. Various methods of estimation of the likely earthquake magnitudes of the displacements yielded values of about M 7.2 to 7.5 for both. That is quite sufficient for devastation of now nearby Santiago and, worryingly, another movement may be likely in the foreseeable future.

Seafloor mud cores and the seismic record

Chikyu
Japan's deep-sea Drilling Vessel "CHIKYU" Image via Wikipedia

The most important factors in attempting to assess risk from earthquakes are their frequency and the time-dependence of seismic magnitude. Historical records, although they go back more than a millennium, do not offer sufficient statistical rigor for which tens or hundreds of thousand years are needed. So the geological record is the only source of information and for most environments it is incomplete, because of erosion episodes, ambiguity of possible signs of earthquakes and difficulty in precise dating; indeed some sequences are extremely difficult to date at all with the resolution and consistency that analysis requires. One set of records that offer precise, continuous timing is that from ocean-floor sediment cores in which oxygen isotope variations related to the intricacies of climate change can be widely correlated with one another and with the records preserved in polar ice cores. For the past 50 ka they can be dated using radiocarbon methods on foraminifera shells The main difficulty lies in finding earthquake signatures in quite monotonous muds, but one kind of feature may prove crucial; evidence of sudden fracturing of otherwise gloopy ooze (Sakagusch, A. et al. 2011. Episodic seafloor mud brecciation due to great subduction zone earthquakes. Geology, v.39, p. 919-922).

The Japanese-US team scrutinised cores from the Integrated Ocean Drilling Program (IODP) that were drilled 5 years ago through the shallow sea floor above the subduction zone associated with the Nankai Trough to the SE of southern Japan. Young, upper sediments were targeted close to one of the long-lived faults associated with the formation of an accretionary wedge by the scraping action of subduction. Rather than examining the cores visually the team used X-ray tomography similar to that involved in CT scans, which produce precise 3-D images of internal structure. This showed up repeated examples of sediment disturbance in the form of angular pieces of clay set in a homogeneous mud matrix separated by undisturbed sections containing laminations. The repetitions are on a scale of centimetres to tens of centimetres and were dated using a combination of 14C and 210Pb dating (210Pb forms as a stage in the decay sequence of 238U and decays with a half-life of about 22 years, so is useful for recent events). The youngest mud breccia gave a 210Pb age of AD 1950±20, and probably formed during the 1944 Tonankai event, a great earthquake with Magnitude 8.2. Two other near-surface breccias gave 14C ages of 3512±34 and 10626±45 years before present. These too probably represent earlier great earthquakes as it can be shown that mud fracturing and brecciation by ground shaking needs accelerations of around 1G, induced by earthquakes with magnitudes greater than about 7.0. So, not all earthquakes in a particular segment of crust would show up in seafloor cores, most inducing turbidity flow of surface sediment, but knowing the frequency of the most damaging events, both by onshore seismicity and tsunamis, could be useful in risk analysis. In its favour, the method requires cores that penetrate only about 10 m, so hundreds could be systematically collected using simple piston coring rigs where a weighted tube is dropped onto the sea floor from a small craft.