250 million people who live in the drylands of Africa and Asia face a shortage of water for their entire lives. Hundreds of millions more in less drought-prone regions of the ‘Third World’ have to cope repeatedly with reduced supplies. A rapid and effective assessment of how to alleviate the shortfall of safe water is therefore vital. In arid and semi-arid areas surface water storage is subject to a greater rate of evaporation than precipitation, so groundwater, hidden beneath the land surface, provides a better alternative. Rainwater is also lost by flowing away far more quickly than in areas with substantial vegetation. Harvesting that otherwise lost resource and diverting it to storage secure from evaporation – ideally by using it to recharge groundwater – is an equally important but less-used strategy. Securing a sustainable water supply for all peoples is the most important objective that geoscientists can address.
In practice, to assure good quality water supplies to a community in the form of productive wells, surface water harvesting schemes or planning the recharge of exploited aquifers requires skill, a great deal of work and considerable financial resources. Yet in many parts of sub-Saharan Africa and arid areas of Asia knowing where to focus effort and increase the chances of it being fruitful is one the biggest hurdles to overcome. Such reconnaissance – highlighting the most probable localities on geological and hydrological grounds, and screening out those least likely to yield water for drinking and hygiene – depends on details of the geology and topography of the terrain in which needy communities are situated. For most of the Afro-Asian dryland belt adequate geological and topographic maps are in as short supply as potable water itself. Remote sensing combined with an understanding of groundwater storage and surface-water harvesting is a powerful tool for bridging that knowledge gap, and is routinely used successfully in areas blessed with abundances of experienced geoscientists, money and engineering infrastructure. Again, most of the Afro-Asian dryland belt is poorly endowed in these respects.
Having long ago written a textbook on general remote sensing for geoscientists, now out of print (Image Interpretation in Geology (3rd edition): 2001. Nelson Thorne/Blackwell Science), I decided to re-issue revised parts of it framed in the specific context of water exploration in arid and semi-arid terrains, and to add practical case studies and exercises based on a free version of professional image processing and desktop mapping software. Some of the most geologically revealing remotely sensed image data – those from the Landsat series of satellites and the joint US-Japan ASTER system carried by Terra, one of NASA’a Earth Observing System satellites – are now easily and freely available for the whole of the Earth’s land surface. Given basic familiarity with theory and practicalities, a computer and appropriate software together with a moderately fast internet connection there is nothing to stop any geoscientist, university geology student or engineer working in the water, sanitation and hygiene (WASH) sector from becoming a proficient, self-contained practitioner in water reconnaissance. Water Exploration: Remote Sensing Approacheshas that aim. Online access to the theoretical parts is free, and a DVD that combines theory, software, exemplary data and several exercises that teach the use of image processing/desktop mapping software is available at cost of reproduction and postage.
If you visit the website, find what you see potentially useful and wish to know more, contact me through the Comments form at the H2Oexplore homepage.
DNA from the mitochondria of humans who live on all the habitable continents shows such a small variability that all of us must have had a common maternal ancestor, and she lived in Africa about 160 ka ago. Since this was first suggested by Rebecca Cann, Mark Stoneking and Allan Wilson of the University of California, Berkeley in 1987 there has been a stream of data and publications – subsequently using Y-chromosome DNA and even whole genomes – that both confirm an African origin for Homo sapiens and illuminate it. Analyses of the small differences in global human genetics also chart the routes and – using a ‘molecular clock’ technique – the timings of geographic and population branchings during migration out of Africa. As more and better quality data emerges so the patterns change and become more intricate: an illustration of the view that ‘the past is always a work in progress’. The journal Nature published four papers online in the week ending 25 September 2016 that demonstrate the ‘state of the art’.
Three of these papers add almost 800 new, high-quality genomes to the 1000 Genomes Project that saw completion in 2015. The new data cover 270 populations from around the world including those of regions that have previously been understudied for a variety of reasons: Africa, Australia and Papua-New Guinea. All three genomic contributions are critically summarized by a Nature News and Views article (Tucci, S & Akey, J.L. 2016. A map of human wanderlust. http://dx.doi.org/10.1038/nature19472). The fourth paper pieces together accurately dated fossil and archaeological findings with data on climate and sea-level changes derived mainly from isotopic analyses of marine sediments and samples from polar ice sheets (Timmermann, A & Friedrich, T. 2016. Late Pleistocene climate drivers of early human migration. Nature, doi:10.1038/nature19365). Axel Timmermann and Tobias Friedrich of the University of Hawaii have attempted to simulate the overall dispersal of humans during the last 125 ka according to how they adapted to environmental conditions; mainly the changing vegetation cover as aridity varied geographically, together with the opening of potential routes out of Africa via the Straits of Bab el Mandab and through what is now termed the Middle East or Levant. They present their results as a remarkable series of global maps that suggest both the geographic spread of human migrants and how population density may have changed geographically through the last glacial cycle. Added to this are maps of the times of arrival of human populations across the world, according to a variety of migration scenarios. Note: the figure below estimates when AMH may have arrived in different areas and the population densities that environmental conditions at different times could have supported had they done so. Europe is shown as being possibly settled at around 70-75 ka, and perhaps having moderately high densities for AMH populations. Yet no physical evidence of European AMH is known before about 40 ka. Anatomically modern humans could have been in Europe before that time but failed to diffuse towards it, or were either repelled by or assimilated completely into its earlier Neanderthal population: perhaps the most controversial aspect of the paper.
Estimated arrival time since the last continuous settlement of anatomically modern human migrants from Africa (top); estimated population densities around 60 thousand years ago. (Credit: Axel Timmermann University of Hawaii)
The role of climate change and even major volcanic activity – the 74 ka explosion of Toba in Indonesia – in both allowing or forcing an exodus from African homelands and channelling the human ‘line of march’ across Eurasia has been speculated on repeatedly. Now Timmermann and Friedrich have added a sophisticated case for episodic waves of migration across Arabia and the Levant at 106-94, 89-73, 59-47 and 45-29 ka. These implicate the role of Milankovich’s 21 ka cycle of Earth’s axial precession in opening windows of opportunity for both the exodus and movement through Eurasia; effectively like opening and closing valves for the flow of human movement. The paper is critically summarised by a Nature News and Views article (de Menocal, P.B. & Stringer, C. 2016. Climate and peopling of the world. Nature, doi:10.1038/nature19471.
This multiple-dispersal model for the spread of anatomically modern humans (AMH) finds some support from one of the genome papers (Pangani, L. and 98 others 2016. Genomic analyses inform on migration events during the peopling of Eurasia. Nature (online). http://dx.doi.org/10.1038/nature19792). A genetic signature in present-day Papuans suggests that at least 2% of their genome originates from an early and largely extinct expansion of AMH from Africa about 120 ka ago, compared with a split of all mainland Eurasians from African at around 75 ka. It appears from Pangani and co-workers’ analyses that later dispersals out of Africa contributed only a small amount of ancestry to Papuan individuals. The other two genome analyses (Mallick, S. and 79 others 2016. The Simons Genome Diversity Project: 300 genomes from 142 diverse populations. Nature (online) http://dx.doi.org/10.1038/nature18964; Malaspinas, A.-S. and 74 others 2016. A genomic history of Aboriginal Australia. Nature (online). http://dx.doi.org/10.1038/nature18299) suggest a slightly different scenario, that all present-day non-Africans branched from a single ancestral population. In the case of Malaspinas et al. an immediate separation of two waves of AMH migrants led to settlement of Australasia in one case and to the rest of Mainland Eurasia. Yet their data suggest that Australasians diverged into Papuan and Australian population between 25-40 ka ago. Now that is a surprise, because during the lead-up to the last glacial maximum at around 20 ka, sea level dropped to levels that unified the exposed surfaces of Papua and Australia, making it possible to walk from one to the other. These authors appeal to a vast hypersaline lake in the emergent plains, which may have deterred crossing the land bridge. Mallick et al. see an early separation between migrants from Africa who separately populated the west and east of Eurasia, with possible separation of Papuans and Australians from the second group. These authors also show that the rate at which Eurasians accumulated mutations was about 5% faster than happened among Africans. Interestingly, Mallick et al. addressed the vexed issue of the origin of the spurt in cultural, particularly artistic, creativity after 50 ka that characterizes Eurasian archaeology. Although their results do not rule out genetic changes outside Africa linked to cultural change, they commented as follows:
‘… however, genetics is not a creative force, and instead responds to selection pressures imposed by novel environmental conditions or lifestyles. Thus, our results provide evidence against a model in which one or a few mutations were responsible for the rapid developments in human behaviour in the last 50,000 years.Instead, changes in lifestyles due to cultural innovation or exposure to new environments are likely to have been driving forces behind the rapid transformations in human behaviour …’.
Variations in interpretation among the four papers undoubtedly stem from the very different analytical approaches to climate and genomic data sets, and variations within the individual sets of DNA samples. So it will probably be some time before theoretical studies of the drivers of migration and work on global human genomics and cultural development find themselves unified. And we await with interest the pooling of results from all the different genetics labs and agreement on a common data-mining approach.
Vic McGregor (left) and Allen Nutman examine metasedimentary strata at Isua, West Greenland
For decades the record of tangible signs of life extended back to around 3.4 billion years ago, in the form of undulose, banded biofilms of calcite known as stromatolites preserved at North Pole in the Pilbara region of Western Australia. There have been attempts to use carbon-isotope data and those of other elements from older, unfossiliferous rocks to seek chemical signs of living processes that extracted carbon from the early seas. Repeatedly, claims have been made for such signatures being extracted from the 3.7 to 3.8 Ga Isua metasediments in West Greenland. But because this famous locality shows evidence of repeated metamorphism abiogenic formation of the chemical patterns cannot be ruled out. Isua has been literally crawled over since Vic McGregor of the Greenland Geological Survey became convinced in the 1960s that the metasediments could be the oldest rocks in the world, a view confirmed eventually by Stephen Moorbath and Noel Gale of Oxford University using Rb-Sr isotopic dating. There are slightly older rocks in Canada, which just break the 4 Ga barrier, but they were metamorphose at higher pressures and temperatures and are highly deformed. The Isua suprcrustals, despite deformation and metamorphism show far more diversity that geochemically can be linked to many kinds of sedimentary and volcanic rock types.
Two of the Isua addicts are Allen Nutman of the University of Wollongong, Australia and Clark Friend formerly of Oxford Brookes University, UK, who have worked together on many aspects of the Isua rocks for decades. Finally, thanks to melt-back of old snow pack, they and colleagues have found stromatolites that push the origin of life as far back as it seems possible for geoscientists to reach (Nutman, A.P. et al. 2016. Rapid emergence of life shown by discovery of 3,700-million-year-old microbial structures. Nature, v. 537, published online 31 August 2016, doi:10.1038/nature). The trace fossils occur in a marble, formerly a limestone that retains intricate sedimentary structures, which show it to have been deposited in shallow water. The carbon and oxygen isotopes have probably been disturbed by metamorphism, and no signs of cell material remain for the same reason, but the shape is sufficiently distinct from those produced by purely sedimentary processes to suspect that they resulted from biofilm build-up. The fact that they are made of carbonates suggests that they may have been produced by cyanobacteria as modern stromatolites are.
Stromatolite-like structures from a metasediment in the Isua area of West Greenland (credit Allen Nutman, University of Wollongong, Australia)
The age of the structures, about 3.7 Ga, is close to the end of the Late Heavy Bombardment (4. 1to 3.8 Ga) of the Solar System by errant asteroids and comets. So, if the physical evidence is what it seems to be, life emerged either very quickly after such an energetic episode or conditions at the end of the Hadean were not inimical to living processes or the prebiotic chemistry that led to them.
The specimen of Australopithecus afarensis known far beyond the confines of palaeoanthropology as Lucy remains the iconic figure of hominin evolution, 42 years after her discovery by Donald Johanson and Tom Gray near Hadar in the Awash valley of the Afar Depression, Ethiopia. Her skeletal remains were not complete, but sufficient to recognize that they were from the oldest known upright hominin and that they were female, the pelvis having affinities to that of human women rather than other extant apes. Yet her skull was more akin to apes with a brain volume about the same as a modern chimpanzee’s. Part of the reason for her fame stems from being named after a character in a somewhat mystical song by the British pop group, the Beatles, which was played over and over in the palaeontologist’s camp – good job the find wasn’t during the 1990’s acme of gangsta rapper Apache.
Subsequently, the entombing strata were radiometrically dated at around 3.2 Ma. Lucy, in common with most fossils roughly in the human line of descent, has from the outset been the subject of controversy, even at one time being said to be misnamed because of alleged male characteristics; a view swiftly discarded. Like the treasures of Tutankhamun, Lucy’s actual remains have been exhibited far and wide, including a 6-year stay in the US. Fears of damage in transit led the Ethiopian authorities to produce casts for distribution, and Lucy is now restricted to the National Museum in Addis Ababa. As a further precaution, all the actual bones were rendered in digital 3-dimensions using a high-resolution CT scanner during her US sojourn. It is these scans that have led to a surprising development as regards her original fate. Apart from signs of a single carnivore tooth mark, her remains were not devoured by scavengers, nor did early anatomical examinations suggest any sign of disease and she was estimated to have been a young mature female when she died – the cause of death was unknown.
Model of the Lucy (Australopithecus afarensis) in the museum of Barcelona (credit: Wikipedia)
Detailed forensic analysis of the CT scans (Kappelman, J. and 8 others 2016. Perimortem fractures in Lucy suggest mortality from fall out of tall tree. Nature, v. 537, published online 29 August 2016, doi:10.1038/nature19332) revealed far more than did the original bones, including evidence for numerous fractures in Lucy’s limbs, ribs and cranium, many of which are of the compressive or ‘greenstick’ kind. Those in the left ankle and leg bones (talus, tibia, fibula and femur) are compressive and suggest a severe vertical impact of the heel with enough force to smash the strongest bones in the body, driving the hip into the pelvis. Damage to the ribs, pelvis and lower spine (sacrum) is commensurate with a further horizontal, frontal impact of the torso. Arm (humerus), wrist (radius) shoulder blade (scapula) and collar (clavical) bone fractures are typical of injuries sustained when a falling person tries to break a fall by stretching out the arms. Damage to the cranium and lower jaw (mandible) suggest this instinctive defence posture was futile. None of the fractures show signs of healing, so the multiple traumas were immediately fatal.
Forensic reconstruction of how Lucy fell to meet her end. (credit: John Kappelman et al, doi: 10.1038/nature19332)
The traumatic pattern is reminiscent of someone falling onto hard ground from great height; perhaps equivalent to a four- or five-storey building (see animated reconstruction here). In Lucy’s case, the most likely scenario is from a large tree, perhaps while foraging or sleeping in a safe refuge from ground predators. Forensic analysis of newly dead victims of severe falls generally show massive soft tissue damage by penetration of bone fragments or a ‘hydraulic ram effect’ in which abdominal organs are thrust upwards to produce cardiac damage. That Lucy was found almost intact rules out dismemberment by scavengers or transport by flood water. Indeed, the preservation of even tiny slivers of fractured bone seems to suggest her burial in flood plain sediments before decomposition had set in. A question that the authors do not address is whether or not she may have been deliberately interred, which to me seems a possibility that could be drawn from the detailed evidence. I wonder what a modern coroner might conclude: probably misadventure.
What could be more exciting for exobiologists and planetary scientists than to discover that a nearby star is orbited by a planet approximately the same mass as the Earth that may support liquid water: a world in the ‘Goldilocks zone’? It seems that Proxima Centauri, the Sun’s closest companion star (4.2 light years distant), might have such a planet (Anglada-Escudé, G. And 30 others 2016. A terrestrial planet candidate in a temperate orbit around Proxima Centauri. Nature, v. 536, p. 437-440). It is one of 34 candidates found to date with various levels of likelihood for having the potential to produce life and support it. To fit the bill a planet first has to orbit a star at a distance where the stellar energy output is unlikely to vapourise any surface water yet is sufficient to keep it at a temperature above freezing point, i.e. the ‘Goldilocks’ or circumstellar habitable zone is closer to a cool star than to a hot one. Note that the liquid-water criterion requires that the planet also has an atmosphere with sufficient pressure to maintain liquid water. It also needs to have a mass close to that of the Earth (between 0.1 to 5 Earth masses) and a similar density, i.e. a candidate needs to be dominated by silicates so that it has a solid surface rather than being made mainly of gases and liquids.
The location of Alpha Centauri A and B, Proxima Centauri and the Sun in the Hertzsprung-Russell (HR) diagram. (credit: Wikipedia)
Proxima Centauri b, as the planet is called, was not discovered by the Kepler space telescope using the transit method (drops in a star’s brightness as a planet transits across its disk) but by terrestrial telescopes that measure the Doppler shifts in starlight as it wobbles because of the gravitational affect of an orbiting planet. As well as being close, Proxima Centauri is much smaller than the Sun so such effects are more pronounced, especially by planets orbiting close to it. The planet that has excited great interest has an orbital period of only 11.2 Earth days so is much closer to its star and may have a surface temperature (without any greenhouse effect) of 234 K (21 degrees less than that of Earth). The wobble suggests a mass and radius are likely to be 1.3 and between 0.8 to 1.4 times those of Earth, respectively. So Proxima Centauri b is probably a silicate-rich world. But, of course, such limited information gives no guarantee whatever of the presence of liquid water and an atmosphere that can support it. Neither is it possible to suggest a day length. In fact, such a close orbit may have resulted in the planet tidally locked in synchrony with its orbit, in the manner of the Moon showing only one face to the Earth. Moreover, its star is a red dwarf and is known to produce a prodigious X-ray flux, frequent flares and probably a stream of energetic particles, from which only a planet with a magnetic field is shielded. All red dwarfs seem to have such characteristics, and the list of possible Earth-like planets show them to be the most common hosts.
It is too early to get overexcited as technologies for astronomical detection of atmospheres and surface composition are about a decade off at the earliest. Being so close makes it tempting for some space agency to plan sending tiny probes (around 1 gram) using a laser propulsion system that is under development. Anything as substantial as existing planetary probes and certainly a crewed mission is unthinkable with current propulsion systems – a one-way trip of 80 thousand years and stupendous amounts of fuel.
The Biblical Flood is one of several legendary catastrophes that over the millennia have made their way into popular mythology. Indeed, Baron Georges Cuvier explained his stratigraphy of the Paris Basin and fossil evidence for extinctions of animals as the results of repeated inundations. His opinions and those of other scientists of the catastrophist school reflect the philosophical transition that began with the Enlightenment of the 18th century: curiosity and observation set against medieval dogma. It seems that transition is incomplete as there are still people who seek remains of Noah’s Ark and propose alien beings as the constructors of the huge geoglyphs of the Nazka Desert in Peru. On the other hand, Walter Pitman – one of the pioneers of plate tectonics – and his colleague William Ryan sought a rational explanation for the Flood, based in part on a more detailed description of a flodd in the Near East in one of the oldest written documents, the Epic of Gilgamesh (~2150-1400 BCE). In 1996 they published a hypothesis that such flood legends may have arisen from oral accounts of the flooding of the previously cut-off Black Sea basin through the Bosphorus as global sea level rose about 7600 years ago.
Chinese mythology too contains graphic descriptions of catastrophic flooding in the legend of Emperor Yu, first written down at the start of the first millennium BCE. Rather than being a victim or a survivor of catastrophe, Yu is credited with relieving the aftermath of the supposed flood by instigating ingenious systems of dredging and rechanneling the responsible river, and instigating the start of Chinese civilisation and the Xia Dynasty. Such detail conveys a greater air of veracity than a substantial boat containing male and female representatives of all animal species ending up on top of a mountain once Flood waters subsided! Recent research by Quinglong Wu of the School of Archeology at Peking University, together with other Chinese and US colleagues along the Yellow River has nailed the truth of the legend to events in the headwaters of the Yellow River (Wu, Q. and 15 others 2016. Outburst flood at 1920 BCE supports historicity of China’s Great Flood and the Xia dynasty. Science, v. 353, p. 579-582).
Map of the Yellow River from the Qing Dynasty. (Photo credit: Wikipedia)
The team discovered evidence for a huge landslide in a terrace of the Yellow River where it flows through the Jishi Gorge. Probably dislodged by an earthquake, the slide blocked the gorge so that a large lake formed above it. The lake also left sedimentary evidence on the flanks of the gorge, which suggest that it may have been as much as 200 m deep and impounded 12 to 17 km3 of water. Downstream of the gorge sediments of the Guanting Basin contain chaotic sediments characteristic of outburst floods, probably deposited once the landslide dam was breached. 14C dates of charcoal from the outburst flood sediments give a likely age for the massive event of 1922±28 BCE. Astonishingly, remains of three children from a cave near the Yellow River are buried in the flood deposits and provided an age within error of that of the flood: they were victims. Sediments extending to the coast in the North China Plain are the repositories of much of the archaeological evidence for the evolution of Chinese culture along with signs of rates of sedimentation. The definite signs of a catastrophic flood upstream coincides with the transition from Neolithic to Bronze Age artefacts in the Yellow River flood plain.
The extensive active subduction zones around the Pacific ocean are responsible for a dearth of oceanic lithosphere older than about 200 Ma that still remains where it formed. Trying to get an idea of pre-Mesozoic ocean-floor processes depends almost entirely on fragmented ophiolites thrust or obducted onto continent at destructive plate margins. Yet the characteristically striped magnetic signature above in situ oceanic lithosphere offers a good chance of spotting any old oceanic areas, provided the stripes are not imperceptible because of thick sediment cover. One of the most intriguing areas of ocean floor is that beneath the eastern Mediterranean Sea in the 3 km deep Herodotus Basin, which has long been thought to preserve a relic of old ocean floor. Roi Granot of Ben-Gurion University of the Negev, Israel has analysed magnetic data gathered along 7 000 km of survey lines and indeed there are vague traces of stripy geomagnetic variation that has a long wavelength, to be precise there are two bands of . Mathematical analysis of the magnetic profiles suggest that they have a source about 13 to 17 km beneath the seabed: probably crystalline crust beneath thick Mesozoic sediments (Granot, R. 2016. Palaeozoic oceanic crust preserved beneath the eastern Mediterranean. Nature Geoscience, doi:10.1038/ngeo2784).
Ages of oceanic lithosphere (credit: Wikipedia)
The shape of the anomalies cannot be matched with those of younger magnetic stripes, but can be modelled to fit with a sequence of normal-reverse-normal magnetic polarity preserved in continental sequences of early Carboniferous age, about 340 Ma ago. At that age, the lithosphere would by now be old, cold and dense enough to subside to the observed depth, but the fact that it escaped subduction during amalgamation of Pangaea in the Upper Palaeozoic or when Africa collided with Eurasia in the early Cenozoic is a puzzle. Granot reckons that it most likely formed in Pangaea’s great eastern ocean embayment, known as Palaeotethys. An interesting view, but one that does not seem likely to lead any further, simply because of the great depth to which the oceanic material is buried. The deepest yet to be achieved is only 12 km in the onshore Kola Superdeep Borehole in Russia. So the changes of getting samples are slim, even if the overlying sedimentary pile proves to have hydrocarbon potential.
That the Moon formed and Earth’s geochemistry was reset by our planet’s collision with another, now vanished world, has become pretty much part of the geoscientific canon. It was but one of some unimaginably catastrophic events that possibly characterised the early Solar System and those around other stars. Since the mantle geochemistry of the Earth’s precursor was fundamentally transformed to that which underpinned all later geological events, notwithstanding the formation of the protoEarth about 4.57 Ga ago, I now think of the Moon-forming event as our homeworld’s ‘Year Zero’. It was the ‘beginning’ of which James Hutton reckoned there was ‘no vestige’. Any modern geochemist might comment, ‘Well, there must be some kind of signature!’, but what that might be and when it happened are elusive, to say the least. One way of looking for answers is, as with so many thorny issues these days, to make a mathematical model. James Connelly and Martin Bizzarro of the University of Copenhagen, Denmark, have designed one based on the fact that one of the volatile elements that must have been partially ‘blown off’ by such a collision is lead and, of course, that is an element with several isotopes that are daughters of long-term decay of radioactive uranium and thorium (Connelly, J.N. & Bizzarro, M. 2016. Lead isotope evidence for a young formation age of the Earth–Moon system. Earth and Planetary Science Letters, v. 452, p. 36-43. doi:10.1016/j.epsl.2016.07.010).
Artist’s impression of the impact of a roughly Mars-size planet with the proto-Earth to form an incandescent cloud, from part of which the Moon formed. A NASA animation of lunar history can be viewed here.
Loss of volatile daughter isotopes of Pb produced by the decay schemes of highly refractory isotopes of U and Th would have reset the U-Pb and Th-Pb isotopic systems and therefore the radiogenic ‘clocks’ that depend on them in the same way as melting or high-temperature metamorphism resets the simpler 87Rb-87Sr decay scheme. Each radioactive U isotope has a different decay rate that produces a different Pb isotope daughter (235U Þ 207Pb; 238U Þ 206Pb, so it is possible to devise means of using present-day values of ratios between Pb isotopes, such as 207Pb/206Pb, 206Pb/204Pb and 207Pb/204Pb, to work back to such a ‘closure’ time. In short, that is the approach used by Connelly and Bizzarro. The most complicated bit of that geochemical ruse is estimating values of the ratios for the Earth’s modern mantle and for the Solar system in general – a procedure based on what we can actually measure: lots of mantle-derived basalts and lots of meteorites. Cutting out some important caveats, the result of their model is quite a surprise: ‘Year Zero’ on their account was between 4426 and 4417 Ma years ago, which is astonishingly precise. And it is pretty close to the measured age of the of lunar Highland anorthosites – products of fractional crystallisation of the Moon’s early magma ocean – and also to that of the oldest zircons on Earth. But is also about 60 Ma later than previous estimates
The Connelly and Bizzarro paper follows hard on the heels of another with much the same objective (Snape, J.F. and 8 others 2016. Lunar basalt chronology, mantle differentiation and implications for determining the age of the Moon. Earth and Planetary Science Letters, v. 451, p. 149-158. doi.org/10.1016/j.epsl.2016.07.026). Once again omitting a great deal of argument, Snape and colleagues end up with an age for the isotopic resetting of the lunar mantle of 4376 Ma to the nearest 18 Ma; i.e. an age significantly different from that arrived at by Connelly and Bizzarro. So the answer to the question, ‘When was there a vestige of a beginning?’ is, ‘It depends on the model’… Thankfully, neither estimate for ‘Year Zero’ has much bearing on the big, practical questions, such as, ‘When did life form?’, ‘Has there always been plate tectonics?’
Until about 1.8 Ma ago, when early Homo erectus and perhaps other archaic hominins strode into Eurasia, our forerunners lived and evolved on only one continent – Africa. The physical and environmental conditions underlying the steps from a common ancestor with modern chimpanzees through a growing number of upright species are not well charted by the Pliocene and early Pleistocene terrestrial evidence. All that is know of this formative period is that global climate cooled in an oscillating fashion that culminated in the onset of Northern Hemisphere glaciations in the late Pliocene (~3 Ma) and a shift to drier conditions in East Africa around 2.8 Ma suggested by pollen records off the east coast. Marine sediments of the Indian Ocean, Red Sea and Gulf of Aden still offer the most convenient means of charting environmental change in detail for this crucial episode in human history. As well as oxygen-isotope and pollen-type variations, modern core analysis offers a growing number of wind-blown proxies for onshore vegetation. These include organic geochemistry plus carbon and hydrogen isotopes from trace amounts of leaf waxes. During the May to September East African Monsoon, high speed winds in the upper atmosphere drag dusty continental air from the East African Rift System over the Gulf of Aden, making sea-floor sediment an important target for tracking variations in the proxies (Liddy, H.M. et al. 2016. Cooling and drying in northeast Africa across the Pliocene. Earth and Planetary Science Letters, v. 449, p. 430-438. doi:10.1016/j.epsl.2016.05.005). Hannah Liddy and colleagues from the Universities of Southern California and Arizona, USA, applied these techniques to a Gulf of Aden core from offshore Somaliland to open a window on this crucial period.
Early history of hominin evolution and evidence for climate change in East Africa. Based on a diagram at the handprint.com website and in Stepping Stones Chapter 22
Early Pliocene East Africa (5.3 to 4.3 Ma), the time of Ardepithecus ramidus, was characterized by evidence for a climate wet enough to sustain grasses and riverine woodlands. Yet around 4.3 Ma conditions had shifted to ecosystems more dominated by shrubby plants able to thrive in more arid conditions. At about that time the earliest australopithecines appear in the fossil record, with A. anamensis. Yet the later Pliocene was not devoid of grasses or herbivores. There is ample carbon-isotope evidence from the teeth of hominins that shows that after 3.4 Ma the diet of A. afarensis and A. africanus included increasing amounts whose carbon derived from grasses, when. This apparent paradox can be explained by a major turn to eating meat from herbivores as vegetable foods declined with increasing aridity. This is all very interesting, especially the detailed record of δ13C in plant waxes, but there is little to indicate that steps in hominin speciation or extinction had much direct connection with fluctuations in climatic conditions. Environmental change may have formed a background to other influences that may have been wholly down to early hominin’s social and technological behaviour.
It is widely known that glacial ice contains a record of Earth’s changing atmospheric composition in the form of bubbles trapped when the ice formed. That is fine for investigations going back about a million years, in particular those that deal with past climate change. Obviously going back to the composition of air tens or hundreds of million years ago cannot use such a handy, direct source of data, but has relied on a range of indirect proxies. These include the number of pores or stomata on fossil plant leaves for CO2, variations in sulfur isotopes for oxygen content and so on. Variation over time of the atmosphere’s content of oxygen has vexed geoscientists a great deal, partly because it has probably been tied to biological evolution: forming by some kind of oxygenic photosynthesis and being essential for the rise to dominance of eukaryotic animals such as ourselves. Its presence or absence also has had a large bearing on weathering and the associated dissolution or precipitation of a variety of elements, predominantly iron. Despite progressively more clever proxies to indicate the presence of oxygen, and intricate geochemical theory through which its former concentration can be modelled, the lack of an opportunity to calibrate any of the models has been a source of deep frustration and acrimony among researchers.
Yet as is often said, there are more ways of getting rid of cats than drowning them in butter. The search has been on for materials that trap air in much the same way as does ice, and one popular, if elusive target has been the bubbles in crystals of evaporite minerals. The trouble is that most halite deposits formed by precipitation of NaCl from highly concentrated brines in evaporating lakes or restricted marine inlets. As a result the bubbles contain liquids that do a grand job of preserving aqueous geochemistry but leave a lot of doubt as regards the provenance of gases trapped within them. For that to be a sample of air rather than gases once dissolved in trapped liquid, the salt needs to have crystallized above the water surface. That may be possible if salt forms from brines so dense that crystals are able to float, or perhaps where minerals such as gypsum form as soil moisture is drawn upwards by capillary action to form ‘desert roses’. A multinational team, led by Nigel Blamey of Brock University in Canada, has published results from Neoproterozoic halite whose chevron-like crystals suggest subaerial formation (Blamey, N.J.F. and 7 others, 2016. Paradigm shift in determining Neoproterozoic atmospheric oxygen. Geology, v. 44, p. 651-654). Multiple analyses of five halite samples from an ~815 Ma-old horizon in a drill core from the Neoproterozoic Canning Basin of Western Australia contained about 11% by volume of oxygen, compared with 25% from Cretaceous salt from China, 20% of late-Miocene age from Italy, and 19 to 22% from samples modern salt of the same type.
Evaporite salts in the Salar de Atacama Chile (credit: Wikipedia)
Although the Neoproterozoic result is only about half that present in modern air, it contradicts results that stem from proxy approaches, which suggest a significant rise in atmospheric oxygenation from 2 to about 18% during the younger Cryogenian and Ediacaran Periods of the Neoproterozoic, when marine animal life made explosive developments at the time of repeated Snowball Earth events. Whether or not this approach can be extended back to the Great Oxygenation Event at around 2.3 Ga ago and before depends on finding evaporite minerals that fit stringent criteria for having formed at the surface: older deposits are known even from the Archaean.
In 2000 I was approached by Ian Francis, then a commissioning editor at Blackwell Science if I would like to write a series of news items on advances in Earth Science for the publishers’ new website Earth-Pages. The invitation stemmed from his having read my recently published book Stepping Stones: The Making of Our Home World, which threaded a similar path through developments in the science that I helped to teach through the Open University. Ian’s initiative led to my learning a great deal by sifting through leading scientific journals, which became a weekly discipline. Much of what I commented on covered the eclectic spread of Stepping Stones, but I did not think of authoring a revised edition of the book until just a few years before I retired from the Open University in 2011. As they say; ‘what with one thing or another’ it took me another 7 or 8 years to galvanise myself for such a task. If you would like to have a look at the revised edition, it is now on-line at https://earthstep.wordpress.com/.
The famous 3.6 Ma old hominin footsteps at Laetoli in Tanzania – Stepping Stones emblematic image. (Credit: Mary Leakey)
Deciding to produce it in electronic form it occurred to me to make it a possible means of geoscience self-teaching by various devices, such as suggesting key words and phrases to find more in-depth material through a web browser and, equally important, to find useful images. Fifteen years of working on over 800 posts for Earth-Pages and the publications that they were about made revising Stepping Stones a quicker task than I had anticipated. Then it dawned on me that I had written a lot more on various topics for Earth-Pages than I had in the new project. So the Earth-Pages archive is a possibly valuable learning resource, if you can navigate through it, which is not always easy. Being the source for most of the new additions to the book’s Further Reading in, inserting links from each reference to the appropriate post in the Earth-Pages archive was easy.
Oh, and another thing, so few published science authors gain satisfaction from royalties, I decided Stepping Stones v.2.0 should be free!
Two articles in the 14 July issue of Nature make interesting reading for those concerned about many universities’ and education ministries’ enthusiasm for bibliometrics as proxies for research excellence (E-P, January 2015) and their place in the academic equivalent of the Guides Michelin’s star system. Such institutions have become increasingly obsessed by ‘impact factors’. These are a metric applied to individual science journals, and are really quite simple: the average number of citations that articles published by a journal in the previous two years have received in the current year. So, it is supposed, if you get a paper published in a journal with a high impact factor, that can be deemed to be a ‘good thing’; it must it be more excellent than one published in a journal with a lower impact factor. That is a statistically very naive view. Indeed the first article by Nature regular Ewen Callaway (Callaway, E., 2016. Publishing elite turns against impact factor. Nature, v. 535, p. 210-211) implies that it is downright stupid. Citations do not follow a normal distribution; the majority of papers receive far fewer entries in reference lists than the mean of all those published, and that stats have a long tail towards papers with very large numbers of citations. The impact factor is strongly biassed by the much smaller number of papers the ‘go viral’, generally because they excite interest and often point many researchers in new directions. Take the top two science journals, Nature and Science: respectively their impact factors this year are 38.1 and 34.7, but in both 75% of all papers that they published cited less times than the mean. Indeed, a fair number got no citations at all. PLoS Genetics, an on-line, open-access journal of the Public Library of Science, whose throughput of papers is far higher than those of both Nature and Science has a much lower impact value (6.7) but only 65% receive fewer that number citations.
But there seems to be something a bit more sinister going on, to do with massaging the citations for individual papers to give the impression of ‘high impact’ and a long ‘shelf life’ for their influence. The sort of ‘gaming’ that goes on is covered by Mario Biagioli, of the University of California, Davis (Biagioli, M., 2016. Watch out for cheats in the citation game. Nature, v. 535, p. 203). Would you believe that some authors supply journal editors with e-mail addresses for ‘sock-puppet’ peer reviewers to get into print in the first place, and suggest additional references to other work by the authors? There’s more, with rings that effectively trade fake reviews in exchange for citations of the reviewers papers; a lot worse than the familiar practice of self citation. It isn’t necessarily the case that such papers are themselves fraudulent in some way, but to milk the citations cow and tart-up CVs. Biagioli believes that this tendency emerges partly from the drive towards collaborative papers with huge numbers of authors, which again institutions demand in order to be able to say that its research output is international in scope and ‘world-leading’, without being transparently hyperbolic. But skillful individuals can build up bloated reputations with relatively little effort; it’s also possible to guess who they might be. Properly unmasking what Biagioli terms ‘post-production misconduct’ is possible, but only by mining journal databases for evidence, which takes a lot of time. Some of this data analysis is done by journals themselves, pour encourager les autres I suppose, but rarely reported. Biagioli mentions new watchdog groups, Retraction Watch and PubPeer, the latter fostering post-production peer review. But such groups may themselves be gamed, because the ‘pursuit of excellence’ has a competitive side too: overweeningly ambitious academics have tended, until recently, to do the ‘proper thing’ by stabbing one another in the chest in plain view …
As computing power and speed have grown ever more sophisticated models of dynamic phenomena have emerged, particularly those that focus on meteorology and climatology. Weather and climate models apply to the thin spherical shell that constitutes Earth’s atmosphere. They consider incoming solar radiation and longer wavelength thermal radiation emitted by the surface sources and sinks of available power, linked to the convective circulation of energy and matter, most importantly water as gas, aerosols, liquid and ice in atmosphere and oceans. Such general circulation models depend on immensely complex equations that relate to the motions of viscous media on a rotating sphere, modulated by other aspects of the outermost Earth: the absorptive and reflective properties of the materials from which it is composed – air, rocks, soils, vegetation, water in liquid, solid and gaseous forms; different means whereby energy is shifted – speeds of currents and wind, adiabatic heating and cooling, latent heat, specific heat capacity of materials and more still. The models also have to take into account the complex forms taken by circulation on account of Coriolis’ Effect, density variations in air and oceans, and the topography of land and ocean floor. The phrase ‘and much more besides’ isn’t really adequate for such an enormous turmoil, for the whole caboodle has chaotic tendencies in time as well as 3-D space. The fact that such modelling does enable weather forecasting that we can believe together with meaningful forward and backward ‘snapshots’ of overall climate depends on increasing amounts of empirical data about what is happening, where and when. Models of this kind are also increasingly able to address issues of why such and such outcomes occur, an important example being the teleconnections between major weather events around the globe and phenomena such as the El Nino-Southern Oscillation – the periodic fluctuation of ocean movements, winds and sea-surface temperatures over the tropical eastern Pacific Ocean.
The Earth’s 15 largest tectonic plates. (credit: Wikipedia)
The Earth’s lithosphere and deeper mantle in essence present much the same challenge to modellers. Silicate materials circulate convectively in a thick spherical shell so that radiogenic heat and some from core formation can escape to keep the planet in thermal balance. There are differences, the obvious ones being sheer scale and a vastly more sluggish pace, but most important are the interactions between materials with very different viscosities; the ability of the deep mantle to move by plastic deformation while the lithosphere moves as rigid, brittle plates. For geophysicists interested in modelling there are other differences; information that bears on the system is orders of magnitude less, its precision is much poorer and all of it is based on measurement of proxies. For instance, information on temperature comes from variations in seismic wave speed given by analysis of arrival times at surface observatories of different kinds of wave emitted by individual earthquakes. That is, from seismic tomography, itself a product of immensely complex computation. Temptation by computing power and the basic equations of fluid dynamics, however, has proved hard to resist and the first results of a general circulation model for the solid Earth have emerged (Mallard, C. et al. 2016. Subduction controls the distribution and fragmentation of Earth’s tectonic plates. Nature, v. 535, p. 140-143).
As the title suggests, the authors’ main objective was understanding what controls the variety of lithospheric tectonic plates, particularly how strain becomes localised at plate boundaries. They used a circulation model for an idealised planet and examined several levels of a plastic limit at which the rigidity of the lithosphere drops to localise strain. At low levels the lithosphere develops many plate boundaries, and as the plastic limit increases so the lithosphere ends up with increasingly fewer plates and eventually a rigid ‘lid’. The modelling also identified divergent and convergent margins, i.e. mid-ocean ridges and subduction zones. The splitting in two of a single plate must form two triple junctions, whose type is defined by the kinds of plate boundary that meet: ridges; subduction zones; transform faults. Both the Earth and the models show significantly more triple junctions associated with subduction than with extension, despite the fact that ridges extend further than do subduction zones. And these trench-associated triple junctions are mainly those dividing smaller plates. This suggests that it is subduction that focuses fragmentation of the lithosphere, and the degree of fragmentation is controlled by the lithosphere’s strength. There is probably a feedback between mantle convection and lithosphere strength, suggesting that an earlier, hotter Earth had more plates but operated with fewer, larger plates as it cooled to the present. But that idea is not new at all, although the modelling gives support to what was once mere conjecture.
Global warming cannot simply be reversed by turning off the tap of fossil fuel burning. Two centuries’ worth of accumulated anthropogenic carbon dioxide would continue to trap solar energy, even supposing that an immediate shutdown of emissions was feasible; a pure fantasy for any kind of society hooked on coal, oil and gas. It takes too long for natural processes to download CO2 from the atmosphere into oceans, living organic matter or, ultimately, back once more into geological storage. In the carbon cycle, it has been estimated that an individual molecule of the gas returns to one of these ‘sinks’ in about 30 to 95 years. But that is going on all the time for both natural and anthropogenic emissions. Despite the fact that annual human emissions are at present only about 4.5 % of the amount emitted by natural processes, clearly the drawdown processes in the carbon cycle are incapable of balancing them, at present. Currently the anthropogenic excess of CO2 over that in the pre-industrial atmosphere is more than 100 parts per million achieved in only 250 years or so. The record of natural CO2 levels measured in cores through polar ice caps suggests that natural processes would take between 5 to 20 thousand years to achieve a reduction of that amount.
Whatever happens as regards international pledges to reduce emissions, such as those reported by the Paris Agreement, so called ‘net-zero emissions’ leave the planet still a lot warmer than it would be in the ‘natural course of things’. This is why actively attempting to reduce atmospheric carbon dioxide may be the most important thing on the real agenda. The means of carbon sequestration that is most widely touted is pumping emissions from fossil fuel burning into deep geological storage (carbon capture and storage or CCS), but oddly that did not figure in the Paris Agreement, as I mentioned in EPN December 2015. In that post I noted that CCS promised by the actual emitters was not making much progress: a cost of US$50 to 100 per tonne sequestered makes most fossil fuel power stations unprofitable. Last week CCS hit the worlds headlines through reports that an Icelandic initiative to explore a permanent, leak-proof approach had made what appears to be a major breakthrough (Matter, J.M. and 17 others, 2016. Rapid carbon mineralization for permanent disposal of anthropogenic carbon dioxide emissions. Science, v. 352, p. 1312-1314). EPN January 2009 discussed the method that has now been tested in Iceland. It stems from the common observation that some of the minerals in mafic and ultramafic igneous rocks tend to breakdown in the presence of carbon dioxide dissolved in slightly acid water. The minerals are olivine ([Fe,Mg]2SiO4)] and pyroxene ([Fe,Mg]CaSi2O6), from whose breakdown the elements calcium and magnesium combine with CO2 to form carbonates.
Iceland is not short of basalts, being on the axial ridge of the North Atlantic. Surprisingly for a country that uses geothermal power to generate electricity it is not short of carbon dioxide either, as the hot steam contains large quantities of it. In 2012 the CarbFix experiment began to inject a 2 km deep basalt flow with 220 t of geothermal CO2 ‘spiked’ with 14C to check where the gas had ended up This was in two phases, each about 3 months long. After 18 months the pump that extracted groundwater directly from the lave flow for continuous monitoring of changes in the tracer and pH broke down. The fault was due to a build up of carbonate – a cause for astonishment and rapid evaluation of the data gathered. In just 18 months 95% of the 14C in the injected CO2 had been taken up by carbonation reactions. A similar injection experiment into the Snake River flood basalts in Washington State, USA, is said to have achieved similar results (not yet published). A test would be to drill core from the target flow to see if any carbonates containing the radioactive tracer filled either vesicles of cracks in the rock – some press reports have shown Icelandic basalt cores that contain carbonates, but no evidence that they contain the tracer .
Although this seems a much more beneficial use of well-injection than fracking, the problem is essentially the same as reinjection of carbon dioxide into old oil and gas fields; the high cost. Alternatives might be to spread basaltic or ultramafic gravel over large areas so that it reacts with CO2 dissolved in rainwater or to lay bear fresh rocks of that kind by removal of soil cover.
A few months after the diminutive hominin fossil Homo floresiensis, which because of its relatively large feet was quickly dubbed the ‘Hobbit’, turned out to be considerably older than previously thought it hit has the headlines again because its ancestors may have colonized the Indonesian island of Flores far earlier still. A pair of articles in the 9 June 2016 issue of Nature consider evidence from another site on the island where fluvial sediments offer more easily interpreted stratigraphy than the complex Liang Bua cave assemblage where the original skeletal remains were unearthed. The site in the So’a Basin became an important target for excavation following the discovery there in the 1950’s of stone artefacts, east of Wallace’s Line – a fundamental faunal and floral divide once thought to be due to the difficulty of crossing a deep, current-plagued channel in the Indonesian archipelago. The unexpected presence of artefacts drew palaeoanthropologists from far afield, but it was almost 50 years later before their exploration yielded hominin remains.
Homo floresiensis (credit: Wikipedia)
One of the papers reports sparse new finds of hominin material from the So’a Basin, a fragment of mandible and 6 isolated teeth thought to be from at least three individuals (van den Bergh, G.D. et al., 2016. Homo floresiensis-like fossils from the early Middle Pleistocene of Flores. Nature, v. 534, p. 245-248). The other covers newly discovered artefacts, the stratigraphic and palaeoecological setting, and radiometric dates of the finds (Brumm, A. and 22 others, 2016. Age and context of the oldest known hominin fossils from Flores. Nature, v. 534, p. 249-253). The jaw fragment shows signs of having once held a wisdom tooth, showing that it belonged to an adult. Yet although it resembles the dentition of the younger Liang Bua specimens, it seems more primitive and is even smaller. The other dental finds are most likely to be deciduous teeth of juveniles. Fission-track, uranium-series and 40Ar/39Ar dating indicates that the fossils entered the sediments about 700 ka ago. But tools and remains of prey animals in deeper sedimentary layers here and at other Flores sites indicate the presence of hominins back as far as about 1 Ma, before which there are no such signs.
So, at least a million years ago Flores was colonised by hominins. Either the original immigrants were uniquely small compared with other hominins of that vintage in Asia and Africa, or within 300 ka they had decreased in size through the evolutionary influence of limited resources on Flores and the process of island dwarfism. The second may also have been influenced by an initially small population of migrants or a later population ‘bottleneck’ that added a loss of genetic variability – a founder effect. These two alternatives may point respectively to either the even earlier migration out of Africa and across most of Asia of perhaps H. habilis, or the dwarfing of a limited population of H. erectus who made their way there from their known occupation of Java. The authors painstaking analysis of the meagre remains suggest a closer dental resemblance to Asian Homo erectus than to earlier African hominins, so the second alternative seems more likely. However, even that scenario poses palaeoanthropology with a major problem; yet another evolutionary process that helps cryptify the links among our earlier relatives. (See also: Gomez-Robles, A., 2016. The dawn of Homo floresiensis. Nature, v. 534, p. 188-189.)
Neanderthals were well equipped and undoubtedly wore clothing, made shelters, hunted, used fire and famously lived in caves. Deliberate burial of their dead, in some cases arguably with remains of flowers, indicates some form of ritual and belief system. Those in Spain wore necklaces and pendants of bivalve shells, some of which retain evidence of having been painted. Excavators there even found a paint container and painting tools made of small bones from a horse’s foot. The container and tools retain traces of the common iron colorants goethite, jarosite and hematite. One large, perforated scallop shell, perhaps used as a pectoral pendant, shows that its white interior was painted to match its reddish exterior. Given the evidence for adornment by earlier hominins, to find that Neanderthals created art should not be surprising. In May 2016 it emerged that about 177 thousand years ago and earlier, they had broken stalagmites off the cave roof to create curious semi-circular structures in Bruniquel Cave near Montauban in southern France (Jaubert, J. and 19 others, 2016. Early Neanderthal constructions deep in Bruniquel Cave in southwestern France. Nature, v. 533, online publication, doi:10.1038/nature18291). Each of the structures contains incontrovertible evidence that fires were made within them. Rather than being near the well-lit cave entrance the structures are more than 300 m deep within the cave system surrounded by spectacular stalagmites and stalactites that are still in place. Were the structures younger than 42 ka they would probably have been attributed to the earliest anatomically modern Europeans and to some ritual function. Instead they were made during the climatic decline to the last but one glacial maximum.
Apart from ancient detrital zircons no dated materials from the Earth’s crust come anywhere near the age when our home world formed, which incidentally was derived by indirect means. Hutton’s famous saying towards the close of the 18th century, ‘The result, therefore, of our present enquiry is, that we find no vestige of a beginning, – no prospect of an end’ seems irrefutable. Hardly surprising, you might think, considering the frantic pace of events that have reworked the geological record for four billion years and convincing evidence that not long after accretion the Moon-forming collision may have melted most of the early mantle. But there is a way of peering beyond even that definitive catastrophe. The metal tungsten, as anyone from the steel town of Rotherham will tell you, alloys very nicely with iron and makes it harder, stronger and more temperature resistant. Most of the Earth’s original complement of tungsten probably ended up in the core; it is a siderophile element. But traces can be detected in virtually any rock and, of course, in W-rich ore bodies. Its interest to modern-day geochemists lies in its naturally occurring isotopes, particularly 182W, a proportion of which forms by decay of a radioactive isotope of hafnium (182Hf). Or rather it did, for 182Hf has a half-life of about 9 million years. Only a vanishingly small amount from a nearby supernova that may have triggered formation of the solar system remains undecayed.
Artistic impression of the early Earth before Moon formation. (Source: Creative Commons)
A sign of the former presence of 182Hf in the early Earth comes from higher amounts of its daughter isotope 182W in some Archaean rocks (3.96 Ga) than in younger rocks. That excess is probably from undecayed 182Hf in asteroidal masses that bombarded the Earth between 4.1 and 3.8 Ga. Now it turns out that some much younger flood basalts from the Ontong Java Plateau on the floor of the West Pacific Ocean (~120 Ma) and Baffin Island in northern Canada (~60 Ma) also contain anomalously high 182W/184W ratios (Rizo, H. et al. 2016. Preservation of Earth-forming events in the tungsten isotopic composition of modern flood basalts. Science, v. 352, p. 809-812; see also: Dahl, T.W. 2016. Identifying remnants of early Earth. Science, v. 352, p. 768-769). A different explanation is required for these occurrences. The flood basalts must have melted from chemically anomalous mantle, which originally contained undecayed 182Hf. The researchers have worked out that this heterogeneity stems from a silicate-rich planetesimal that had formed in the first 50 Ma of the solar system’s history, and was accreted to the Earth before the Moon-forming event – lunar rocks formed after 182Hf became extinct. That catastrophe and the succeeding 4.51 Ga of mantle convection failed to mix the ancient anomaly with the rest of the Earth.
The word ‘monster’ has its origin in the Latin monere ‘to warn’ but has broadened out in its usage. It has even reverted to its origins as a verb: a highly critical, verbal attack. But I prefer ‘something about which one needs to be warned’, and the Tully Monster encapsulates that meaning. It once lived in Illinois, specifically at just a single location, Mazon Creek, where thousands of them have been seen. But should you be especially fearful of Tullimonstrum gregarium? Well, at first sight, no; it’s only about 10 cm long and apparently has no proper bones and it’s dead. The first was spotted in a coal-mine waste heap by Francis Tully in 1958, a pipefitter with an interest in Carboniferous fossils. Two years after his death in 1987, he and his monster were honoured by a bill that the Illinois State Legislature passed to make it the official State Fossil.
Artist’s impression of the Carboniferous Tully Monster (Tullimonstrum gregarium) (credit: Sean McMahon, Yale University)
It seems to have become a ‘monster’ by stumping all previous attempts to categorise it; so much so that it long served as a warning to eager palaeontologists not to tangle with its taxonomy. That’s not surprising, because as well as bearing a passing resemblance to Captain Nemo’s submarine in Jules Verne’s 20 000 leagues Under the Sea, it has some truly astonishing features. Portholes down its sides are not the weirdest – actually they are gill openings. It has a biting apparatus at the end of an absurdly lengthy forward protuberance, that would not be unexpected if it were one of those fish from the Amazon that, you know, men really ought to be warned about. Most of us would not share a bath with it if we had been. And then, there are the eyes on the ends of a dorsal bar which would give Tullimonstrum gregarium superb stereoscopic vision to guide it unerringly to its target, lashing its efficient-looking caudal fin. The fact that it has only a single nostril is merely puzzling by comparison.
Six decades on, Victoria McCoy of Yale University (now at Leicester University, UK) and 15 undeterred colleagues have pored over more than 1200 Tully Monster fossils and seem to have cracked its affinities (McCoy, V.E. et al. 2016. The ‘Tully monster’ is a vertebrate. Nature, v. 532, p. 496-499). In fact, it’s surprising that it has remained an enigma for so long, because McCoy and colleagues have documented almost every aspect of its anatomy, available from a huge number of superbly preserved specimens – teeth, fin, muscle traces, gills, nostril, notochord, gut and so on. As well as being a vertebrate, its dreadful proboscis is very like that of the Cambrian oddity Opabinia from the Burgess Shale. A separate study by four British palaeontologists and a Texan concentrated on the eyes using electron microscopy and found ‘ultrastructural details’, including pigment cells (Clements, T. et al. 2016. The eyes of Tullimonstrum reveal a vertebrate affinity. Nature, v. 532, p. 500-503) which unequivocally confirm that it is a vertebrate. It has all the hallmarks of being related to lampreys and hagfishs. They devour rotting, drowned corpses.
In 2004 a newly discovered hominin fossil from the Indonesian island of Flores made headlines worldwide. Although an adult, it was tiny – about a metre tall, had a commensurately small brain (the size of a grapefruit), had made tools and hunted small elephants and giant rats. Dates from the cave floor sediments that had entombed it gave ages as young as 13 to 11 thousand years and as far back as 850 ka. So H. floresiensis was regarded as being the last human to share the Earth with us; that is, if it was a different species rather than a product of evolutionary shrinkage of anatomically modern humans stranded and isolated on the island for a very long time. Then there was talk among locals of the legendary Ebo Go-Go, with whom their ancestors had shared the island – they had arrived between 35 to 55 thousand years ago.
Homo floresiensis (the “Hobbit”) ( credit: Wikipedia)
Unsurprisingly, a major controversy raged in palaeoanthropology circles, between those who demanded either island dwarfism or congenital deformity of modern humans, and the other camp focused on many anatomical differences that pointed to a bona fide companion to later immigrants who perhaps survived into modern times. The ‘Hobbit’ became a cause celebre, but many of the original protagonists are now left with the proverbial egg on their faces. The cave sediments turn out to have a much more complex stratigraphy than previously thought, following further excavations led by the original discoverer Thomas Sutikna of the Pusat Penelitian Arkeologi Nasional in Jakarta Indonesia (Sutikna, T. and 19 others 2016. Revised stratigraphy and chronology for Homo floresiensis at Liang Bua in Indonesia. Nature, v. 532, p. 366-369.
Liang Bua cave on Flores island, Indonesia, where the remains of Homo floresiensis were discovered in 2003. (credit: Wikipedia)
The delayed appearance of the revision is hardly surprising, given the lengthy political squabbles surrounding access to the site. And neither are the outcomes, for cave sediments are notoriously tricky because of their episodic reworking by cave floods and roof falls, together with the difficulty in finding materials suited to dating in tropical settings. The original charcoal used in radiocarbon dating and sand grains subject to the thermoluminescence method were in fact from a unit that lies unconformably against the stratum that hosted the fossils. More sophisticated luminescence dating of the actual fossil-hosting sediments yield ages between 100 to 60 ka, tool-bearing units range from 190 to 50 ka. The origins of H. floresiensis are thus pushed back beyond the date of supposed colonisation by H. sapiens, and remain an open question.
The Kepler Space Telescope launched in 2009 was designed to detect and measure planetary bodies orbiting other stars. It was hoped that it would help slake the growing thirst for signs of alien but Earth-like worlds, extraterrestrial life and communications from other sentient beings. Results from the Kepler mission have, however, fostered a growing awareness that all is not well with the simple, Laplacian formation of planetary systems. For a start not one of the thousands of exoplanets revealed by Kepler is in a planetary system resembling the Solar System, let along sharing crucial attributes with the Earth. Giant planets occur around only a tenth of the stars observed, and even fewer in stable, near-circular orbits. Although it is early days in the quest for Earth- and Solar System look-alikes, some unexpected contrasts with the Solar System are emerging. For instance, many of the systems have far more mass in close orbit around their star, including gas giants with orbital periods of only a few days and giant rocky planets. Such configurations defy the accepted model for the Solar System where an outward increase in the proportion of volatiles and ices was thought to be the universal rule. Could these ‘hot Jupiters’ have formed further out and then somehow been dragged into scorching proximity to their star? Answers to this and other questions have been sought from computer simulations of the evolution of nebulas. Inevitably, the software has been applied to that of the Solar System, and the results are, quite literally, turning ideas about its early development inside out (Batygin, K., Laughlin, G. & Morbidelli, A., 2016. Born of chaos. Scientific American, v. 314(May 2016), p. 20-29).
An artist’s impression of a protoplanetary disk (credit: Wikipedia)
It seems that at some stage in its growth from the protoplanetary disk the gravitational influence of a planet creates mass perturbations in the remainder of the disk. These feed back to the planet itself, to others and different parts of the disk to create complex and continuously evolving motions; individual planets may migrate inwards, outwards or escape their star’s influence altogether in a chaotic, unpredictable dance. Ultimately, some balance emerges, although that may involve the star engulfing entire worlds and other bodies ending up in interstellar space. It may also end up with worlds dominated by ‘refractory’ materials – i.e. rocky planets like Earth – orbiting further from their star than those composed of ‘volatiles’. In the case of the early Solar System the modelling revealed Jupiter and Saturn drifting inwards and dragging planetesimals, dust, ice and gas with them to create a gap in the protoplanetary disk. Within about half a million years the two giant planets became locked in their present orbital resonance, which changed the distribution of angular momentum between them and reversed their motion to outward. The clearing of mass neatly explains the asteroid belt and Mars’s otherwise inexplicably small size.
One of the characteristics emerging from Kepler’s discoveries is that ‘super Earths’ orbit close to their star in other systems. Had they existed in the early Solar System the inward drive of Jupiter and Saturn and their ‘bow wave’ of smaller bodies would have had consequences. Swarms of matter from the ‘bow wave’ captured and dissipated angular momentum from the super Earths and dissipated it within a few hundred thousand years, thereby pushing them into death spirals to be consumed by the Sun. This explains what by comparison with Kepler data is a mass deficit in the inner Solar System. The rocky planets – Mercury, Venus, Earth and Mars – accreted from the leftovers, perhaps over far longer periods than previously thought.
Intense bombardment of the Moon and the Earth took place during the first half billion years after they had formed, rising to a crescendo in its later stages. Formation of the mare basins brought it to a sudden close at 3.8 Ga, which coincides with the earliest evidence for life on Earth. Lunar evidence indicates that this Late Heavy Bombardment spanned 4.1 to 3.8 Ga. Previously explained by a variety of unsatisfying hypotheses it forms part of the new grand modelling of jostling among the giant planets. Once Jupiter and Saturn together with Uranus and Neptune had stabilised, temporarily, they accumulated lesser orbital perturbations from an outlying disk of evolving dust and planetesimals throughout the Hadean Eon. Ultimately, around 4.1 Ga, the giant planets shifted out of resonance, pushing Jupiter slightly inwards to its current orbit and thrusting the other 3 further outwards. Incidentally, this may have flung another giant planet out of solar orbit to the void. Over about 300 million years they restabilised their orbits through gravitational interaction with the Kuiper belt but at the expense of destabilising the icy bodies within it. Some fled inwards as a barrage of impactors, possibly to deliver much of the water in Earth’s oceans. By 3.8 Ga the giants had settled into their modern orbital set-up; hopefully for the last time.
About 9 months ago NASA’s New Horizons spacecraft flew past the binary dwarf planets Pluto and Charon more than 9 years after launch. Everyone knew they would be frigid little worlds but the great risk was that they might turn out to be geologically boring. The relief when the first images finally arrived – New Horizons’ telecoms are pretty slow – was obvious on the faces at mission control. Even non-Trekkies, such as me, will be thrilled by the first in-depth, illustrated account (Moore, J.M. and 41 others 2016. The geology of Pluto and Charon through the eyes of New Horizons. Science, v. 351, p. 1284-1293), part of a five-article summary of early findings; the other 4 are on-line and scheduled for full publication later (summaries in Science, 18 March 2016, v. 351, p. 1280-1284). A gallery of images can be seen here and an abbreviated summary of the series here.
Pluto imaged in approximately natural colour by New Horizons. (credit: NASA)
They are astonishing places, even at a resolution of only about 1 km (270 m for some parts), and only one fully illuminated hemisphere was imaged for each because of the short duration of the fly-by. Pluto is by no means locked in stasis, for one of its largest features, Sputnik Planum, is so lightly cratered that is must be barely 10 Ma old at most. It is a pale, heart-shaped terrane dominated by smooth plains, which have a tiled or cellular appearance, with flanking mountains up to 9 km high that appear to be a broken-up chaos. Much of it is made of frozen nitrogen, carbon monoxide and methane. The dominant nitrogen ice has low strength which accounts for the large area of very low relief. The highly angular mountains are water ice that is buoyant and stronger relative to the others making up Sputnik Planum. Across the plain are areas of pitting and blades that seem to have formed by ice sublimation (solid to gas phase transitions) much like terrestrial snow or ice fields that have begun to degrade, and there are even signs of glacier-like flow.
4 Ga old cratered, upland terranes surrounding Sputnik Planum display grooved, ‘washboard’ and a variety of other surface textures reminiscent of dissection. The may have formed by long-term lateral flow (advection) of nitrogen ice and perhaps some melting. It is in this rugged part of Pluto that colour variation is spectacular, with yellows, blues and reds, probably due to deposition of hydrocarbon ‘frosts’ condensed from the atmosphere. That Pluto is still thermally active is shown by a few broad domes with central depressions that suggest volcanism, albeit with a magma made of ices. Areas of aligned ridges and troughs provide signs of tectonics, possibly extensional in nature.
Charon imaged in approximately natural colour by New Horizons. (credit: NASA)
Charon shows little sign of remaining active and capable of remoulding its surface. The hemisphere that has been imaged is spectacularly bisected by a 200 km wide belt of roughly parallel escarpments, ridges and troughs with a relief of about 10 km. Superimposed by large craters the extensional system probably dates back to the early history of the outer Solar System. Dominated by water ice it seems that Charon’s surface may have lost any more volatile ices by sublimation and loss to space. This suggests that superficial differences between two small worlds of similar density may be explained by Charon’s lower mass and gravitational field, resulting in the loss of its most volatile components that partly veneer the surface of Pluto.
Being hugely distant from any other sizeable body it is likely that the energy used to form cryovolcanic eruptions and deform the surface of both dwarf planets is due to internal radioactivity. Their similar mean density around 1.9 implies rocky cores that could host the required unstable isotopes. Being the only Kuiper Belt objects that have been closely examined naturally suggests that the rest of the myriad bodies that clutter it are similar. There are currently as many as 9 other sizable bodies suspected of eccentrically orbiting the Sun in the Kuiper Belt, including one that may be ten times more massive than Earth – a candidate for a ninth planet to replace Pluto, which was removed from that status following redefinition in 2006 of what constitutes a bona fide planet.
Palaeogeneticists certainly have the bit between their teeth as DNA sequencing methods become faster and more productive and statistical methods of sequence analysis and comparison are made more powerful. Only last month I reported on the two-way breeding unearthed from the data on single-chromosome DNA extracted from Croatian and Spanish Neanderthals, as well as some of the tangible inheritance from Neanderthals found in living non-African people. Now a team of statisticians, anthropologists and genetic sequencers have applied the new approaches to the genomes of over 1500 non-Africans, including 35 living Melanesian people from Papua-New Guinea (Vernot, B. and 16 others 2016. Excavating Neandertal and Denisovan DNA from the genomes of Melanesian individuals. Science, v. 351 doi:10.1126/science.aad9416). Melanesians had previously shown evidence of hybridization with both Neanderthals and Denisovans. The most interesting outcome is that the analyses pointed towards yet more instances of interbreeding between ancestors of modern non-Africans and Neanderthals. Many East Asians have 3 Neanderthals in their family trees, for Europeans and South Asians the score is 2, while Melanesians show descent from one Neanderthal and one Denisovan. Moreover, it emerges that interbreeding episodes were at different times among different populations since anatomically modern humans migrated from Africa, beginning perhaps as long ago as 130 ka and recurring later, after different regional groups of AMH had proceeded on their separate ways.
Melanesia, a cultural and geographical area in the Pacific. (credit: Wikipedia)
A second study (Sankararaman, S. et al. 2016. The combined landscape of Denisovan and Neanderthal ancestry in modern humans. Current Biology, v. 26, p. 1-7) has teased out evidence for Denisovan ancestry among South Asians, their admixture with Melanesians after that group acquired Neanderthal forebears, and significant signs of dwindling fertility among hybrid males.
Early 2016 has been very fertile as regards palaeoanthropology. Katherine Zink and Daniel Lieberman of Harvard University focus on the small teeth of Homo erectus and later humans, wondering if they arose following a major shift in culinary practices (Zink, K.D. & Lieberman, D.E. 2016. Impact of meat and lower Palaeolithic food processing techniques on chewing in humans. Nature, v. 531, p. 500-503). Their work is based on experiments to discover how much chewing is needed to make it possible to swallow different uncooked foodstuffs (assuming that cooking did not arise until after 500 ka). It seems that simply introducing meat to the diet would have reduced mastication by around 13% (2 million chews) per year, with a 15% reduction in applied chewing force. Simply slicing and pounding takes out another 750 thousand annual chews and gives a 12% fall in average biting force. So, here’s a link between tools and human gnashers as well as with development of the hand. Fascinating, perhaps, but every hominin species since 7 Ma old Sahelanthropus tchadensis had far smaller canine teeth than are the norm among non-hominin living and fossil apes. Something else was going on with dentition during our evolution, which may have been a loss of the need for threatening teeth. From ‘Do that again and I’ll bite you’, to ‘Let’s chew this over’…
Readers may recall my occasional rants over the years against the growing bandwagoning for an ‘Anthropocene‘ epoch at the top of the stratigraphic column. I , for one, was delighted to find in the latest issue of GSA Today a more sober assessment of the campaign by two stratigraphers who are well placed to have a real say in whether or not the ‘Anthropocene’ is acceptable, one serving on the International Commission on Stratigraphy, the other on the North American Commission on Stratigraphic Nomenclature (Finney, S.C. & Edwards, L.E. 2016. The “Anthropocene” epoch: Scientific decision or political statement? GSA Today, v. 26 (3–4).
These days, leading British politicians burdened with power have a tendency to show outwardly that they are, if little else, earnest. When busy with economic and industrial policy they wear tailored day-glo hi-viz suits and shiny new hard hats. During the great 2015 floods of Northern England, their garb was off the peg North Face gear and green wellington boots. And, of course, for social policy a hoodie is de rigueur. Rosy-cheeked Prime Minister David Cameron has been extremely earnest about fracking for shale gas for several years, and in the petroleum industry the appropriate signal of a leading politician’s enthusiasm is to wear a rigger’s blue jumpsuit; ‘We’re going all out for shale’ Cameron has said. Given the explosive success of shale-gas exploitation in North America over the last decade that’s not very surprising, but do not expect to see him looking earnestly at an exploration rig again any time soon.
Cameron’s excitement began when in 2011 the Advanced Resources Institute (ARI) in Washington DC released the results of its consultancy for the US Department of Energy on global shale-gas prospects. The star prospect in Europe was Poland, well endowed with subsurface shales, which according to ARI, had more than 5 trillion cubic metres of technically recoverable reserves, enough to satisfy Polish consumption for more than 300 years. In 2013, ARI suggested 17 trillion m3 beneath Britain, albeit only 0.7 trillion that was amenable to fracking (about a decade’s worth of British gas consumption). But still the hype was maintained. An article in the 3 March 2016 issue of Nature(Inman, M. 2016. Can fracking power Europe. Nature, v. 531, p. 22-24) tempers enthusiasm a great deal more.
The Polish Geological Institute revised the country’s reserves down to a tenth of ARI’s estimate. After an initial frenzy of interest following the ARI report, when exploration licences covered a third of Poland, during 2013 and 2014 major companies relinquished licences for fracking en masse. Their exploratory activities had been disappointing because of the depth of burial (2-5 km compared with 1-2 km in the US) and unfavourably high clay content and strength of the target shales. The less thrilling ARI prospects for Britain did not excite major petroleum players at all, what interest there is being from ‘juniors’ such as Cuadrilla. The British Geological Survey, which has huge archives of geological information, both surface and subsurface, has assessed the three main British shale-gas ‘plays’ and comes up with a reserve figure of between 24 and 68 trillion m3. But that high figure is based on the situation in mid-west North American shale-gas fields, where the geology is a great deal simpler than here. In Britain, orogenies at the end of the Carboniferous and the outermost ripples of that which formed the Alps in late Mesozoic and Palaeogene times created far more deformation than beneath the central plains of North America. Widespread faults, even though few in Britain have large displacements, pose two sets of problems. As the minor earthquakes set off by fracking in the tectonically simple Fylde area of western Lancashire indicate, pumping fluids into faulted rock can release pent-up elastic strain. But such leakage into faults and smaller fractures may also cause the injection pressure to fall, making the fracking process less efficient.
Fracking information sheet from the British Geological Survey
Inman reports that fracking is now moribund throughout Europe, partly because of the disappointing results and also because environmental concerns for densely populated regions have spurred widespread moratoria, including those in three of Britain’s four nations; Scotland, Wales and Northern Ireland. The only current European fracking activity is in England, conducted by a handful of junior companies. A stumbling block in England actually lies with the quality of subsurface data for what has been described at the most close examined geology in the world. Since the early 1980s there has been a succession of onshore licensing rounds for oil and conventional gas, the 14th of which is still active. The early ones were accompanied by a great deal of seismic reflection surveying, mainly using the truck mounted ‘Vibroseis’ method where the ground is mechanically thumped rather than subject to explosive shot firing that is favoured in sparsely populated areas. According to BGS, the guardians of the onshore seismic exploration repository, compared with the onshore seismic data available in North America that for Britain is ‘sparse, and fairly poor’.
Note: Earth-Pages will be closing as of early July, but will continue in another form at Earth-logs
Increasingly sophisticated analysis of existing genomes from Neanderthal and Denisovan fossil bone, together with new data on single-chromosome DNA extracted from Croatian and Spanish Neanderthals continues to break new ground.
According to genome comparison between a Siberian specimen and modern humans, a population from which Neanderthals emerged separated from that which led to anatomically modern humans (AMH) sometime between 550 and 765 ka, although the fossil record can only confirm that divergence was before 430 ka. The comparison famously showed that Neanderthals contributed to modern, non-African humans between 47 and 75 ka, that is after the exodus of AMH from Africa that spread our species throughout all continents except Antarctica. This genetic exchange is thought to have taken place somewhere in the Middle East, which seems to have been a major staging post for our spread further east and also westward to Europe. A similar indication of liaison between Denisovans and AMH migrants is restricted to modern Melanesians, and probably took place in eastern Asia before 45 ka, when modern people began crossing from Eurasia to New Guinea and Australia. Neanderthal-Denisovan comparison suggests that those distinct groups separated between 380 and 470 ka ago (recently revised from an earlier estimate).
In both cases the gene flow was from the older groups to humans. Further examination of Siberian Neanderthal genomes now indicates that a reverse exchange occurred more than 100 ka ago (Kuhlwilm, M. and 21 others 2016. Ancient gene flow from early modern humans into Eastern Neanderthals. Nature, v. 530, p. 429-433). But the single-chromosome DNA from Croatian and Spanish Neanderthals shows no such sign This instance of two-way exchange is significant in another way: it took place before direct evidence of the generally accepted departure of African migrants to populate the rest of the world. At about 100 ka there is fossil evidence of possible AMH-Neanderthal cohabitation of the Levant, followed by a period with fossil evidence for Neanderthal presence there but not modern humans. Because stone tools from northern Arabia are dated as far back as 125 ka and closely resemble those associated with archaic modern humans, there is a possibility that AMH migration was far earlier than previously thought and passed through the Levant en route to points east.
Another tantalizing aspect of Neanderthal-modern human genetics is the tangible legacy of interbreeding with non-African humans. The first sign was that the gene (mc1r) that confers red hair on those of us blessed, or otherwise, with it may have Neanderthal origins, thus making us extremely proud of that heritage. The same gene is implicated in northern modern humans having developed pale skin, which might embarrass ‘white supremacists’! Similar studies in Svante Paabo’s lab at the Max Planck Institute for Evolutionary Anthropology in Leipzig also suggested 15 genome regions that include those involved in energy metabolism, possibly associated with type 2 diabetes; cranial shape and cognitive abilities, perhaps linked to Down’s syndrome, autism and schizophrenia; wound healing; skin, sweat glands, hair follicles and skin pigmentation; and barrel chests. There is more…
Joshua Akey of the University of Washington, Seattle, and evolutionary genomicist Tony Capra of Vanderbilt University in Nashville hit on the idea of ‘mining’ archived genetic information from more than 28 thousand living people for traces of 6000 Neanderthal DNA variants and comparing the results with physical traits and diseases logged in the human database (reported by Gibbons, A. 2016. Neanderthal genes linked to modern diseases. Science, v. 351, p. 648-9). On the plus side, Neanderthal ancestry may help boost immune responses to fungi, parasites and bacteria. Inheritance of enhanced blood coagulation, although greatly assisting recovery from wounds and hemorrhage when giving birth, confers a proclivity to heart attacks and strokes. Neanderthals also passed on ‘weak bladders’, solar keratoses that confer skin cancer risk, a tendency to malnutrition from modern diets low on meat and nuts, depression triggered by jet lag(!) and even a tendency to nicotine addiction. But a ‘pure’ line of modern human descent, shared by most Africans, also has its positive and negative heritable traits.


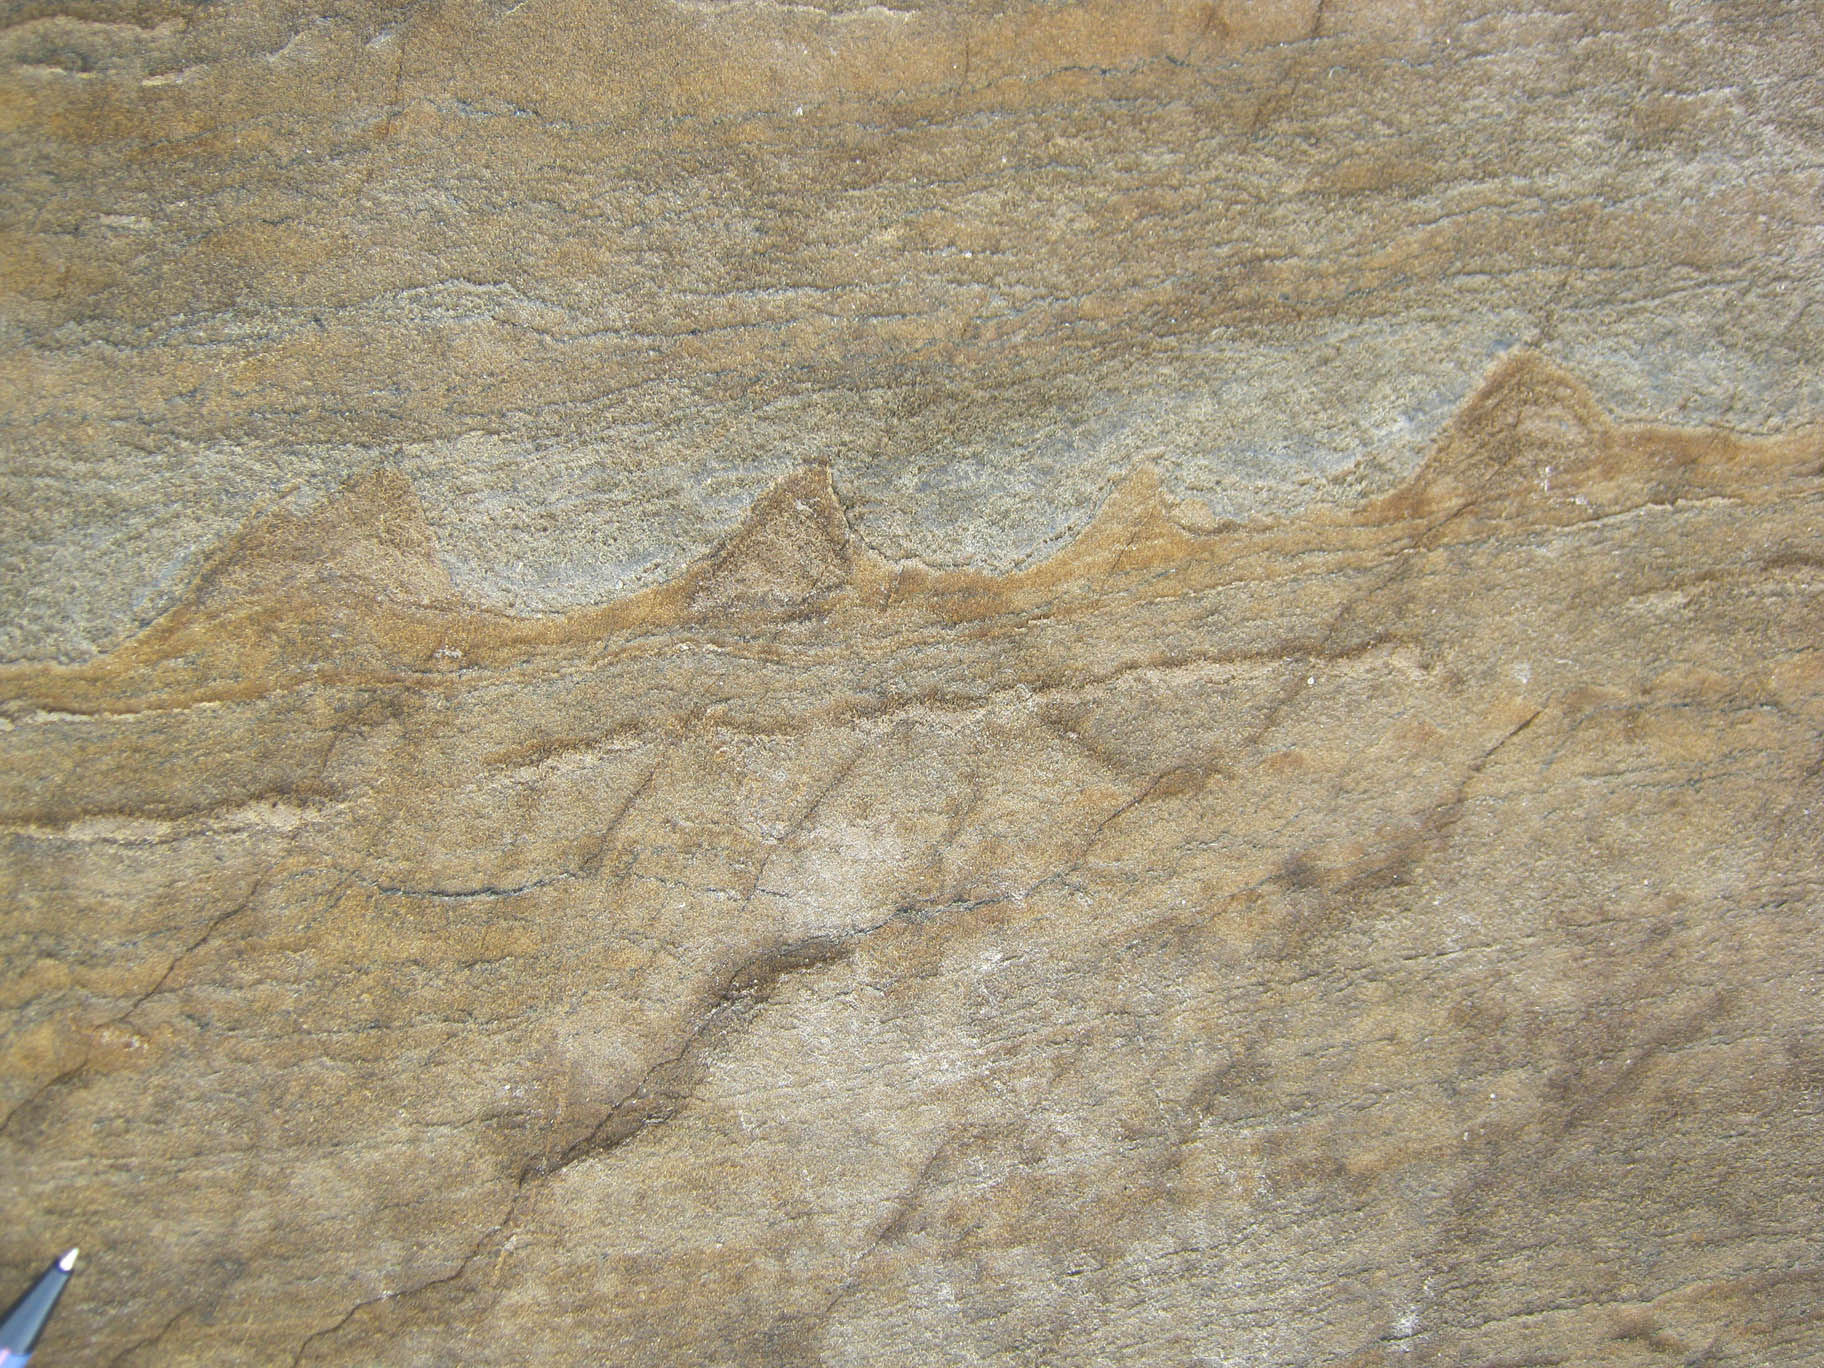


")


