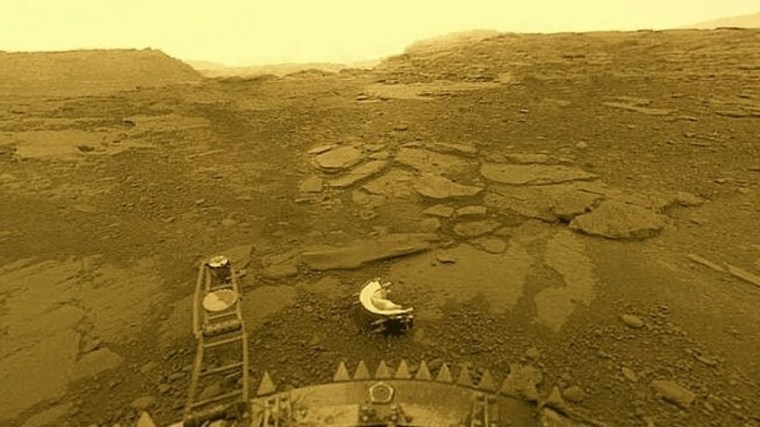
Climate and tectonics since 250 Ma

A central feature of the Earth’s climate system is the way that carbon bound in two gases – carbon dioxide (CO2) and methane (CH4) – controls the amount of incoming solar energy that is retained by the atmosphere. Indeed, without one or the other our home world would have been locked in frigidity since shortly after its formation: a sterile, ice-covered planet. The ‘greenhouse effect’ has been ever-present because the material from which the Earth accreted contained carbon as well as every other chemical element from hydrogen to uranium. Naturally reactive, it readily combines with hydrogen and oxygen to form methane and carbon dioxide, which would have escaped the inner Earth as gases to enter the earliest atmosphere as a ‘comfort blanket’, along with water vapour, another greenhouse gas.  Their combined effects have remained crudely balanced so that neither inescapable frigidity nor surface temperatures high enough to boil-off the oceans have ever occurred in the last 4.5 billion years. Earth has remained like the wee bear’s porridge in the Goldilocks story! Even so, global climate has fluctuated again and again from that akin to a steamy greenhouse, through long periods of moderation to extensive glacial conditions, including three that extended from pole-to-pole – ‘Snowball’ Earths –  during in the Precambrian. During the Phanerozoic the Earth has entered three long periods of generally low global temperatures, in the Ordovician, the Carboniferous and during the last 2.5 Ma  that allowed polar ice caps and sea-ice to extend a third of the way to the Equator. These were forced back and forth repeatedly by cyclical influences apparently triggered by astronomically controlled changes to Earth’s orbital and rotational parameters – the Milankovich Effect. Anthropogenic emissions of greenhouse gases in vast and increasing amounts now threaten to disrupt natural climate variation, effectively overthrowing the gravitational influences of distant giant planets that have controlled climate changes that shaped our own evolution since the genus Homo first emerged.

Bubbles of air trapped in cores through the ice sheets of Antarctica and Greenland record decreased volumes of land ice as CO2 content increased and the opposite during glacial episodes. Somehow in step with the astronomical forcing the Earth released greenhouse gas to warm the climate and drew it down to bring on cooling. Since all life forms are built from carbon-rich compounds and some extract it from the environment to build carbonate hard parts, climate and life on land and in the oceans are interlinked. In fact life and death are involved, because once dead organisms and their hard parts are buried before being oxidised in sediments on land, as in peat and ultimately coal, and on the ocean floors as limestones or carbonaceous mudstones, atmospheric carbon is sequestered. Exposed to acid water containing dissolved CO2 from the atmosphere or to oxygen, respectively, the two forms of carbon in solid form are released as greenhouse gas once more. Both take place when sedimentary deposits are exhumed as a result of erosion and tectonics. Another factor is the abundance of available nutrients, themselves released and distributed by erosion and agents of transportation. At present surface waters of the most distant parts of the oceans contains plenty of such nutrients, except for a vital one, dissolved iron. So they are wet ‘deserts’. It seems that during the much dustier times of glacial episodes iron in fine form reached far out into the world’s oceans so that phytoplankton at the base of the food chain ‘bloomed ‘and so did planktonic animals. Dead organisms ‘rained’ to the ocean floor so drawing down CO2 from the atmosphere and decreasing the greenhouse effect. The surface parts of the carbon and rock cycles are extremely complex and climatologists have yet to come to grips with modelling its future climates convincingly. Yet the carbon cycle and much deeper parts of the rock cycle are interwoven too.

Carbon in sedimentary rock can be heated by burial, and some can be subducted to great depths at destructive plate margins together. The same applies to in ocean-floor basalts that have been permeated by circulating sea water through hydrothermal circulation to form carbonates in the altered volcanic rock. In both cases carbon stored for hundreds of million years can be released by metamorphism in orogenic belts at zones of continental collision and deep below island arcs. Carbon from mantle depths that has never ‘seen the light of day’ is also added to the atmosphere when magmas form below oceanic constructive margins, hot spots and subduction zones, and where magmas flood the continental surface. Consequently, plate tectonics and deep mantle convection have surely played a long-term role in the evolution of our planet’s climate system. Geoscientists based in Australia and the UK have used geochemical data to reconstruct the stores of carbon in oceanic plates and thermodynamic modelling to track what may have happened to it and the climate through the last 250 Ma (Müller, R.D. et al. 2022. Evolution of Earth’s tectonic carbon conveyor belt. Nature, v. 605, p. 629-639; DOI: 10.1038/s41586-022-04420-x). Their review is an important step in understanding what underpins climate on a geological time scale, onto which much shorter-term surface influences are superimposed.

The amount of carbon being outgassed as CO2 each year along plate boundaries in the early Jurassic (185 Ma) shown in dark purple (low) to yellow (high). Also shown in shades of blue is the accumulation of carbon stored in each square metre of the ocean plates. Plate motions are shown as grey arrows (credit: Müller, R.D. et al. Clip from video in Supplementary Information)

At mid-ocean ridges basaltic magma wells up from mantle depths and loses much of its content of dissolved CO2. The annual outgassing at ridges, which depends on the global rate of plate formation, has varied from 13 to 30 million tonnes of carbon  (MtC yr-1) since the start of the Mesozoic Era 250 Ma ago. Similarly, there is greenhouse-gas escape from volcanic arcs above subduction zones, estimated to have ranged from 0 to 18 MtC yr-1. As an oceanic plate moves away from its source various processes sequester CO2 into the oceanic crust and upper mantle through accumulation of deep-sea sediments and hydrothermal alteration of basaltic crust and peridotite mantle (ranging from 30 to 311 MtC yr-1). Of this influx of carbon into oceanic plates between 36 to 103 MtC yr-1 has gone down subduction zones in descending slabs. Between 0 to 49 MtC yr-1 of that has been outgassed by arc volcanic activity or absorbed into the overriding plate. The rest continues down into the deep mantle, perhaps to form diamonds. Overall, when the rate at which oceanic plates grow is rapid and plate motion speeds up, outgassing should be high. When plate growth slows, so does the rate of CO2 release. Variations in plate growth can be estimated from the magnetic reversal stripes above the ocean floors.  The authors have released an animation of the break-up of Pangaea (well worth watching at full screen – you can skip the ad at the start), with the rate of carbon emission at ridges and volcanic arcs being colour-coded. Also shown is the storage of carbon within oceanic plats plates as time passes.

Length of mid-ocean ridges (orange) and subduction zones (blue) through the last 250 Ma (top). The areas of oceanic crust produced at ridges and consumed by subduction (bottom) (credit: Müller, R.D. et al., Figs 1a, 1c)

Before Pangaea began to break up at the end of the Triassic (200 Ma) the total length of mid-ocean ridges was at a minimum of about 40 thousand km. Through the Jurassic it never exceeded 50,000 km, but rose to a maximum of 80,000 km during the Cretaceous then declined slowly to the current length of 60,000 km. Throughout the last 250 Ma the length of subduction zones stayed roughly the same at about 65 thousand km – not always in the same places – although the overall rate of subduction changed in line with the rate of oceanic plate growth  (the volume that is added must be balanced roughly by the amount that returns to the mantle).  Between the end of the Jurassic and the mid-Cretaceous crustal production and destruction doubled, shown by the bottom plot in the figure above. The very fast  movement of plates and an increase in the global length of ridges during Jurassic to mid-Cretaceous times led to a dramatic increase in CO2 outgassing from ridges so that its content in the atmosphere rose as high as 1200 ppm – more than four times that before the Industrial Revolution. That level resulted in global ‘hothouse’ conditions during the Cretaceous. Another factor behind the Cretaceous climate was a decrease in the global complement of mountains. That led to decreases in erosion and the weathering of silicates by acid rain, thus reducing natural sequestration of carbon.

During the Cenozoic (after 65 Ma) declining ridge outgassing was actually outpaced by that associated with subduction, according to the modelling. That is strange, for by around 35 Ma glaciation had begun  on Antarctica as the Earth was cooling, which implies a major, unexpected sink for excess CO2. The most likely way this might have arisen is through increased erosion and silicate weathering on the exposed continents that consumed CO2 faster than tectonics was releasing the gas. The length of continental arcs shows no sign of a major increase during the Cenozoic, which might have accelerated that kind of sequestration, but a variety of proxies for signs of weathering definitely suggests that there was an upsurge. Also there was increased storage of carbon on the deep ocean floor, shown by the video. Increased calcium released by weathering to enter ocean water in solution would allow more planktonic organisms to secrete calcite (CaCO3) skeletons that would then fall to the ocean floor when they died.

There may be more to be discovered in this hugely complex interplay between tectonics and climate. For instance, when the bottom waters of the oceans are oxygenated by deep currents of cold dense seawater sinking from polar regions, carbon in tissues of sunken dead organism is oxidised to release CO2. If bottom waters are anoxic, this organic carbon is preserved in sediments. The authors mention this as something to be considered in their future work on  the ‘tectonic carbon conveyor belt’.

The end of the Carboniferous ‘icehouse’ world

From about 340 to 290 Ma the Earth experienced the longest episode of repeated ice ages of the Phanerozoic. The climate then was similar in many ways to that of the Pleistocene. The South Polar region was then within the Pangaea supercontinent and thus isolated from any warming effect from the surrounding ocean: much the same as modern Antarctica but on a much larger scale. Glaciation extended as far across what became the southern continents and India as did the continental ice sheets of the Northern Hemisphere during Pleistocene glacial maxima. Tropical sedimentary rocks of the time, display evidence for repeated alternations of high and low sea levels that mark cycles of glacial maxima and interglacial episodes akin to those of the Pleistocene. In fact they probably reflect the influence of changes in the Earth’s orbit and geometry of its axis of rotation very similar to those predicted by Milankovich from astronomical factors to explain Pleistocene climatic cycles. At the end of the Carboniferous what was an ‘ice-house’ world changed suddenly to its opposite – ‘greenhouse’ conditions – that persisted through the Mesozoic Era until the later part of the Cenozoic, when Antarctica developed is ice cap and global climate slowly cooled to become extremely cyclical once again.

Sedimentary evidence for global climates 320 Ma ago. As well as the large tracts of glaciogenic sediments, smaller occurrences and examples of polished rock surfaces over which ice had passed show the probable full extent (blue line) of ice sheets across the southern, Gondwana sector of Pangaea (Credit: after Fig 7.3, S104, Earth and Space, ©Open University 2007)

The end of the Carboniferous witnessed the collapse of the vast Equatorial rainforests, which formed the coal deposits that put ‘Carbon’ into the name of the Period. By its end this ecosystem had vanished to result in a minor mass extinction of both flora and fauna. Temperatures rose and aridity set in, to the extent that the latest Carboniferous in the British coalfields is marked by redbeds that presage the spread of desert conditions across the Equatorial parts of Pangaea during the succeeding Permian. A team of researchers based at the University of California at Davis have been studying data pertaining to this sudden change have now published their findings (Chan J. and 17 others 2022. Marine anoxia linked to abrupt global warming during Earth’s penultimate icehouse. Proceedings of the National Academy of Sciences, v. 119, article e2115231119; DOI: 10.1073/pnas.2115231119). They used carbon-, oxygen- and uranium isotopes, together with proxies for changes in atmospheric CO2 concentrations, to model changes in the carbon cycle in the Late Carboniferous of China.

Changes in uranium isotopes within marine carbonates are useful indicators of the amount of oxygen available in ocean water at the sea floor. Between 304 and 303.5 Ma ago oxygen content declined by around 30%, the peak of this anoxia being at 303.7 Ma. This occurred about 100 ka after atmospheric CO2 had risen to ~700 parts per million (ppm) from around 350 ppm in the preceding 300 ka, as marked by several proxies.  The authors suggest that the lower ‘baseline’ for the main greenhouse gas marked an extreme glacial maximum. Changes in the proportions of 18O relative to ‘lighter’ 16O in fossil shells suggest that sea-surface temperatures increased in step with the doubling of the greenhouse effect. At the same time there was a major marine transgression as sea level rose. This would have been accompanied by a massive increase in low density freshwater in surface ocean water derived from melting of Pangaea’s ice cap. The team suggests that the freshened surface layer could not sink to carry oxygen to deeper levels, thereby creating anoxic conditions across an estimated 23% of the global seafloor, and thus toxic ‘death zones’ for marine organisms.

One possibility for this sudden rise of atmospheric CO2 is a massive episode of volcanism, perhaps a large igneous province, but there is scanty evidence for that at the end of the Carboniferous. A coinciding sharp decrease in δ13C  in carbonate shells suggests that the excess carbon dioxide probably had an organic origin. So a more plausible hypothesis is massive burning on the continental surface. In the tropics, the huge coals swamps would have contained vast amounts of peat-like decayed vegetable matter as well as living green vegetation. How might that have caught fire? The peat precursor to Carboniferous coal deposits derived from photosynthesis on an unprecedented, and never repeated, scale during tens of million years of thriving tropical rain forest during that Period. This built up atmospheric oxygen levels to about 35%, compared with about 21% today. Insects, whose maximum size is governed by their ability to take in oxygen through spiracles in their bodies, and by the atmospheric concentration of oxygen, became truly huge during the earlier Carboniferous. The more oxygen in the air, the greater the chance that organic matter will catch fire. In fact wet vegetation can burn if oxygen levels rise above 25%. At the levels reached in the Carboniferous huge wildfires in forests and peatlands would have been inevitable. Evidence that huge fires did occur comes from the amount of charcoal found in Carboniferous coal seams, which reach 70% compared with the 4 to 8 % in more recent coals. They may have been ignited by lightning strikes or even spontaneous combustion if decay of vegetation generated sufficient heat, as sometimes happens today in wet haystacks or garden compost heaps.  But how in a short period around 304 Ma could 9 trillion tons of carbon dioxide be released in this way. The preceding  glacial super-maximum, like glacial maxima of the Pleistocene, may have been accompanied by decreased atmospheric humidity: this would dry out the vast surface peat deposits.

The succeeding Permian is famous for its extensive continental redbeds, and so too those of the Triassic. They are red because sediment grains are coated in the iron oxide hematite (Fe2O3). As on Mars, the redbeds are a vast repository for oxygen sequestered from the atmosphere by the oxidation of dissolved Fe2+ to insoluble Fe3+. This had been going on throughout the Permian, the nett result being that by 250 Ma atmospheric oxygen content has slumped to 16% and remained so low for another 50 million years. Photosynthesis failed to resupply oxygen against this inorganic depletion, and there are few coal deposits of Permian or Triassic age: for about 100 Ma Earth ceased to have green continents.

See also: Carbon, climate change and ocean anoxia in an ancient icehouse world. Science Daily, 2 May 2022. 

Kicking-off planetary Snowball conditions

Untitled-1
Artist’s impression of the glacial maximum of a Snowball Earth event (Source: NASA)

Twice in the Cryogenian Period of the Neoproterozoic, glacial- and sea ice extended from both poles to the Equator, giving ‘Snowball Earth’ conditions. Notable glacial climates in the Phanerozoic – Ordovician, Carboniferous-Permian and Pleistocene – were long-lived but restricted to areas around the poles, so do not qualify as Snowball Earth conditions. It is possible, but less certain, that Snowball Earth conditions also prevailed during the Palaeoproterozoic at around 2.4 to 2.1 billion years ago. This earlier episode roughly coincided with the ‘Great Oxidation Event’, and one explanation for it is that the rise of atmospheric oxygen removed methane, a more powerful greenhouse gas than carbon dioxide, by oxidizing it to CO2 and water. That may well have been a consequence of the evolution of the cyanobacteria, their photosynthesis releasing oxygen to the atmosphere. The Neoproterozoic ‘big freezes’ are associated with rapid changes in the biosphere, most importantly with the rise of metazoan life in the form of the Ediacaran fauna, the precursor to the explosion in animal diversity during the Cambrian. Indeed all major global coolings, restricted as well as global, find echoes in the course of biological evolution. Another interwoven factor is the rock cycle, particularly volcanism and the varying pace of chemical weathering. The first releases CO2 from the mantle, the second helps draw it down from the atmosphere when weak carbonic acid in rainwater rots silicate minerals (see: Can rock weathering halt global warming, July 2020). All such interplays between major and sometimes minor ‘actors’ in the Earth system influence climate and, in turn, climate inevitably affects all the rest. With such complexity it is hardly surprising that there is a plethora of theories about past climate shifts.

As well as a link with fluctuations in the greenhouse effect, climate is influenced by changes in the amount of solar heating, for which there are yet more options to consider. For instance, the increase in Earth’s albedo (reflectivity) that results from ice cover, may lead through a feedback effect to runaway cooling, particularly once ice extends beyond the poorly illuminated poles. Volcanic dust and sulfate aerosols in the stratosphere also increase albedo and the tendency to cooling, as would interplanetary dust. More complexity to befuddle would-be modellers of ancient climates. Yet it is safe to say that, within the maelstrom of contributory factors, the freeze-overs of Snowball conditions must have resulted from our planet passing through some kind of threshold in the Earth System. Two theoretical scientists from the Department of Earth, Atmospheric, and Planetary Sciences at the Massachusetts Institute of Technology have attempted to cut through the log-jam by modelling the dynamics of the interplay between the ice-albedo feedback and the carbon-silicate cycle of weathering (Arnscheidt, C.W. & Rothman, D.H. 2020. Routes to global glaciation. Proceedings of the Royal Society A, v. 476, article 0303 online; DOI: 10.1098/rspa.2020.0303). Their mathematical approach involves two relatively simple, if long-winded, equations based on parameters that express solar heating, albedo, surface temperature and pressure, and the rate of volcanic outgassing of CO2; a simplification that sets biological processes to one side.

Unlike previous models, theirs can simulate varying rates, particularly of changes in solar energy input. The key conclusion of the paper is that if solar heating decreases faster than a threshold rate the more a planet’s surface water is likely to freeze from pole to pole. The authors suggest that a Snowball Earth event would result from a 2% fall in received solar radiation over about ten thousand years: pretty quick in a geological sense. Such a trigger might stem from a volcanic ‘winter’ scenario, an increase in clouds seeded by spores of primitive marine algae or other factors. The real ‘tipping point’ would probably be the high albedo of ice. There is a warning in this for the present, when a variety of means of decreasing solar input have been proposed as a ‘solution’ to global warming.

Because the Earth orbits the Sun in the ‘Goldilocks Zone’ and is volcanically active even global glaciation would be temporary, albeit of the order of millions of years. The cold would have shut down weathering so that volcanic CO2 could slowly build up in the atmosphere: the greenhouse effect would rescue the planet. Further from the Sun, a planet would not have that escape route, regardless of its atmospheric concentration of greenhouse gases: a neat lead-in to another recent paper about the ancient climate of Mars (Grau Galofre, A. et al. 2020. Valley formation on early Mars by subglacial and fluvial erosion. Nature Geoscience, early online article; DOI: 10.1038/s41561-020-0618-x)

A Martian channel system: note later cratering (credit: European Space Agency)

There is a lot of evidence from both high-resolution orbital images of the Martian surface and surface ‘rovers’ that surface water was abundant over a long period in Mars’s early history. The most convincing are networks of channels, mainly in the southern hemisphere highlands. They are not the vast channelled scablands, such as those associated with Valles Marineris, which probably resulted from stupendous outburst floods connected to catastrophic melting of subsurface ice by some means. There are hundreds of channel networks, that resemble counterparts on Earth. Since rainfall and melting of ice and snow have carved most terrestrial channel networks, traditionally those on Mars have been attributed to similar processes during an early warm and wet phase. The warm-early Mars hypothesis extends even to interpreting the smooth low-lying plains of its northern hemisphere – about a third of Mars’s surface area – as the site of an ocean in those ancient times. Of course, a big question is, ‘Where did all that water go?’ Another relates to the fact that the early Sun emitted considerably less radiation 4.5 billion years ago than it does now: a warm-wet early Mars is counterintuitive.

Anna Grau Galofre of the University of British Columbia and co-authors found that many of the networks on Mars clearly differ in morphology from one another, even in small areas of its surface. Drainage networks on Earth conform to far fewer morphological types. By comparing the variability on Mars with channel-network shapes on Earth, the authors found a close match for many with those that formed beneath the ice sheet that covered high latitudes of North America during the last glaciation. Some match drainage patterns typical of surface-water erosion, but both types are present in low Martian latitudes: a suggestion of ‘Snowball Mars’ conditions? The authors reached their conclusions by analysing six mathematical measures that describe channel morphology for over ten thousand individual valley systems. Previous analyses of individual systems discovered on high-resolution images have qualitative comparisons with terrestrial geomorphology

See also: Chu, J. 2020. “Snowball Earths” May Have Been Triggered by a Plunge in Incoming Sunlight – “Be Wary of Speed” (SciTech Daily 29 July 2020); Early Mars was covered in ice sheets, not flowing rivers, researchers say (Science Daily, 3 August 2020)

Finding Archaean atmospheric composition using micrometeorites

Modern micrometeorites (about 20 μm in diameter) from deep-sea sediments, with shiny magnetite-rich veneers (Credit: D. E. Brownlee)

The gases making up the Earth’s atmosphere and their relative proportions before 2.5 billion years (Ga) ago are known with very little certainty. Carbonate rocks are rare, indicating that the oceans were more acidic, which implies that they had dissolved more CO2 from the atmosphere, which, in turn implies that there was much more of that gas than in present air. There are few signs of widespread glaciogenic sediments of Archaean age, at a time when the Sun’s energy output is estimated to have been at 70 to 75% of its present level. Without an enhanced greenhouse effect oceans would have been frozen over; so that supports high CO2 concentrations too. The fact that water worn grains of minerals such as uraninite (UO2) and pyrite (FeS2), which are stable only in reducing conditions, occur in Archaean conglomerates is a good indicator that there were only vanishingly small amounts of oxygen in the air. That was not to change until marine photosynthesisers produced enough to overcome the general reducing conditions at the Earth’s surface, marked by the Great Oxidation Event at around 2.4 Ga (see: Massive event in the Precambrian carbon cycle; Earth-logs, January 2012. Search for more articles in sidebar at Earth-logs home page). It was then that ancient soils (palaeosols) became the now familiar red colour because of their content of ferric iron oxides and hydroxides The problem is that reliable numbers cannot be attached to these kinds of observation. A common means of estimating CO2 levels comes from the way in which the gas reacts with silicates as soils form at the land surface, estimated from carbon isotopes in soil carbonate nodules. Since the rise of land plants around 400 Ma ago the distribution of pores (stomata) in fossil leaves provides a more precise estimate: the more CO2 in air the less densely packed are leaf stomata. For the Precambrian we are stuck with estimates based on chemical reactions of minerals with the atmosphere. Until recently, one reaction that must always have been extremely common was overlooked.

When meteorite pass through the atmosphere at very high speed friction heats them to incandescence. Their surfaces not only melt but the minerals from which they are composed react very strongly with air. The reaction products should therefore provide chemical clues to the relative proportions of atmospheric gases. Both oxygen and carbon dioxide are reactive at such temperatures, although nitrogen is virtually inert, yet it tends to buffer oxidation reactions. The rest of the atmosphere comprises noble gases – mainly argon – and by definition they are completely unreactive. Pure-iron micrometeorites collected from 2.7 Ga old sediments in the Pilbara Province of Western Australia are veneered with magnetite (Fe3O4) and wüstite (FeO), thus preserving a record of their passage through the Neoarchaean atmosphere. If the oxidant had been oxygen, for these minerals to form from elemental iron suggests oxygen levels around those prevailing today: clearly defying the abundant evidence for its near-absence during the Archaean. Carbon dioxide is the only candidate. Two studies have produced similar results (Lehmer, O. R. et al. 2020. Atmospheric CO2 levels from 2.7 billion years ago inferred from micrometeorite oxidationScience Advances, v. 6, article aay4644;  DOI: 10.1126/sciadv.aay4644 and Payne, R.C. et al. 2020. Oxidized micrometeorites suggest either high pCO2 or low pN2 during the Neoarchean. Proceedings of the National Academy of Sciences, v. 117 1360 DOI:10.1073/pnas.1910698117). Both use complex modelling of the chemical effects of meteorite entry. Lehmer and colleagues estimated that the Neoarchaean atmosphere contained about 64% CO2, with a surface atmospheric pressure about half that at present. This would be sufficient for a surface temperature of about 30°C achieved by the greenhouse effect, taking into account lower solar heating. The team led by Payne concluded a lower concentration (25 to 50%) and a somewhat cooler planet at that time. Both results suggest ocean water considerably more acid than are today’s. The combined warmth and acidity would have had a fundamental bearing on both the origin, survival and evolution of early life.

See also: Carroll, M. 2020. Meteorites reveal high carbon dioxide levels on early Earth; Yirka, R. Computer model shows ancient Earth with an atmosphere 70 percent carbon dioxide. (both from Phys.org)