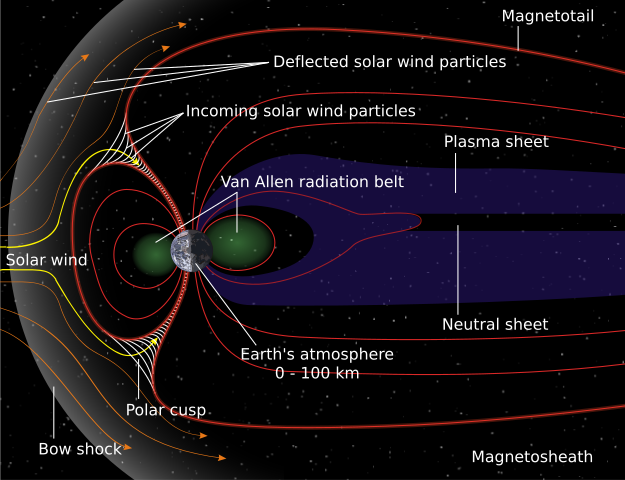
A companion crater for Chicxulub on the continental shelf of West Africa

Fig Interpreted 2D seismic section across the Nadir crater and central uplift beneath the Guinea Terrace. (Credit: Nicholson, et al. 2022. Fig 2c)

In 2022 four geoscientists from Heriot-Watt University in Edinburgh, Scotland and the Universities of Arizona and Texas (Austin), USA were geologically interpreting seismic-reflection data beneath the seafloor off Guinea and Guinea-Bissau, West Africa. Individual sedimentary strata that cover the upper continental crust show up as many reflectors. They are calibrated to rock cores from exploratory well that had revealed up to 8 km of sedimentary cover deposited continuously since the Upper Jurassic. The team’s objective was to collect information on tectonic structures that had formed when South America separated from Africa during the Cretaceous. The geophysical data were from commercial reconnaissance surveys aimed at locating petroleum fields beneath part of the West African continental shelf known as the Guinea Terrace. One of the seismic sections revealed a ~9 km wide basin-like depression at the level of the Cretaceous-Palaeogene boundary, which is underlain by a prominent upward bulge in reflectors corresponding to the mid-Cretaceous, plus a large number of nearby faults (Nicholson, U., and 3 others 2022. The Nadir Crater offshore West Africa: a candidate Cretaceous-Paleogene impact structure. Science Advances, v. 8, article eabn3096; DOI: 10.1126/sciadv.abn3096). Elsewhere on the Guinea Terrace the strata were featureless by comparison.

The Nadir crater showed many of the signs to be expected from an asteroid impact. That it drew attention stemmed partly from being of roughly the same age as the much larger 66 Ma Chicxulub impact off the Yucatan Peninsula of Mexico: the likely culprit for the K-Pg mass-extinction event. Perhaps both impactors stemmed from the break-up of a large, near-Earth asteroid because of gravitational forces resulting from a previous close encounter with either the Earth or another planet. The crater lies at the centre of a 23 km wide zone of faults that only affect Cretaceous and older strata; i.e. they formed just before the K-Pg event. The seismic data also show signs of widespread liquefaction of nearby Cretaceous sedimentary strata and that the crater had been filled by sediments shortly after it formed. Yet the data were too fuzzy for an astronomical catastrophe to be absolutely certain: similar structures can form from the rise of bodies of rock salt, which is less dense than sediments and will dissolve on reaching the seabed.  The owners of the seismic data donated a much larger collection from a grid of survey lines. Processing of such seismic grids turns the collection of individual two-dimensional sections into a 3D regional data set showing the complete shape of subsurface structures. Seismic data of this kind enables more detailed structural and lithological interpretation of both cross section and plan views. They enable sedimentary layers to be ‘peeled’ back to examine the crater at all depths, in much the same manner as CT  and MRI scans reveal the inner anatomy of the human body.

Map of faults around the Nadir crater at a level in the 3D seismic data that was about 200 m below the sea bed at the time of the impact. (Credit: Nicholson, et al. 2024, Fig 6)

Uisdean Nicholson and a larger team have now published their findings from the 3D seismic data that show the structure in unique detail (Nicholson, U., and 6 others 2024. 3D anatomy of the Cretaceous–Paleogene age Nadir Crater. Communications Earth & Environment v. 5, article number 547; DOI: 10.1038/s43247-024-01700-4). Nadir crater was affected by spiral-shaped thrust faults that suggest it was formed by an oblique impact from the northeast by an object around 450 m across, probably travelling at 20 km s-1 at 20 to 40° to the surface. Seconds after excavation uplift of deeper sediments was a response to removal of the load on the crust. The energy was sufficient to vaporise both sediment and impactor within a few seconds, the to drive drive seawater outwards in a tsunami about half a kilometre high, which in about 30 seconds exposed the incandescent crater floor. In the succeeding minutes hours and days liquefied sea water sloshed in and out of the crater, repeated tsunami resurgence forming gullies on its flanks and transporting sediment mixed with glass (suevite) flowed to refill the crater.

Time line for the Nadir impact, derived from detail shown by 3D seismic data. (Credit: Nicholson, et al. 2024, Fig 7)

There is no means of assigning any of the K-Pg extinctions to the Nadir crater, just that it happened at roughly the same time as Chicxulub. But it is the first impact crater to reveal the processes involved through complete coverage by high-resolution 3D seismic data. The majority of the roughly 200 craters are on the continental surface, and were thus ravaged to some extent by later erosion. Yet of the influx of hypervelocity objects through time at least 70% must have struck the oceans, but only 15 to 20 are known. That may reflect the fact that much deeper water could have buffered even giant impacts from affecting the oceanic crust beneath the abyssal plains, whose average depth is about 4 km. Only a small proportion of the continental shelves deemed to contain petroleum reserves have been explored seismically.  Chicxulub itself has been drilled, but only two seismic reflection sections have crossed its centre since its discovery, although earlier 3D data from petroleum exploration cover its outermost northern parts. More detail is available for Nadir and its lower energy did not smash its structural results, unlike Chicxulub. So, despite Nadir’s smaller size, fortuitously it gives more clues to how such marine craters formed. It looks to be an irresistible target for drilling.

Drip tectonics beneath Türkiye

Tectonics and geomorphology of Turkey showing the main fault systems. The Konya basin is enclosed by the grey rectangle at centre. (Credit: Taymaz et al. Geological Society of London, Special Publication 291, p1-16, Fig 1)

The 1.5-2.0 km high Central Anatolian plateau in Türkiye has been rising since ~11 Ma ago: an uplift of about 1 km in the last 8 Ma. However, part of the southern Plateau shows signs of rapidly subsidence that has created the Konya Basin, marked by young lake sediments. Interferometric radar (InSAR) data from the European Space Agency’s Sentinel-1 satellite, which detects active movement of the Earth’s surface, reveal a crude, doughnut-shaped area of the surface that is subsiding at up to 50 mm per year. This ring of subsidence surrounds a core of active uplift that is about 50 km across (see the first figure). Expressed crudely, active subsidence suggests an excess of mass beneath the affected area, whereas uplift implies a mass deficit; in both cases within the lithosphere. So, when the InSAR data were published in 2020, it became clear that the lithosphere beneath Anatolia is doing something very strange.

Vertical velocities affecting the surface in the Konya Basin derived from InSAR data, velocities colour-coded cyan to blue show subsidence, yellow to red suggesting that the surface is rising. (Credit: Andersen et al., Fig 1c)

Canadian and Turkish geophysicists set out to find a tectonic reason for such aberrant behaviour (Andersen, A.J.  et al. 2024. Multistage lithospheric drips control active basin formation within an uplifting orogenic plateau. Nature Communications, v. 15, Article 7899; DOI: 10.1038/s41467-024-52126-7). They wondered if a process known as ‘drip tectonics’, first mooted as an explanation of anomalous features in some mountain belts in 2004 (see: Mantle dripping off mountain roots, October 2004; and A drop off the old block? May 2008) might be applicable to the Anatolian Plateau. The essence of this process is similar to the slab-pull force at the heart of subduction. Burial and cooling of basaltic material in oceanic lithosphere being driven beneath another tectonic plate converts its igneous mineralogy to the metamorphic rock eclogite, whose density exceeds that of mantle rocks. Gravity then acts to pull the changed material downwards. However, Anatolia shows little sign of subduction. But the mantle beneath shows seismic speed anomalies that hint at anomalously dense material.

Seismic tomography shows that in a large volume 100 to 200 km beneath the central part of the Plateau S-waves travel faster than in the surrounding mantle. The higher speed suggests a body that is denser and more rigid than its surroundings. This could be a sinking, detached block of ‘eclogitised’ lithosphere whose disconnection from the remaining continental lithosphere has been causing the uplift of the Plateau that began in the Late Miocene. A smaller high-speed anomaly lies directly under the Konya Basin, but at a shallower depth (50 to 80 km) just beneath the lithosphere-asthenosphere boundary. The authors suggest that this is another piece of the lower lithosphere that is beginning to sink and become a ‘drip’. Still mechanically attached to the lithosphere the sinking dense block is dragging the surface down.

Andersen et al. instead of relying on computer modelling created a laboratory analogue. This consisted of a tank full of a fluid polymer whose viscosity is a thousand times that of maple syrup that represents the Earth’s deep mantle beneath. They mimicked an overlying  plate by a layer of the same material with additional clay to render it more viscous – the model’s lithospheric mantle – with a ‘crust’ made of a sand of ceramic and silica spherules. A dense seed inserted into the model lithospheric mantle began to sink, dragging that material downwards in a ‘drip’. After that ‘drip’ had reached the bottom of the tank hours later, it became clear that another, smaller drip materialised along the track of the first and also began to sink. Monitoring of the surface of the ‘crust’ revealed that the initial drip did result in a basin. But the further down the drip fell the basin gradually became shallower: there was surface uplift. Once the initial drip had ‘bottomed-out’ the basin began to deepen again as the secondary drip formed and slowly moved downwards. The model seems to match the authors’ interpretation of the geophysics beneath the Anatolian Plateau. One drip created the potential for a lesser one, a bit like in inversion of the well-known slo-mo videos of a drop of milk falling into a glass of milk, when following the drop’s entry a smaller drop rebounds from the milky surface.

Cartoons of drip tectonics beneath the Anatolian Plateau. (a) Lower lithosphere detached from beneath Anatolia in the Late Miocene (10 to 8 Ma) descends into the mantle as it is ‘eclogitised’; (b) a smaller block beneath the Konya Basin beginning to ‘drip’, but still attached to the lithosphere. (Credit: Andersen et al., Fig 4)

In Anatolia the last 10 Ma has not been just ups and downs of the surface corresponding to drip tectonics. That was accompanied by volcanism, which can be explained by upwelling of mantle material displaced by lithospheric drips. When mantle rises and the pressure drops partial melting can occur, provided the mantle material rises faster than it can lose heat: adiabatic melting.

A new timeline for modern humans’ colonisation of Europe

Aurignacian sculptures: ‘Lion-Man’ and ‘Venus’ from the Hohlenstein-Stadel and Hohle Fels caves in Germany.

The earliest culture (or techno-complex) that can be related to anatomically modern humans (AMH) in Europe is called the Aurignacian. It includes works of art as well as tools made from stone, bone and antler. Perhaps the most famous are the ivory sculptures of ‘Lion-Man’ and Venus of the Hohlenstein-Stadel  and Hohle Fels caves in Germany,  and also the stunning cave art, of Chauvet Cave in France. Aurignacian artefacts that are dated at 43 to 26 ka occur at sites throughout Europe south of about 52°N. It was this group of people who interacted with the original Neanderthal population of Europe and finally replaced them completely. There is a long standing discussion over who ‘invented’ the stone tools, both human groups apparently having used similar styles of manufacture (Châtelperronian). Likewise, as regards the subsistence methods deployed by each; in one approach Neanderthals may have largely restricted their activities to roughly fixed ranges, whereas the incomers were generally seasonal nomads. As yet it has not been possible to show if the interbreeding between the two, which ancient and modern genetic data show, preceded the Aurignacian influx or continued when the met in Europe. Whatever, Neanderthals as a distinct human group had disappeared from the geological record by 40 ka. (Note that the three thousand years of coexistence is as long as the time between now and the end of the Bronze Age, about 150 generations at least.) But that aspect of European human development is not the only bone of contention about the spread into Europe. How did the Aurignacian people fare during and after their entry into Europe?

Despite continuing discovery of AMH sites in Europe, and reappraisal of long-known ones, there are limits to how much locations, dates, bones and artifacts can tell us. The actual Aurignacian dispersal of people across Europe is confounded by the limited number of proven occupation sites. These were people who, like most hunter gatherers, must have moved continually in response to variations in the supply of resources that depend on changing climatic conditions. They probably travelled ‘light’, occupied many temporary camp sites but few places to which they returned generation after generation. Temporary ‘stopping places’ are difficult to find, showing little more than evidence of fire and a ‘litter’ of shards from retouched stone tools (debitage), together with discarded bones that show marks left by butchery. A group of archaeologists and climate specialists from the University of Cologne, Germany have tried to shed some light on the completely ‘invisible’ aspects of Aurignacian dispersal and subsistence using what they have called – perhaps a tribute to Frank Sinatra! – the ‘Our Way Model’ (Shao, Y. et al. 2024. Reconstruction of human dispersal during Aurignacian on pan-European scale. Nature Communications, v. 15, Article 7406; DOI: 10.1038/s41467-024-51349-y. Click link to download a PDF).

The reality of hunter-gatherer life during a period of repeated rapid change in climate would clearly have been complex and sometimes precarious. To grasp it also needs to take account of human population dynamics as well as climatic and ecological drivers. The team’s basic strategy was to combine climate and archaeological data to model the degree to which human numbers may have fluctuated and the extent and direction of their migration. Three broad factors would have driven both: environmental change; culture – social change, curiosity, technology; and human biology. Really, environmental change is the only one that can be addressed with any degree of precision through records of climate change, such as Greenland ice cores. Archaeological data from known sites should provide some evidence for technological change, but only for two definite phases in Aurignacian culture (43-38 ka and 38-32 ka). Dating of   Aurignacian sites establishes some time calibration for episodes of occupation, abandonment and resettlement. Issues of human biology can be addressed to some extent from ancient genetics, where suitable bones are available. However, the ‘Our Way Model’ is driven by climate modelling and archaeology. It outputs an historical estimate of ‘human existence potential’ (HEP) that includes predictions of carbon storage in plants and animals – i.e.  potential food resources – expressed as regional population density in Europe. The technical details are complex, but Shao et al.’s conclusions are quite striking.

Maps of estimated anatomically modern human population density during the first six thousand years of Aurignacian migration and palaeoclimate record from the Greenland NGRIP ice core, with shaded warm episodes – red spots indicate the time of the population estimates above. (Credit: Shao et al. Fig. 1)

Climate change in the later stages of cooling towards the last glacial maximum at ~20 ka was cyclical, with ten Dansgaard-Oeschger cold stadial events capable of ‘knocking back’ both population density and the extent of settlement. In the first two millennia expansion from the Levant into the Balkans was slow. From 43 to 41 ka the pace quickened, taking the Aurignacian culture into Western Europe, with an estimate total European AMH population of perhaps 60 thousand. A third phase (41 to 39 ka) shrank the areas and densities of population during a prolonged cold period. The authors suggest that survival was in Alpine refuge areas that AMH people had occupied previously. Starting at around 38 ka, a lengthy climatic warm period allowed the culture to spread to its maximum extent reaching southern Britain and the north and east of the Iberian Peninsula. Perhaps by then the AMH population had evolved better strategies to adapt to increasing frigid conditions. But by that time the Neanderthals had disappeared from Europe freeing up territory and food resources. That too may have contributed to the expansion and the sustenance of an AMH total population of between 80 and 100 thousand during the second phase of the Aurignacian.

It’s as well to remember that this work is based on a model, albeit sophisticated, based on currently known data. Palaeoanthropology is extremely prone to surprises as field- and lab work progresses …

See also: New population model identifies phases of human dispersal across Europe. EurekaAlert, 4 September 2024; Kambani, K. 2024. The Dynamics of Early Human Dispersal Across Europe: A New Population Model. Anthropology.net, 4 September 2024.

Climate changes and the mass extinction at Permian-Triassic boundary

The greatest mass extinction in Earth’s history at around 252 Ma ago snuffed out 81% of marine animal species, 70% of vertebrates and many invertebrates that lived on land. It is not known how many land plants were removed, but the complete absence of coals from the first 10 Ma of the Early Triassic suggests that luxuriant forests that characterised low-lying humid area in the Permian disappeared. A clear sign of the sudden dearth of plant life is that Early Triassic river sediments were no longer deposited by meandering rivers but by braided channels. Meanders of large river channels typify land surfaces with abundant vegetation whose root systems bind alluvium. Where vegetation cover is sparse, there is little to constrain river flow and alluvial erosion, and wide braided river courses develop (see: End-Permian devastation of land plants; September 2000. You can follow 21st century developments regarding the P-Tr extinction using the Palaeobiology index).

The most likely culprit was the Siberian Trap flood basalts effusion whose lavas emitted huge amounts of CO2 and even more through underground burning of older coal deposits (see: Coal and the end-Permian mass extinction; March 2011) which triggered severe global warming. That, however, is a broad-brush approach to what was undoubtedly a very complex event. Of about 20 volcanism-driven global warming events during the Phanerozoic only a few coincide with mass extinctions. Of those none comes close the devastation of ‘The Great Dying’, which begs the question, ‘Were there other factors at play 252 Ma ago?’ That there must have been is highlighted by the terrestrial extinctions having begun significantly earlier than did those in marine ecosystems, and they preceded direct evidence for climatic warming. Also temperature records – obtained from shifts in oxygen isotopes held in fossils – for that episode are widely spaced in time and tell palaeoclimatologists next to nothing about the details of the variation of air- and sea-surface temperature (SST) variations.

Modelled sea-surface temperatures in the tropics in the early stages of Siberian Trap eruptions with atmospheric CO¬2 at 857 ppm – twice today’s level. (Credit: Sun et al., Fig. 1A)

Earth at the end of the Permian was very different from its current wide dispersal of continents and multiple oceans and seas. Then it was dominated by Pangaea, a single supercontinent that stretched almost from pole to pole, and a surrounding vast ocean known as Panthalassa. Geoscientists from China, Germany, Britain and Austria used this simple palaeogeography and the available Early Triassic greenhouse-gas and  palaeo-temperature data as input to a climate prediction model (HadCM3BL) (Yadong Sun and 7 others 2024. Mega El Niño instigated the end-Permian mass extinction. Science 385, p. 1189–1195; DOI: 10.1126/science.ado2030  – contact yadong.sun@cug.edu.cn for PDF).. The computer model was developed by the Hadley Centre of the UK Met Office to assess possible global outcomes of modern anthropogenic global warming. It assesses heat transport by atmospheric flow and ocean currents and their interactions. The researchers ran it for various levels of atmospheric CO2 concentrations over the estimate 100 ka duration of the P-Tr mass extinction.

The pole-to-pole continental configuration of Pangaea lends itself to equatorial El Niño and El Niña type climatic events that occur today along the Pacific coast of the Americas, known as the El Niño-Southern Oscillation. In the first, warm surface water builds-up in the eastern tropical Pacific Ocean. It then then drifts westwards to allow cold surface water to flow northwards along the Pacific shore of South America to result in El Niña. Today, this climatic ‘teleconnection’ not only affects the Americas but also winds, temperature and precipitation across the whole planet. The simpler topography at the end of the Permian seems likely to have made such global cycles even more dominant.

Sun et al’s simulations used stepwise increases in the atmospheric concentration of CO2 from an estimated  412 parts per million (ppm) before the eruption of the Siberian Traps (similar to those today) to a maximum of 4000 ppm during the late-stage magmatism that set buried coals ablaze. As levels reached 857 ppm SSTs peaked at 2 °C above the mean level during El Niño events and the cycles doubled in length. Further increase in emissions led to greater anomalies that lasted longer, rising to 4°C above the mean at 4000 ppm. The El Niña cooler parts of the cycle steadily became equally anomalous and long lasting. This amplification of the 252 Ma equivalent of the El Niño-Southern Oscillation would have added to the environmental stress of an ever increasing global mean surface temperature.  The severity is clear from an animation of mean surface temperature change during a Triassic ENSO event.

Animation of monthly average surface temperatures across the Earth during an ENSO event at the height of the P-Tr mass extinction. (Credit: Alex Farnsworth, University of Bristol, UK)

The results from the modelling suggest increasing weather chaos across the Triassic Earth, with the interior of Pangaea locked in permanent drought. Its high latitude parts would undergo extreme heating and then cooling from 40°C to -40°C during the El Niño- El Niña cycles. The authors suggest that conditions on the continents became inimical for terrestrial life, which would be unable to survive even if they migrated long distances. That can explain why terrestrial extinctions at the P-Tr boundary preceded those in the global ocean. The marine biota probably succumbed to anoxia (See: Chemical conditions for the end-Permian mass extinction; November 2008)

There is a timely warning here. The El Niño-Southern Oscillation is becoming stronger, although each El Niño is a mere 2 years long at most, compared with up to 8 years at the height of the P-Tr extinction event. But it lay behind the record 2023-2024 summer temperatures in both northern and southern hemispheres, the North American heatwave of June 2024 being 15°C higher than normal. Many areas are now experiencing unprecedentedly severe annual wildfires. There also finds a parallel with conditions on the fringes of Early Triassic Pangaea. During the early part of the warming charcoal is common in the relics of the coastal swamps of tropical Pangaea, suggesting extensive and repeated wildfires. Then charcoal suddenly vanishes from the sedimentary record: all that could burn had burnt to leave the supercontinent deforested.

See also: Voosen, P. 2024. Strong El Niños primed Earth for mass extinction. Science 385, p. 1151; DOI: 10.1126/science.z04mx5b; Buehler, J. 2024. Mega El Niños kicked off the world’s worst mass extinction. ScienceNews, 12 September 2024.

A 9-day seismic reverberation set off by a giant tsunami in a Greenland fjord

In September 2023 the global network of seismic recorders detected a sequence of low-strength earth movements. It resembled the reverberation of a church bell albeit one that lasted for 9 days. rising and falling in strength every 90 seconds. For months this strange event on seismograms baffled geophysicists. All they could tell was that the signals did not show signs of having been generated by earthquakes; they were too regular. It was, however, possible to triangulate the position of the source of each individual event. There turned out to be only a single location for the seismic ‘campanology’ – at about 73° N on the eastern coast of Greenland, in Dickson Fjord and isolated branch of the enormous Kong Oscar Fjord system. Greenland is not noted for volcanic activity, ruling out the rumblings of a magma chamber that sometimes presages major eruptions. Whatever the cause, there were no human witnesses at the time. The only real clue lay at the start of the signal: the very long-period (VLP) signal was preceded by a sharp, high energy signal that could be matched with some kind of landslide.

View of a side glacier on Dickson Fjord, East Greenland where the tsunami occurred. Left – August 2023; right – 19 September 2023. The rocky peak at top centre on the left fell onto the glacier below to generate a rock-ice slide into the fjord. (Credit: Søren Rysgaard/Danish Army)

On 16 September 2023 the military base for the famous Sirius Dog Sled Patrol on Ella Island was smashed by a tsunami – fortunately it had been closed for the coming winter. When the Danish Navy patrolled Dickson Fjord some days later they found clear signs that the shores opposite the site of a recent colossal rock and ice slide (see images) had been scoured to a height of 200 m. For 5 km either side shoreline scouring averaged 60 m. The initial tsunami was gigantic, yet the fjord was able to contain its worst effects because the outlet to the rest of the system was at right angles to its trend. Some energy obviously was released to reach Ella Island near the mouth of the system to destroy the Danish Army post. The bizarre seismic signal was probably a result of the displaced water sloshing around in the fjord to dissipate the enormous energy released by the collapse of a mountain peak and a substantial amount of a valley glacier. Such behaviour is known as a seiche. Topographic analysis of Dickson Fjord enabled the researchers to calculate its resonant frequency: at 11 millihertz it matched that of the fluctuating seismic signal. (Svennevig, K. and 67 others 2024. A rockslide-generated tsunami in a Greenland fjord rang Earth for 9 days. Science, v. 385, p. 1196-1205; DOI: 10.1126/science.adm9247).

Valley glaciers in Greenland bolster their rocky flanks against collapse. With climatic warming being much faster there than for the rest of the world, its almost innumerable valley glaciers are shrinking. Yet they have been eroding the crust for tens of thousand years. The fjords that they occupied at the height of the last glacial maximum have very steep sides. Likewise, the remaining glaciers have carved U-shaped valleys. So when the glaciers retreat their exposed flanks become gravitationally unstable. Despite the fact that much of Greenland is underpinned by very hard crystalline rocks, that presents a major hazard for water craft. East Greenland’s spectacular scenery draws many tourist cruisers and Innuit fishing boats each summer. Moreover, removal of the ice load allows elastic strain that had built up in the upper crust to be released along joint systems that further weaken resistance to collapse.

A great deal of publicity has been given to the rapid melting of the huge ice sheet that covers most of Greenland. That is currently the biggest contributor to sea-level rise: a few millimetres per year. The Dickson Fjord event highlights the potential deadly threat of deglaciation, although the extremely complex nature of most of its fjord systems may prevent regional tsunamis from escaping their damping effect. Bu there are increasing dangers from the largest, more open fjords, such as Scoresby Sund, which conceivably might blurt catastrophic tsunamis towards Iceland, Svalbard and the west coast of Norway. Even small ones could wreak havoc on wildlife, such as seal and walrus nurseries.

See also: Carrillo-Ponce, A. et al. 2024. The 16 September 2023 Greenland Megatsunami: Analysis and Modeling of the Source and a Week‐Long, Monochromatic Seismic Signal. The Seismic Record, v. 4, p. 172-183; DOI: 10.1785/0320240013; Le Page, M. 2024. Greenland landslide caused freak wave that shook Earth for nine days. New Scientist 12 September 2024

Provenance of the Stonehenge Altar Stone: a puzzling development

 Curiously, two weeks after my previous post about Stonehenge, a wider geochemical study of the Devonian sandstones and a number of Neolithic megaliths in Orkney seems to have ruled out the Stonehenge Altar Stone having been transported from there (Bevins, R.E. et al. 2024. Was the Stonehenge Altar Stone from Orkney? Investigating the mineralogy and geochemistry of Orcadian Old Red sandstones and Neolithic circle monumentsJournal of Archaeological Science: Reports, v. 58, article 104738;   DOI: 10.1016/j.jasrep.2024.104738). Since two of the authors of Clarke et al. (2024) were involved in the newly published study, it is puzzling at first sight why no mention was made in that paper of the newer results. The fact that the topic is, arguably, the most famous prehistoric site in the world may have generated a visceral need for getting an academic scoop, only for it to be dampened a fortnight later. In other words, was there too much of a rush?

The manuscript for Clarke et al. (2024) was received by Nature in December 2023 and accepted for publication on 3 June 2024; a six-month turnaround and plenty of time for peer review. On the other hand, Bevins et al. (2024) was received by the Journal of Archaeological Science on 23 July 2024, accepted a month later and then hit the website a week after that: near light speed in academic publishing. And it does not refer to the earlier paper at all, despite two of its authors’ having contributed to it. Clarke et al. (2024) was ‘in press’ before Bevins et al. (2024) had even hit the editor’s desk. The work that culminated in both papers was done in the UK, Australia, Canada and Sweden, with some potential for poor communication within the two teams. Whatever, the first paper dangled the carrot that Orkney might have been the Altar Stone’s source, on the basis of geochemical evidence that the grains that make up the sandstone could not have been derived from Wales but were from the crystalline basement of NE Scotland. The second shows that this ‘most popular’ Scottish source may be ruled out. To Orcadians and the archaeologists who worked there, long in the shade of vast outpourings from Salisbury Plain, this might come as a great disappointment.

Cyclical sediments of the Devonian Stromness Flagstones. (Credit Mike Norton, Wikimedia)

The latest paper examines 13 samples from 8 outcrops of the Middle Devonian Stromness Flagstones strata in the south of the main island of Orkney close to the Ring of Brodgar and the Stones of Stenness, and the individual monoliths in each. On the main island, however, there is a 500 m sequence of Stromness Flagstones in which can be seen 50 cycles of sedimentation. Each cycle contains sandstone beds of various thicknesses and textures. They are fluviatile, lacustrine or aeolian in origin. So the Neolithic builders of Orkney had a wide choice, depending on where they erected monumental structures. Almost certainly they chose monolithic stones where they were most easy to find: close to the coast where exposure can be 100 %. The Ring of Brodgar and the Stones of Stenness are not on the coast, so the enormous stones would have to be dragged there. There is an ancient pile of stones (Vestra Fiold) about 20 km to the NW where some of the mmegaliths may have been extracted, but ancient Orcadians would have been spoilt for choice if they had their hearts set on erecting monoliths!

In a nutshell, the geological case made by Bevins et al. (2024) for rejecting Orkney as the source for the Stonehenge Altar Stone (AS) is as follows: 1. Grains of the mineral baryte (BaSO) present in the AS are only found in two of the Orkney rock samples. 2. All the Orcadian sandstone samples contain lots of grains of K-feldspar (KAlSi3O8) – common in the basement rocks of northern Scotland – but the AS contains very little. 3. A particular clay mineral (tosudite) is plentiful in the AS, but was not detected in the rock samples from Orkney. Does that rule out a source in Orkney altogether? Well, no: only the outcrops and megalith samples involved in the study are rejected.

To definitely negate an Orcadian source would require a monumental geochemical and mineralogical study across Orkney; covering every sedimentary cycle. Searching the rest of the Old Red Sandstone elsewhere in NE Scotland – and there is a lot of it – would be even more likely to be fruitless. Tracking down the source for the basaltic bluestones at Stonehenge was easy by comparison, because they crystallised from a particular magma over a narrow time span and underwent a specific degree of later metamorphism. They were easily matched visually and under the microscope with outcrops in West Wales in the 1920s and later by geochemical features common to both.

But all that does not detract from the greater importance of the earlier paper (Clarke et al., 2024), which enhanced the idea of Neolithic cultural coherence and cooperation across the whole of Britain. The building of Stonehenge drew people from the far north of Scotland together with those of what are now Wales and England. Since then it hasn’t always been such an amicable relationship …

See also:  Addley, E. 2024. Stonehenge tale gets ‘weirder’ as Orkney is ruled out as altar stone origin. The Guardian 5 September 2024.

Geology cracks Stonehenge mysteries

High resolution vertical aerial photograph of Stonehenge. (Credit: Gavin Hellier/robertharding/Getty)

During the later parts of the Neolithic the archipelago now known as the British Isles and Ireland was a landscape on which large stone buildings with ritual and astronomical uses were richly scattered. The early British agricultural societies also built innumerable monuments beneath which people of the time were buried, presumably so that they remained in popular memory as revered ancestors. Best known among these constructions is the circular Stonehenge complex of dressed megaliths set in the riot of earlier, contemporary and later human-crafted features of the Chalk downs known as Salisbury Plain. Stonehenge itself is now known to have been first constructed some five thousand years ago (~3000 BCE) as an enclosure surrounded by a circular ditch and bank, together with what seems to have been a circular wooden palisade. This was repeatedly modified during the following two millennia. Around 2600 BCE the wooden circle was replaced by one of stone pillars, each weighing about 2 t. These ‘bluestones’ are of mainly basaltic igneous origin unknown in the Stonehenge area itself. The iconic circle of huge, 4 m monoliths linked by 3 m lintel stones that enclose five even larger trilithons arranged in a horseshoe dates to the following two-centuries to 2400 BCE coinciding with the Early Bronze Age when newcomers from mainland Europe – perhaps as far away as the steppe of western Russia – began to replace or assimilate the local farming communities. This phase included several major modifications of the earlier bluestones.

It might seem that the penchant for circular monuments began with the Neolithic people of Salisbury Plain, and then spread far and wide across the archipelago in a variety of sizes. However, it seems that building of sophisticated monuments, including stone circles, began some two centuries earlier than in southern England in the Orkney Islands 750 km further north and, even more remote, in the Outer Hebrides of Scotland. A variety of archaeological and geochemical evidence, such as the isotopic composition of the bones of livestock brought to the vicinity of Stonehenge during its period of development and use, strongly suggests that people from far afield participated. Remarkably, a macehead made of gneiss from the Outer Hebrides turned up in an early Stonehenge cremation burial. Ideas can only have spread during the Neolithic through the spoken word. As it happens, the very stones themselves came from far afield. The earliest set into the circular structure, the much tinkered-with bluestones, were recognised to be exotic over a century ago. They match late Precambrian dolerites exposed in western Wales, first confirmed in the 1980s through detailed geochemical analyses by the late Richard Thorpe and his wife Olwen Williams-Thorpe of the Open University. Some suggested that they had been glacially transported to Salisbury Plain, despite complete lack of any geological evidence. Subsequently their exact source in the Preseli Hills was found, including a breakage in the quarry that exactly matched the base of one of the Stonehenge bluestones. They had been transported 230 km to the east by Neolithic people, using perhaps several means of transport. The gigantic monoliths, made of ‘sarsen’ – a form of silica-cemented sandy soil or silcrete – were sourced from some 25 km away where Salisbury Plain is still liberally scattered with them. Until recently, that seemed to be that as regards provenance, apart from a flat, 5 x 1 m slab of sandstone weighing about 6 t that two fallen trilithon pillars had partly hidden. At the very centre of the complex, this had been dubbed the ‘Altar Stone’, originally supposed to have been brought with the bluestones from west Wales.

The stones of Stonehenge colour-coded by lithology. The sandstone ‘Altar Stone’ lies beneath fallen blocks of a trilithon at the centre of the circle. (Credit: Clarke et al. 2024, Fig 1a)

A group of geologists from Australia and the UK, some of whom have long been engaged with Stonehenge, recently decided to apply sophisticated geochemistry at two fragments broken from the Altar Stone, presumably when the trilithons fell on it (Clarke, A. J. I. et al.2024.  A Scottish provenance for the Altar Stone of Stonehenge. Nature v.632, p. 570–575; DOI: 10.1038/s41586-024-07652-1). In particular they examined various isotopes and trace-elements in sedimentary grains of zircon, apatite and rutile that weathering of igneous rocks had contributed to the sandstone, along with quartz, feldspar, micas and clay minerals. It turned out that the zircon grains had been derived from Mesoproterozoic and Archaean sources beneath the depositional site of the sediment (the basement). The apatite and rutile grains show clear signs of derivation from 460 Ma old (mid-Ordovician) granites. The basement beneath west Wales is by no stretch of the imagination a repository of any such geology. That of northern Scotland certainly does have such components, and it also has sedimentary rocks derived from such sources: the Devonian of Orkney and mainland Scotland surrounding the Moray Firth. Unlike the lithologically unique bluestones, the sandstone is from a thick and widespread sequence of terrestrial sediments colloquially known as the ‘Old Red Sandstone’. The ORS of NE Scotland was deposited mainly during the Devonian Period (419 to 369 Ma) as a cyclical sequence in a vast, intermontane lake basin. Much the same kinds of rock occur throughout the sequence, so it is unlikely that the actual site where the ‘Alter Stone’ was selected will ever be known.

To get the ‘Alter Stone’ (if indeed that is what it once was) to Stonehenge demanded transport from its source over a far more rugged route, three times longer than the journey that brought the bluestones from west Wales: at least 750 km. It would probably have been dragged overland. Many Neolithic experts believe that transport of such a large block by boat is highly unlikely; it could easily have been lost at sea and, perhaps more important, few would have seen it. An overland route, however arduous, would have drawn the attention of everyone en route, some of whom might have been given the honour of helping drag such a burden for part of the way. The procession would certainly have aroused great interest across the full extent of Britain. Its organisers must have known its destination and what it signified, and the task would have demanded fervent commitment. In many respects it would have been a project that deeply unified most of the population. That could explain why people from near and far visited the Stonehenge site, herding livestock for communal feasting on arrival. Evidence is now pointing to the construction and use of the ritual landscape of Salisbury Plain as an all-encompassing joint venture of most of Neolithic Britain’s population. It would come as no surprise if objects whose provenance is even further afield come to light. It remained in use and was repeatedly modified during the succeeding Bronze Age up to 1600 BCE. By that time, the genetic group whose idea it was had been assimilated, so that only traces of its DNA remain in modern British people. This seems to have resulted from waves of immigrants from Central Europe, the Yamnaya, who brought new technology and the use of metals and horses.

See also: Gaind, N. & Smith, R. 2024. Stonehenge’s enigmatic centre stone was hauled 800 kilometres from Scotland. Nature, v. 632, p. 484-485; DOI: 10.1038/d41586-024-02584-2; Addley, E. 2024. Stonehenge megalith came from Scotland, not Wales, ‘jaw-dropping’ study finds. The Guardian, 14 August 2024.

News about ‘hobbits’ (Homo floresiensis)

The roof lifted for palaeoanthropologists in October 2004 when news emerged of a fossil from Liang Bua cave on Flores in the Indonesian archipelago. It was an adult female human skull about a third the size of those of anatomically modern humans (see: The little people of Flores, Indonesia; October 2004). Immediately it was dubbed ‘Hobbit’, and from the start controversy raged around this diminutive human. The cave layer contained evidence of fire and sophisticated tools as well as bones of giant rats and minute elephants, presumed to be staple prey for these little people. Despite having brains about the size of a grapefruit – as did australopithecines – the little people challenged our assumptions about intelligence. Preliminary dating from 95 to 17 ka suggested they may have cohabited Indonesia with both H. erectus and AMH. Indeed, modern people of Flores tell legends of the little people they call Ebo Go Go. Like both their ancestors must have crossed treacherous straits between the Indonesian islands, which existed even when global sea level was drawn down by polar icecaps. Once an early suggestion that the original find was the skull of a deformed, microcephalic individual had been refuted by further finds in Flores, scientists turned to natural selection of small stature through living on a small island with limited resources – similar to the tiny elephant Stegodon and other island faunas elsewhere. By 2007, it had become clear from other, similar fossils that they were definitely a distinct species Homo floresiensis (see: Now we can celebrate the ‘Hobbits’! November 2007) with several anatomical similarities to H. erectus. Then more sophisticated dating revealed that the Flores cave sediments containing their fossils and tools spanned 100 to 60 ka, well before AMH reached Indonesia. By 2018 their arrival on Flores, marked by a mandible fragment and 6 teeth in sediments from sediment excavation at Mata Menge 70 km east of Luing Bua, had been pushed back to 773 ka.  At the new site stone tools were found in even earlier sediments (1.02 Ma). In 2019 evidence emerged that isolated island evolution in the Philippines had produced similar small descendants (H. luzonensis) by around 67 ka.

Artist’s impression of Homo floresiensis with giant rat. (Credit: Box of Oddities podcast)

The latest development is the finding of a fragment of an adult humerus (an arm bone) in the Mata Menge excavations that had yielded the oldest dates for Homo floresiensis fossils (Kaifu, Y. and 12 others 2024. Early evolution of small body size in Homo floresiensis. Nature Communications, v. 15, article number 6381; DOI: 10.1038/s41467-024-50649-7). Comparing the teeth and arm-bone fragment with an intact adult from Liang Bua suggests that the earliest known ancestors of Homo floresiensis were even smaller. The teeth, albeit much smaller, resemble those of Indonesian specimens of H. erectus. That observation helps to rule out earlier speculation that the tiny people of Flores descended from the earliest humans from Africa (H. habilis) that were about the same size, but more than twice as old (2.3 to 1.7 Ma). The evidence points more plausibly towards their evolution from Asian H. erectus, who arrived in Java around 1.1 million years ago. Having solved the issue of ‘island hopping’ to reach Java a group of Asian H. erectus could have found their way to Flores. That island’s biological resources may not have met the survival requirements of a much larger human ancestor but evolution in isolation kept the arrivals alive. Within 300 ka, and perhaps much less for a small population, survival of smaller offspring allowed them a very long and apparently quite comfortable stay on the island. Though diminished in stature, they demonstrated the survival strategies conferred by being smart.

The gross uncertainty of climate tipping points

That the Earth has undergone sudden large changes is demonstrated by all manner of geoscientific records. It seems that many of these catastrophic events occurred whenever steady changes reach thresholds that trigger new behaviours in the interlinked atmosphere, hydrosphere, atmosphere, biosphere and lithosphere that constitute the Earth system. The driving forces for change, both steady and chaotic, may be extra-terrestrial, such as the Milankovich cycles and asteroid impacts, due to Earth processes themselves or a mixture of the two. Our home world is and always has been supremely complicated; the more obviously so as knowledge advances.  Abrupt transitions in components of the Earth system occur when a critical forcing threshold is passed, creating a ‘tipping point’. Examples in the geologically short term are ice-sheet instability, the drying of the Sahara, collapse of tropical rain forest in the Amazon Basin, but perhaps the most important is the poleward transfer of heat in the North Atlantic Ocean. That is technically known as the Atlantic Meridional Overturning Circulation with the ominous acronym AMOC.

Simplified Atlantic Meridional Overturning Circulation (AMOC). Red – warm surface currents; cyan – cold deep-water flow. (Credit: Stefano Crivellari)

As things stand today, warm Atlantic surface water, made more saline and dense by evaporation in the tropics is transferred northwards by the Gulf Stream. Its cooling at high latitudes further increases the density of this water, so at low temperatures it sinks to flow southwards at depth. This thermohaline circulation continually pulls surface water northwards to create the AMOC, thereby making north-western European winters a lot warmer than they would be otherwise. Data from Greenland ice cores show that during the climatic downturn to the last glacial maximum, the cooling trend was repeatedly interrupted by sudden warming-cooling episodes, known as Dansgaard-Oeschger events, one aspect of which was the launching of “armadas” of icebergs to latitudes as far south as Portugal (known as Heinrich events), which left their mark as occasional gravel layers in the otherwise muddy sediments on the deep Atlantic floor (see: Review of thermohaline circulation; February 2002).

These episodes involved temperature changes over the Greenland icecap of as much as 15°C.  They began with warming on this scale within a matter of decades followed by slow cooling to minimal temperatures, before the next turn-over. Various lines of evidence suggest that these events were accompanied by shutdowns of AMOC and hence the Gulf Stream, as shown by variations in the foraminifera species in sea-floor sediments. The culprit was vast amounts of fresh water pouring into the Arctic and northernmost Atlantic Oceans, decreasing the salinity and density of the surface ocean water. In these cases that may have been connected to repeated collapse of circumpolar ice sheets to launch Heinrich’s iceberg armadas. A similar scenario has been proposed for the millennium-long Younger Dryas cold spell that interrupted the onset of interglacial conditions. In that case the freshening of high-latitude surface water was probably a result of floods released when glacial barriers holding back vast lakes on the Canadian Shield burst.

At present the Greenland icecap is melting rapidly. Rising sea level may undermine the ice sheet’s coastal edges causing it to surge seawards and launch an iceberg armada. This may be critical for AMOC and the continuance of the Gulf Stream, as predicted by modelling: counter-intuitive to the fears of global warming, at least for NW Europe. In August 2024 scientists from Germany and the UK published what amounts to a major caution about attempts to model future catastrophes of this kind (Ben-Yami, M. et al 2024, Uncertainties too large to predict tipping times of major Earth system components from historical dataScience Advances, v. 10, article  eadl4841; DOI 10.1126/sciadv.adl4841). They focus on records of the AMOC system, for which an earlier modelling study predicted that a collapse could occur between 2025 and 2095: of more concern than global warming beyond the 1.5° C currently predicted by greenhouse-gas climate models .

Maya Ben-Yami and colleagues point out that the assumptions about mechanisms in Earth-system modelling and possible social actions to mitigate sudden change are simplistic.  Moreover, models used for forecasting rely on historical data sets that are sparse and incomplete and depend on proxies for actual variables, such as sea-surface and air temperatures. The further back in geological time, the more limited the data are. The authors assess in detail data sets and modelling algorithms that bear on AMOC. Rather than a chance of AMOC collapse in the 21st century, as suggested by others, Ben Yami et al. reckon that any such event  lies between 2055 and 8065 CE, which begs the question, “Is such forecasting  worth the effort?”, however appealing it might seem to the academics engaged in climatology. The celebrated British Met Office and other meteorological institutions, use enormous amounts of data, the fastest computers and among the most powerful algorithms on the planet to simulate weather conditions in the very near future. They openly admit a limit on accurate forecasting of no more than 7 day ahead. ‘Weather’ can be regarded as short-term climate change.

It is impossible to stop scientists being curious and playing sophisticated computer games with whatever data they have to hand. Yet, while it is wise to take climate predictions with a pinch of salt because of their gross limitations, the lessons of the geological past do demand attention. AMOC has shut down in the past – the last being during the Younger Dryas – and it will do so again. Greenhouse global warming probably increases the risk of such planetary hiccups, as may other recent anthropogenic changes in the Earth system. The most productive course of action is to reduce and, where possible, reverse those changes. In my honest opinion, our best bet is swiftly to rid ourselves of an economic system that in the couple of centuries since the ‘Industrial Revolution’ has wrought these unnatural distortions.