Flourishing life during a Snowball Earth period

That glacial conditions were able to spread into tropical latitudes during the late Neoproterozoic, Cryogenian Period is now well established, as are the time spans of two such events. http://earth-pages.co.uk/2015/05/21/snowball-earth-events-pinned-down/ But what were the consequences for life that was evolving at the time? That something dramatic was occurring is signalled by a series of perturbations in the carbon-isotope composition of seawater. Its relative proportion of 13C to 12C (δ13C) fell sharply during the two main Snowball events and at other times between 850 to 550 Ma. Since 12C is taken up preferentially by living organisms, falls in δ13C are sometimes attributed to periods when life was unusually suppressed. It is certain that the ‘excursions’ indicate that some process(es) must have strongly affected the way that carbon was cycled in the natural world.

English: Earth, covered in ice.
Artist’s impression of a Snowball Earth as it would appear with today’s continental configuration adjacent to the East Pacific Ocean. (Photo credit: Wikipedia)

The further sea ice extended beyond landmasses during Snowball events the more it would reduce the amount of sunlight reaching the liquid ocean and so photosynthesis would be severely challenged. Indeed, if ice covered the entire ocean surface – the extreme version of the hypothesis – each event must have come close to extinguishing life. An increasing amount of evidence, from climate- and oceanographic modelling and geological observation, suggests that a completely icebound Earth was unlikely. Nevertheless, such dramatic climate shifts would have distressed living processes to the extent that extinction rates were high and so was adaptive radiation of survivors to occupy whatever ecological niches remained or came into being: evolution was thereby speeded up. The roughly half-billion years of the Neoproterozoic hosted the emergence and development of multicellular organisms (metazoan eukaryotes) whose cells contained a nucleus and other bodies such as mitochondria and the chloroplasts of photosynthesisers. This hugely important stage of evolution burst forth shortly after – in a geological sense – the last Snowball event, during the Ediacaran and the Cambrian Explosion. But recent investigations by palaeontologists in glaciogenic rocks from China unearthed a rich diversity of fossil organisms that thrived during a Snowball event (Ye, Q. et al. 2015. The survival of benthic macroscopic phototrophs on a Neoproterozoic snowball Earth. Geology, v. 43, p. 507-510).

The Nantuo Formation in southern China contains glaciogenic sedimentary rocks ascribed to the later Marinoan glaciation (640 to 635 Ma). Unusually, the pebbly Nantuo glaciogenic rocks contain thin layers of siltstones and black shales. The fact that these layers are free of coarse fragments that floating ice may have dropped supports the idea that open water did exist close to glaciated landmasses in what is now southern China. Palaeomagnetic measurements show that the area was at mid-latitudes during the Marinoan event. The really surprising feature is that they contain abundant, easily visible fossils in the form of carbonaceous ribbons , disks, branching masses and some that dramatically resemble complex multi-limbed animals, though they are more likely to be part of an assemblage of algal remains. Whatever their biological affinities, the fossils clearly signify that life happily flourished beneath open water where photosynthesis provided a potential base to a food chain, though no incontrovertible animals occur among them.

See also: Corsetti, F.A. 2015. Live during Neoproterozoic Snowball Earth. Geology, v. 43, p. 559-560.

Snowball Earth events pinned down

The Period that lasted from 850 to 635 million years ago, the Cryogenian, takes its name from evidence for two and perhaps three episodes of glaciation at low latitudes. It has been suggested that, in some way, they were instrumental in the decisive stage of biological evolution from which metazoan eukaryotes emerged: the spectacular Ediacaran fossil assemblages follow on the heels of the last such event Although controversies about the reality of tropical latitudes experiencing ice caps have died away, there remains the issue of synchronicity of such frigid events on all continents, which is the central feature of so-called ‘Snowball Earth’ events. While each continent does reveal evidence for two low latitude glaciations – the Sturtian (~710 Ma) and the later Marinoan (~635 Ma) – in the form of diamictites (sediments probably dropped from floating ice and ice caps) it has proved difficult to date their start and duration. That is, the cold episodes may have been diachronous – similar conditions occurring at different localities at different times. Geochronology has, however, moved on since the early disputes over Snowball Earths and more reliable and precise dates for beginnings and ends are possible and have been achieved in several places (Rooney, A.D. et al. 2015. A Cryogenian chronology: Two long-lasting synchronous Neoproterozoic glaciations. Geology, v. 43, p. 459-462).

One computer simulation of conditions during a...
Computer simulation of conditions during a Snowball Earth period. (credit: Macmillan Publishers Ltd: Hyde et al., Nature 405:425-429, 2000)

Rooney and colleagues from Harvard and the University of Houston in the USA used rhenium-osmium radiometric dating in Canada, Zambia and Mongolia. The Re-Os method is especially useful for sulfide minerals as in the pyritic black shales that occur extensively in the Cryogenian, generally preceding and following the glacial diamictites and their distinctive carbonate caps. Combined with a few ages obtained by other workers using the Re-Os method and U-Pb dating of volcanic units that fortuitously occur immediately beneath or within diamictites, Rooney et al. establish coincident start and stop dates and thus durations of both the Sturtian and Marinoan glacial events: 717 to 660 Ma and 640 to 635 Ma respectively on all three continents. Their data is also said to refute the global extent and even the very existence of an earlier, Kaigas glacial event (~740 Ma) previous recorded from diamictites in Namibia, the Congo, Canada and central Asia. This assertion is based on the absence of diamictites with that age in the area that they studied in Canada and their own dating of a diamictite in Zambia, which is one that others assigned to the Kaigas event

The dating is convincing evidence for global glaciation on land and continental margins in the Cryogenian, as all the dates are from areas based on older continental crust. But the concept of Snowball Earth, in its extreme form, is that the oceans were ice-capped too as the name suggests, which remains to be convincingly demonstrated. That would only be achieved by suitably dated diamictites located on obducted oceanic crust in an ophiolite complex. Moreover, there are plenty more Cryogenian diamictites on other palaeo-continents and formed at different palaeolatitudes that remain to be dated (see here)

Wet spells in Arabia and human migration

In September 2014, Earth Pages  reported how remote sensing had revealed clear signs of extensive fossil drainage systems and lakes at the heart of the Arabian Peninsula, now the hyper-arid Empty Quarter (Rub al Khali). Their association with human stone artifacts dated as far back as 211 ka, those with affinities to collections from East Africa clustering between 74-90 ka, supported the sub-continent possibly having been an early staging post for fully modern human migrants from Africa. Member of the same archaeological team based at Oxford University have now published late Pleistocene palaeoclimatic records from alluvial-fan sediments in the eastern United Arab Emirates that add detail to this hypothesis (Parton, A. ­et al. 2015. Alluvial fan records from southeast Arabia reveal multiple windows for human dispersal. Geology, advance online publication doi:10.1130/G36401.1).

The eastern part of the Empty Quarter is a vast bajada formed from coalesced alluvial fans deposited by floods rising in the Oman Mountains and flowing westwards to disappear in the great sand sea of dunes. Nowadays floods during the Arabian Sea monsoons are few and far between, and restricted to the west-facing mountain front. Yet, older alluvial fans extend far out into the Empty Quarter, some being worked for aggregate used in the frantic building boom in the UAE. In one of the quarries, about 100 km south of the Jebel Faya Upper Palaeolithic tool site , the alluvial deposit contains clear signs of cyclical deposition in the form of 13 repeated gradations from coarse to fine waterlain sediment, each capped by fossil soils and dune sands. The soils contain plant remains that suggest they formed when the area was colonized by extensive grasslands formed under humid conditions.

Dating the sequence reveals that 6 of the cycles formed over a 10 thousand-year period between 158 to 147 ka, which coincides with a peak in monsoon intensity roughly between 160 and 150 ka during the glacial period that preceded the last one. Three later cycles formed at times of monsoon maxima during the last interglacial and in the climatic decline leading to the last glacial maximum, at ~128 to 115 ka, 105 to 95 ka, 85 to 74 ka. So, contrary to the long-held notion that the Arabian Peninsula formed a hostile barrier to migration, from time to time it was a well watered area that probably had abundant game. Between times, though, it was a vast, inhospitably dry place.

English: SeaWiFS collected this view of the Ar...
Satellite view of the Arabian Peninsula. The Oman mountains sweep in a dark arc south eastwards from the Staits of Hormuz at the mouth of the Persian Gulf. The brownish grey area to the south of the arc is the bajada that borders the bright orange Empty Quarter (credit: NOAA)

The authors suggest that the climatic cyclicity was dominated by a 23 ka period. As regards the southern potential migration route out of Africa, via the Straits of Bab el Mandab, which has been highly favoured by palaeoanthropologists lately, opportunities for migration in the absence of boats would have depended on sea-level lows. They do not necessarily coincide with wet windows of opportunity for crossing the cyclically arid Arabian peninsula that would allow both survival and proceeding onwards to south and east Asia. So far as I can judge, the newly published work seems to favour a northward then eastward means of migration, independent of fluctuations in land-ice volume and sea level, whenever the driest areas received sufficient water to support vegetation and game. In fact most of NE Africa is subject to the Arabian Sea monsoons, and when they were at their least productive crossing much of Ethiopia’s Afar depression and the coastal areas of Eritrea, Sudan and Egypt would have been almost as difficult as the challenge of the Empty Quarter.

Glacial cycles and sea-floor spreading

The London Review of Books recently published a lengthy review (Godfrey-Smith, P. 2015. The Ant and the Steam Engine. London Review of Books, v. 37, 19 February 2015 issue, p. 18-20) of the latest contribution to Earth System Science by James Lovelock, the man who almost singlehandedly created that popular paradigm through his Gaia concept of a self-regulating Earth (Lovelock, J. A Rough Ride to the Future. Allen Lane: London; ISBN 978 0 241 00476 0). Coincidentally, on 5 February 2015 Science published online a startling account of the inner-outer-inner synergism of Earth processes and climate (Crowley, J.W. et al. 2015. Glacial cycles drive variations in the production of oceanic crust. Science doi:10.1126/science.1261508). In fact serendipity struck twice: the following day a similar online article appeared in a leading geophysics journal (Tolstoy, M. 2015. Mid-ocean ridge eruptions as a climate valve. Geophysical Research Letters, doi:10.1002/2014GL063015)

Both articles centred on the most common topographic features on the ocean floor, abyssal hills. These linear features trend parallel to seafloor spreading centres and the magnetic stripes, which chart the progressive additions to oceanic lithosphere at constructive margins. Abyssal hills are most common around intermediate- and fast-spreading ridges and have been widely regarded as fault-tilt blocks resulting from extensional forces where cooling of the lithosphere causes it to sag towards the abyssal plains. However, some have suggested a possible link with variations in magma production beneath ridge axes as pressure due to seawater depth varied with rising and falling sea level through repeated glacial cycles. Mantle melting beneath ridges results from depressurization of rising asthenosphere: so-called ‘adiabatic’ melting. Pressure changes equivalent to sea-level fluctuations of around 100-130 m should theoretically have an effect on magma productivity, falls resulting in additional volumes of lava erupted on the ocean floor and thus bathymetric highs.

English: A close-up showing mid-ocean ridge to...
Formation of mid-ocean ridge topography, including abyssal hills that parallel the ridge axis. (credit: Wikipedia)

A test of this hypothesis would be see how the elevation of the sea floor adjacent to spreading axes changes with the age of the underlying crust. John Crowley and colleagues from Oxford and Harvard Universities and the Korea Polar Research Institute analysed new bathymetry across the Australian-Antarctic Ridge, whereas Maya Tolstoy of Columbia University performed similar work across the Southern East Pacific Rise. In both studies frequency analysis of changes in bathymetry through time, as calibrated by local magnetic stripes, showed significant peaks at roughly 23, 41 and 100 ka in the first study and at 100 ka in the second. These correspond to the well known Milankovitch periods due to precession, changing axial tilt and orbital eccentricity: persuasive support for a glacial control over mid-ocean ridge magmatism.

Enlarged by 100% & sharpened file with IrfanView.
Periodicities of astronomical forcing and global climate over the last million years (credit: Wikipedia)

An interesting corollary of the observations may be that pulses in sea-floor eruption rates emit additional carbon dioxide, which eventually percolates through the ocean to add to its atmospheric concentration, which would result in climatic warming. The maximum effect would correspond to glacial maxima when sea level reached its lowest, the reduction in pressure stimulating the greatest magmatism. One of the puzzling features of glacial cycles over the last million years, when the 100 ka eccentricity signal dominates, is the marked asymmetry of the sea-level record; slowly declining to a glacial maximum and then a rapid rise due to warming and melting as the Earth changed to interglacial conditions. Atmospheric CO2 concentrations recorded by bubbles in polar ice cores show a close correlation with sea-level change indicated by oxygen isotope data from oceanic sediments. So it is possible that build-up of polar ice caps in a roundabout way eventually reverse cooling once they reach their greatest thickness and extents, by modulating ocean-ridge volcanism and thereby the greenhouse effect.

Reconstructing the structure of ancient vegetation canopies

One of the central measures used to describe modern ecosystems is the ratio of foliage area to that of the ground surface – the leaf area index (LAI) – which expresses the openness of vegetation canopies. A high LAI helps to retain moisture in the soil, partly by shading and cooling the surface to reduce evaporation and partly by stopping surface soil from being battered to a concrete-like consistency by heavy rain, which reduces the amount of water that can infiltrate. It is possible to estimate LAI across today’s entire land area using satellite image data but a proxy for palaeoecological LAI has remained hard to find.

English: Creative Commons attribution "ph...
Hemispherical photograph used to calculate modern canopy cover. (credit: Wikipedia; photo by S.B. Weiss)

The outer coating of leaves in well-shaded (high LAI) areas tends to have protective or pavement cells that are larger and have more complicated shapes than does that of leaves in more open canopies. The framework of leaf cells is silica-based and made up of structures known as phytoliths whose morphologies vary in much the same way as the cells that they support. So theoretically it is possible to use fossil phytoliths in terrestrial sediments to estimate LAI variations through time in local canopies, but first the approach needs a means of calibration from living ecosystems. The vegetation of Central American Costa Rica varies through the entire range of possible LAI values, which leads to varying amounts of sunlight available to the leaves of cover plants. Measuring the area and the degree of shape-complexity of phytoliths in modern soils there shows that each is positively correlated with LAI.

Lowland Paca near Las Horquetas, Costa Rica. F...
A modern herbivorous mammal (lowland paca) from dense forest in Costa Rica. (Photo credit: Wikipedia)

Putting this approach to use in the Cenozoic terrestrial sediments of Patagonia, US and Argentinean palaeoecologists aimed to examine how the evolution of the teeth of herbivorous mammals – a major feature in their speciation – linked to changes in vegetation structure (Dunn, R.E. et al. 2015. Linked canopy, climate and faunal change in the Cenozoic of Patagonia. Science, v. 347, p. 258-261). Using phytoliths they were able to show that in the Eocene the area was covered by dense, closed forest canopies that gradually became more open towards the end of the Eocene to be replaced by open forest and shrubland habitats in the Oligocene and Miocene, with a brief period of regreening. It was during the period of more open vegetation that tooth structure underwent the most change. Chances are that the vegetation shifts began in response to the onset of Antarctic glaciation at the beginning of the Oligocene Epoch and related climate change at the northern margin of the Southern Ocean. Changes in the herbivore teeth may have been in response to the increasing amount of dust adhering to leaves as canopies became more open and soil increasingly dried out.

Ants and carbon sequestration

Aside from a swift but highly unlikely abandonment of fossil fuels, reduction of greenhouse warming depends to a large extent, possibly entirely, on somehow removing CO2 from the atmosphere. Currently the most researched approach is simply pumping emissions into underground storage in gas permeable rock, but an important target is incorporating anthropogenic carbon in carbonate minerals through chemical interaction with potentially reactive rocks. In a sense this is a quest to exploit equilibria involving carbon compounds that dominate natural chemical weathering and to sequester CO2 in solid, stable minerals.

The two most likely minerals to participate readily in weathering that involves CO2 dissolved in water are plagioclase feldspar, a calcium-rich aluminosilicate and olivine, a magnesium silicate. Both are abundant in mafic and ultramafic rocks, such as basalt and peridotite, which themselves are among the most common rocks exposed at the Earth’s surface. The two minerals, being anhydrous, are especially prone to weathering reactions involving acid waters that contain hydrogen ions, and in the presence of CO2 they yield stable carbonates of calcium and magnesium respectively. Despite lots of exposed basalts and ultramafic rocks, clearly such natural sequestration is incapable of absorbing emissions as fast as they are produced.

One means of speeding up weathering is to grind up plagioclase- and olivine-bearing rocks and spread the resulting gravel over large areas; as particles become smaller their surface area exposed to weathering increases. Yet it doesn’t take much pondering to realise that a great deal of energy would be needed to produce sufficient Ca- and Mg-rich gravel to take up the approximately 10 billion tonnes of CO2 being released each year by burning fossil fuels: though quick by geological standards the reaction rates involved are painfully slow in the sense of what the climatic future threatens to do. So is there any way in which these reactions might be speeded up?

Two biological agencies are known to accelerate chemical weathering, or are suspected to do so: plant roots and animals that live in soil. Ronald Dorn of Arizona State University set out to investigate the extent to which such agencies do sequester carbon dioxide, under the semi-arid conditions that prevail in Arizona and Texas (Dorn, R.I. 2014. Ants as a powerful biotic agent of olivine and plagioclase dissolution. Geology, v. 42, p. 771-774). His was such a simple experiment that it is a wonder it had not been conducted long ago; but it actually took more than half his working life. Spaced over a range of topographic elevations, Dorn used an augur at each site to drill five half-metre holes into the root mats of native trees, established ant and termite colonies and bare soil surfaces free of vegetation or animal colonies, filling each with sand-sized crushed basalt.

Empire of the Ants (film)
Film poster for Empire of the Ants (starring Joan Collins) (credit: Wikipedia)

Every five years thereafter he extracted the basalt sand from one of the holes at each site and each soil environment. To assess how much dissolution had occurred he checked for changes in porosity, and heated the samples to temperatures where carbonates break down to discover how much carbonate had been deposited. That way he was able to assess the cumulative changes over a 25 year period relative to the bare-ground control sites. The results are startling: root mats achieved 11 to 49 times more dissolution than the control; termites somewhat less, at 10 to 19 times; while ants achieved 53 to 177 times more dissolution. While it was certain that the samples had been continuously exposed to root mats throughout, the degree of exposure to termites and ants is unknown, so the animal enhancements of dissolution are probably minima.

Microscopic examination of mineral grains exposed to ant activity shows clear signs of surface pitting and other kinds of decay. Chemically, the samples showed that exposure to ants consistently increased levels of carbonate in the crushed basalt sand compared with controls, with levels rising by 2 to 4% by mass, with some variation according to ant species. Clearly, there is some scope for a role for ants in carbon sequestration and storage; after all, there are estimated to be around 1013 to 1016 individual ants living in the world’s soils. In the humid tropics the total mass of ants may be up to 4 times greater than all mammals, reptiles and amphibians combined. There is more to learn, but probably a mix of acid secretions and bioturbation by ants and termites is involved in their dramatic effect on weathering. One interesting speculation is that ants may even have played a role in global cooling through the Cenozoic, having evolved around 100 Ma ago.

Arabia : staging post for human migrations?

English: SeaWiFS collected this view of the Ar...
The Arabian Peninsula from the SeaWIFS satellite (credit: Wikipedia)

From time to time between 130 and 75 ka fully modern humans entered the Levant from Africa, which is backed up by actual fossils. But up to about 2010 most palaeoanthropologists believed that they moved no further, because of the growth of surrounding deserts, and probably did not return to the Middle East until around 45 ka. The consensus for the decisive move out of Africa to Eurasia centred on crossings of the Straits of Bab el Mandab at the entrance to the Red Sea, when sea level fell to a level that would have allowed a crossing by rafting over narrow seaways. The most likely time for such n excursion was during a brief cool/dry episode around 67 ka that coincided with an 80 m fall in global sea level: the largest since the previous glacial maximum (see Evidence for early journeys from Africa to Asia).

In 2011 finds reported from the United Arab Emirates of ‘East African-looking’ Middle Palaeolithic tools in sediment layers dated at 125, 95 and 40 ka led some to speculate that there must have been an eastward move from the Levant by anatomically modern humans (see Human migration – latest news). That view stemmed from the fact that the earliest date was during the last interglacial when sea level would have been as high as it is today, and around 95 ka it would have been little different. That report coincided with others about freshwater springs having emanated from uplifted reefs around the edges of the Arabian Peninsula during the last interglacial, and the existence of substantial lakes deep within the subcontinent around that time (see Water sources and early migration from Africa). Substantial funding followed such exciting news and results of new research are just beginning to emerge (Lawler, A. 2014. In search of Green Arabia. Science, v. 345, p. 994-999).

Oasis of Green Mubazzarah near Al Ain
Al Ain, a rare spring-fed oasis in the eastern Rub al Khali near the UAE-Oman border (credit: Wikipedia)

A team led by Michael Petraglia of the University of Oxford has used field surveys and remote sensing to reveal a great many, now-vanished lakes across the Arabian Peninsula, including many in the fearsome Rub al Khali or Empty Quarter. They are linked by an extensive, partly sand-hidden network of palaeochannels, which include several of the major wadis; a system that once drained towards the Persian Gulf. As well as abundant freshwater molluscs and other invertebrates, former lakeshore sediments are littered with huge numbers of stone tools, also with East African affinities (Scerri, E.M.L. et al. 2014. Unexpected technological heterogeneity in northern Arabia indicates complex Late Pleistocene demography at the gateway to Asia. Journal of Human Evolution, In Press http://dx.doi.org/10.1016/j.jhevol.2014.07.002). Using optically stimulated luminescence dating, which shows how long stone objects have been buried, the British team has found tools dating back as long as 211 ka, with a cluster of dates between 90 to 74 ka. Modern humans, Neanderthals and even Denisovans may have made these tools; only associated fossil remains will tell. Yet it is already clear that for lengthy periods – perhaps of a few hundred or thousand years – the hyper-arid interior of Arabia was decidedly habitable. It may have been a thriving outpost of emigrants from Africa, whose abandonment as climate shifted to extreme dryness as the last interglacial gave way to Ice Age conditions, could well have been the source of the great migration that colonised the rest of the habitable world. Petraglia’s team has already courted controversy with their claim for anatomically modern humans’ tools in South Indian volcanic ash beds that date to the Toba eruption around 74 ka: considerably earlier than the more widely accepted post-65 ka dates of human eastward migration.

Evidence for North Atlantic current shut-down ~120 ka ago

Gulf stream map
Warming surface currents of the North Atlantic (credit: Wikipedia)

A stupendous amount of heat is shifted by ocean-surface currents, so they have a major influence over regional climates. But they are just part of ocean circulation systems, the other being the movement of water in the deep ocean basins. One driver of this world-encompassing system is water density; a function of its temperature and salinity. Cold saline water forming at the surface tends to sink, the volume that does being replaced by surface flow towards the site of sinking: effectively, cold downwellings ‘drag’ major surface currents along. This is especially striking in the North Atlantic where sinking cold brines are focused in narrow zones between Canada and Greenland and between Greenland and Iceland. From there the cold water flows southwards towards the South Atlantic at depths between 1 and 5 km. The northward compensating surface flow, largely from tropical seas of the Caribbean, is the Gulf Stream/North Atlantic Current whose warming influence on climate of western and north-western Europe extends into the Arctic Ocean.

Circulation in the Atlantic Ocean. the orange and red water masses are those of the Gulf stream and North Atlantic Deep Water (credit: Science,  Figure 1 in Galaasen et al. 2014)
Circulation in the Atlantic Ocean. the orange and red water masses are those of the Gulf stream and North Atlantic Deep Water (credit: Science, Figure 1 in Galaasen et al. 2014)


Since the discovery of this top-to-bottom ‘conveyor system’ of ocean circulation oceanographers and climatologists have suspected that sudden climate shifts around the North Atlantic, such as the millennial Dansgaard-Oeschger events recorded in the Greenland ice cores, may have been forced by circulation changes. The return to almost full glacial conditions during the Younger Dryas, while global climate was warming towards the interglacial conditions of the Holocene and present day, has been attributed to huge volumes of meltwater from the North American ice sheet entering the North Atlantic. By reducing surface salinity and density the deluge slowed or shut down the ‘conveyor’ for over a thousand years, thereby drastically cooling regional climate. Such drastic and potentially devastating events for humans in the region seem not to have occurred during the 11.5 thousand years since the end of the Younger Dryas. Yet their suspected cause, increased freshwater influx into the North Atlantic, continues with melting of the Greenland ice cap and reduction of the permanent sea-ice cover of the Arctic Ocean, particularly accelerated by global warming.


The Holocene interglacial has not yet come to completion, so checking what could happen in the North Atlantic region depends on studying previous interglacials, especially the previous one – the Eemian – from 130 to 114 ka. Unfortunately the high-resolution climate records from Greenland ice cores do not extend that far back. On top of that, more lengthy sea-floor sediment cores rarely have the time resolution to show detailed records, unless, that is, sediment accumulated quickly on the deep sea bed. One place that seems to have happened is just south of Greenland. Cores from there have been re-examined with an eye to charting the change in deep water temperature from unusually thick sediment sequences spanning the Eemian interglacial (Galaasen, E.V. and 7 others 2014. Rapid reductions in North Atlantic Deep Water during the peak of the last interglacial period. Science, v. 343, 1129-1132).


The approach taken by the consortium of scientiosts from Norway, the US, France and Britain was to analyse the carbon-isotope composition of the shells of foraminifers that lived in the very cold water of the ocean floor during the Eemian. The ratio of 13C to 12C, expressed as δ13C, fluctuates according to the isotopic composition of the water in which the forams lived. What show up in the 130-114 ka period are several major but short-lived falls in δ13C from the general level of what would then have been North Atlantic Deep Water (NADW). It seems that five times during the Eemian the flow of NADW slowed and perhaps stopped for periods of the order of a few hundred years. If so, then the warming influence of the Gulf Stream and North Atlantic Current would inevitably have waned through the same intervals. Confirmation of that comes from records of surface dwelling forams. This revelation should come as a warning: if purely natural shifts in currents and climate were able to perturb what had been assumed previously to be stable conditions during the last interglacial, what might anthropogenic warming do in the next century?


Enhanced by Zemanta

Did ice-age climate changes across Europe happen at the same time?

Although the frigid conditions at the last glacial maximum, around 19 to 20 thousand years ago, gradually relinquished their grip through slow global warming, this amelioration came to sudden stop around 12 800 years before the present. Northern hemisphere ice-core and other climate records show that there was a return to glacial conditions over a period of a few decades at most, to launch what is known as the Younger Dryas stadial that lasted over a thousand years until about 11 500 years ago, with the onset of the warm, climatically more stable Holocene that launched the transformation of the human way of life. The start of the Younger Dryas had dramatic effects throughout the northern hemisphere, the cold conditions emerging suddenly from an immense oceanographic change; a weakening or the halt of the North Atlantic thermohaline circulation in which cold, very salty surface waters at the fringe of the Arctic Ocean sink to drag warmer water to high latitudes. In short, the Gulf Stream slowed or stopped its warming influence at high northern latitudes.  Current thoughts centre on a freshening of surface sea water following the collapse of the North American ice sheet to gush meltwater and icebergs into the North Atlantic to buoy-up surface waters.

Iceage time 18kyr
Major climate shifts in Europe since 18 ka (credit: Wikipedia)

Most of the data about this climatic shock can only be dated accurately to within a few centuries: it is clear that the initial cooling was very rapid, on the scale of a few years, as was the warming that closed the Younger Dryas and marked the start of the Holocene, but the ‘when’ is known only to within a few hundred years. To resolve the start and stop ages needs records that include several indicators: clear signs of the beginning and end of the episode, an accurate means of dating them and confirmation from other sites, which presupposes a cast-iron means of correlating the records over large distances. The most reliable markers for correlation are volcanic ashes that can be dated radiometrically and which drift on the wind to be deposited over very large areas. If sedimentary sequences that accumulated continuously preserve such ashes, contain clear signs of climatic change and clearly record the passage of time in great detail, there is a chance of resolving climatic events very accurately; but they are no common.  A British-German team have located and analysed two such promising sites (Land, C.S. et al. 2013. Volcanic ash reveals time transgressive abrupt climate change during the Younger Dryas. Geology, v. 41, p. 1251-1254). One of them is from the bed of a lake that formed by a single volcanic eruption (Meerfelder Maar) in the Eifel region of western Germany. Quiet sediment accumulation has occurred there continuously to form very narrow, alternating dark and light layers, the variegation being due to sedimentation under ice in winter and open water in summer respectively. Twelve thousand of these annual varves provide a means of dating potentially with a precision of ± 1 year, but calibration to absolute time is necessary. The maar sediments contain three ash layers, two of which are from small local eruptions; the older having an age of 12 900 years before 2000 AD, the other being 11 000 years old, showing that the entire Younger Dryas is spanned by the Meerfelder Maar sediments. The third was dated by varve counting, showing the eruption had taken place 12 140 years ago. That age coincides closely with that of major eruption in Iceland.

Panorama Weinfelder Maar oder Totenmaar, Eifel
A typical volcanic maar in Eifel Region of Germany (credit: Wikipedia)

One prominent climatic feature of the Younger Dryas of Europe is a shift around halfway through: it started with the fiercest cold and then ameliorated. This change shows up in the Meerfelder Maar record as a reduction in mean varve thickness and an increase in the titanium content of the clays, the latter taking place in about a year (12 250 years ago) some 100 years before the Icelandic ash was deposited. The same kind of change occurs in records from lakes as far north as the Arctic Circle. One of the core records from Kråkenes in Northern Norway also contains the tell-tale Icelandic ash (as do ice cores from Greenland), but in its case it occurs 20 years before the abrupt climate shift. This clearly shows that major climate changes at the end of the last ice age occur at different times from place to place. The authors ascribe the 120 year difference between the two records to the times when prevailing, warm westerly winds began to affect central and northern Europe, linked to a gradual northward migration of the polar front. The data from both lakes also suggest that the Younger Dryas ended about 20 years earlier in Norway than in Germany, although Lane et al. do not comment..

Hitherto, correlation between climate records has been based on an assumption that major climate changes were at the same time, so that climate proxies such those discussed here have been ‘wiggle-matched’. Quite probably a lot of subtleties have thereby been missed.

Enhanced by Zemanta

Greening the Earth, Devonian forest fires and a mass extinction

Land plants begin to appear in the fossil record as early as the late Ordovician (~450 Ma), show signs of diversification during the Silurian and by the end of the Devonian Period most of the basic features of plants are apparent. During the Carboniferous Period terrestrial biomass became so high as to cause a fall in atmospheric carbon dioxide, triggering the longest period of glaciation of the Phanerozoic, and such a boost to oxygen in the air (to over 30%) that insects, huge by modern standards, were able to thrive and the risk of conflagration was perhaps at its highest in Earth’s history. Yet surprisingly, the first signs of massive forest fires appear in the Devonian when vegetation was nowhere near so widespread and luxuriant as it became in the Carboniferous (Kaiho, K. et al. 2013. A forest fire and soil erosion event during the Late Devonian mass extinction. Palaeogeography, Palaeoclimatology, Palaeoecology, v. 392, p. 272-280). Moreover, Devonian oxygen levels were well below those of the present atmosphere and CO2 was more than 10 times even the post-industrial concentration (387 parts per million in 2013). Such atmospheric chemistry would probably have suppressed burning.

Kunio Kaiho of Tohoku University in Japan and colleagues from Japan, the US and Belgium analysed organic molecules in Belgian marine sediments from the time of the late-Devonian mass extinction (around the Frasnian-Famennian boundary at 372 Ma). A range of compounds produced by hydrocarbon combustion show marked ‘spikes’ at the F-F boundary. The thin bed that marks the extinction boundary also shows sudden increase then decrease in δ13C and total organic carbon, indicative of increase burial of organic material and a likely increase in atmospheric oxygen levels. Another biomarker that is a proxy for soil erosion follows the other biogeochemical markers, perhaps signifying less of a binding effect on soil by plant colonisation: a likely consequence of large widlfires. Unlike the biomarkers, magnetic susceptibility of the boundary sediments is lower than in earlier and later sediments. This is ascribed to a decreased supply of detrital sediment to the Belgian marine Devonian basin, probably as a result of markedly decreased rainfall around the time of the late-Devonian mass extinction. But the magnetic data from 3 metres either side of the boundary also reveal the influence of the 20, 40, 100 and 405 ka Milankovich cycles.

Juan Ricardo Cortes , a placoderm from the Dev...
Dunkleosteus, a giant (10 m long) placoderm fish from the Devonian, which became extinct in the late Devonian along with all other placoderms (credit: Wikipedia)

This set of environmentally-related data encourages the authors to suggest a novel, if not entirely plausible, mechanism for mass extinction related to astronomically modulated dry-moist climate changes that repeatedly killed off vegetation so that dry woody matter could accumulate en masse during the Frasnian while atmospheric oxygen levels were too low for combustion. A mass burial of organic carbon at the end of that Age then boosted oxygen levels above the burning threshold to create widespread conflagration once the wood pile was set ablaze. Makes a change from continental flood basalts and extraterrestrial impacts… Yet it was about this time that vertebrates took it upon themselves to avail themselves of the new ecological niche provided by vegetation to haul themselves onto land.

Earth’s first major glacial epochs

The global glaciations of the Neoproterozoic that reached low latitudes – the so-called ‘Snowball Earth’ events have dominated accounts of ancient glaciations since the start of the 21st century. Yet they are not the oldest examples of large-scale effects of continental ice sheets. Distinctive tillites or diamictites that contain large clasts of diverse, exotic rocks occur in sedimentary sequences of Archaean and Palaeoproterozoic age.

Diamictite from the Palaoproterozoic Gowganda Formation in Ontario Canada (credit: Candian Sedimentology Research Group)
Diamictite from the Palaeoproterozoic Gowganda Formation in Ontario Canada (credit: Canadian Sedimentology Research Group)

This item can be read in full at Earth-logs in the Palaeoclimatology archive for 2013

New approach to the Milankovitch mystery

Melting pond on the ice sheet
Melting pond on the Greenland ice sheet (credit: Photo by Leif Taurer)

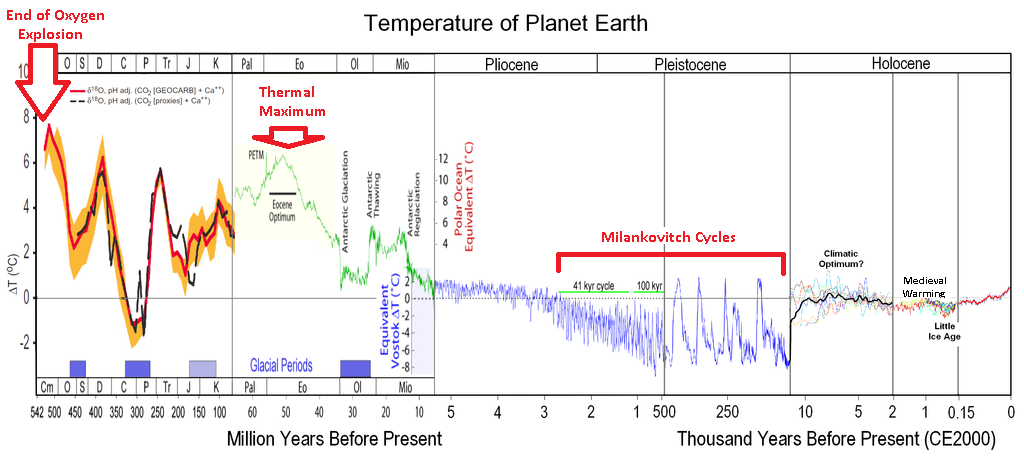
Milutin Milankovitch’s astronomical theory to account for glacial – interglacial cycles is based on 3 gravitational influences on the Earth that change the way it spins and orbits the Sun. Each is cyclic but with different periods: the angle of axial tilt every 41 ka; precession of its rotation axis on a 23 ka pacing; the change in shape of the orbit around the Sun over 100 ka. Each subtly affects the amount of solar energy, their influences combining to produce a seemingly complex, but predictable variation through time of solar heating for any point on the Earth’s surface. Milankovitch’s work was triumphantly confirmed when analysis of oxygen-isotope time series from sea-floor sediments revealed precisely these periods in the record of continental ice cover. Specifically, astronomical pacing of midsummer insolation at 65°N matches the real climatic pattern through time.

Yet the periods between glacial maxima have not stayed constant over the last 2 Ma or so (Figure showing Phanerozoic climate changes). About 0.8 to 1 Ma ago a sequence with roughly 41 ka spacing was replaced by another about every 100 ka, i.e. both overall climate periods matched one of the astronomical forcings. What is a puzzle is that the current periodicity seems to follow the very weakest influence in energy terms; that from orbital eccentricity. The energy shifts from changes in orbit shape are, in fact, far too weak to drive the accumulation and eventual melting of ice sheets on land. Climatologists have suggested a variety of processes that might be paced by eccentricity but which act to amplify is climatic ‘signal’. None have been especially convincing.

In an attempt to resolve the mystery Ayako Abe-Ouchi of the University of Tokyo and Japanese, US and Swiss colleagues linked a climate model driven by Milankovitch insolation and variations in CO2 recorded in an Antarctic ice core with a model of how land-ice forms and interacts with the underlying lithosphere (Abe-Ouchi, A. et  al. 2013. Insolation-driven 100,000-year glacial cycles and hysteresis of ice-sheet volume. Nature, v. 500, p. 190-193).

CLIMAP map of ice sheets, sea temperature chan...
Map of ice sheets, sea temperature changes, and changes in the outline of coastal regions during the last glacial maximum. (credit: Wikipedia)

Their key discovery is that the ice-sheets that repeatedly formed on the Canadian Shield and extended further south than Chicago had such a huge mass that they changed the shape of the land surface beneath them so much it had an effect on climate as a whole. The reason for this is that glacial loading forces the lithosphere down by displacing the more ductile asthenosphere sideways. But when melting begins rebound of the rock surface lags a long time behind the shrinking ice volume – well displayed today in Britain and Scandinavia by continued rise of the land to form raised beaches. In the case of the North American ice sheet, what had become an enormous ice bulge at glacial maxima developed into a huge basin up to 1 km deep as the ice began to melt. Simply by virtue of its low elevation this sub-continental basin would have warmed up more and more rapidly as the ice-surface fell because of this ‘isostatic’ lag.

Another feature to emerge from the model was the interaction between the 100 ka eccentricity ‘signal’ and that of precession at 23 ka. For long periods that kept summer temperature low enough for snow to pile up and become glacial ice, but on a roughly 100 ka time scale both acted together to increase summer temperatures at high northern latitudes. Melting that instantaneously removed some ice load each summer brought into play the sluggish isostatic  response that helped even more warming the following year. As well as convincingly accounting for the 100 ka mystery, the model explains the far more rapid deglaciations in that mode than in the preceding 41 ka cycles, which were almost symmetrical compared with the more recent slow accumulation of continental ice sheets over ~90 ka followed by almost complete melting in a mere 10 ka.

If true, the model seems to imply that before 800 ka the positions, thicknesses and extents of continental ice sheets were different from those in later times. Or perhaps it reflects a steady increase in the overall volume of ice being produced over northern North America, or that glacial erosion thinned the crust until changing isostatic influences could ‘trip’ sufficient additional warming.

Arctic climate in the run-up to the Great Ice Age

Around 3.6 Ma ago a large extraterrestrial projectile slammed into the far north-east of Siberia forming crater 16 km across. The depression soon filled with water to form Lake El’gygytgyn, on whose bed sediments have accumulated up to the present. A major impact close to the supposed start of Northern Hemisphere glacial conditions was a tempting target for coring: possibly two birds with one stone as the lowest sediments would probably be impact debris and boreal lake sediments of this age are as rare as hens’ teeth. The sedimentary record of Lake El’gygytgyn has proved to be a climate-change treasure trove (Brigham-Grette, J and 15 others 2013. Pliocene warmth, polar amplification, and stepped Pleistocene cooling recorded in NE Arctic Russia. Science, v. 340, p. 1421-1426).

El'gygytgyn, Russia, is a impact crater with a...
Lake El’gygytgyn impact crater. (credit: Wikipedia)

The team of US, Russian, German and Swedish scientists discovered that the sedimentary record was complete over a depth of 318 m and so promised a high resolution climate record. The striking feature of the sediments is that they show cyclical variation between five different facies, four of which are laminated and so preserve intricate records of varying weathering and sediment delivery to the lake. The sediments also contain pollens and diatom fossils, and yield good magnetic polarity data. The last show up periods of reversed geomagnetic polarity, which provide age calibration independent of relative correlation with marine isotope records.

A host of climate-related proxies, including pollen from diverse tree and shrub genera, variations in silica due to changes in diatom populations and organic carbon content in the cyclically  changing sedimentary facies are correlated with global climate records based on marine-sediment stable isotope. These records reveal intricate oscillations between cool mixed forest, cool coniferous forest, taiga  and cold deciduous forest, with occasional frigid tundra conditions through the mid- to late Pliocene. Compared with modern conditions NE Siberia was much warmer and wetter at the start of the record. Around the start of the Pleistocene sudden declines to cooler and drier conditions appear, although until 2.2 Ma ago average summer conditions seem to have been higher that at present, despite evidence from marine proxies of the onset of glacial-interglacial cycles in the Northern Hemisphere.

In detail, Lake El’gygytgyn revealed some surprises including rapid onset of a lengthy cold-dry spell of tundra conditions between 3.31 to 3.28 Ma. The first signs that the lake was perennially frozen appear around 2.6 Ma, well before evidence for the first continental glaciation in North America, presaged by signs around 2.7 Ma that winters consistently became colder than present ones. Overall the lake record presents a picture of a stepped shift in climate in the run-up to the Great Ice Age. Lake El’gygytgyn seems set to become the standard against which other, more patchy records around the Arctic Ocean are matched and correlated. Indeed it is the longest and most detailed record of climate for the Earth’s land surface, compared with 120 and 800 ka for the Greenland and Antarctic ice-caps.

Modelling their findings against likely atmospheric CO2 levels the authors provide grist to the media mill which focuses on how the late Pliocene may be a model for a future warm Earth if emissions are not curtailed, with visions of dense polar forests

Yes, it was hot during the Permian

For those of us living in what was the heart of Pangaea – Europe and North America – more than 250 Ma ago this item’s title might seem like the ultimate truism. However, despite our vision of desert dune sands and evaporating inland seas, glaciation blanketed much of the Gondwana part of the supercontinent until the Middle Permian then lying athwart the South Pole. That would go a long way to accounting for extreme dryness at low to mid-latitudes, especially in the deep interior of Pangaea, but just how hot might tropical climates have been? The deglaciation of Gondwana was abrupt and has been touted as an analogue for a possible anthropogenic closure to the Cenozoic glacial epoch that began around 34 Ma in Antarctica and has periodically gripped land at northern latitudes as low as 40°N for the last 2.5 Ma. Since the present distribution of continents is totally different from the unique pole-to-pole shape of Pangaea, that is probably a view that is not widely held by palaeoclimatologists. Nonetheless, getting hard data on Permian conditions has an intrinsic interest for most geoscientists.

The bottom of Death Valley, USA
Playa lake in Death Valley, USA (credit: Wikipedia)

One of the best ways of measuring past temperatures, whether surficial or deep within the crust, almost directly is based on fluids trapped within minerals formed at the time of interest. In Permian strata there is no shortage of suitable material in the form of evaporite minerals, especially common salt or halite.  A distinctive chevron-like texture develops in halite that forms at the water-atmosphere interface in playa lakes that dry out every year. When thin sections of samples that contain fluid inclusions are slowly heated the air bubbles trapped in salt during crystallisation gradually homogenise with the other trapped fluids. Based on samples that have formed at the present day under a range of air temperatures, the temperature of homogenisation indicates the prevailing air temperature accurately. So well, in fact, that it is possible to assess diurnal temperature variations in suitable halite crystals.

Results have been obtained from Middle Permian halites in Kansas, USA (Zambito, J.J. & Benison, K.C. 2013. Extremely high temperatures and paleoclimate trends recorded in Permian ephemeral lake halite. Geology, v. 41, p. 587-590). In part of the section studied air temperatures reached 73°C, compared with a modern maximum of 57°C recorded in halites from the playas of Death Valley. Moreover, they exhibit changes of more than 30°C during daily cycles. But that kind of weather is common in other hot dry areas today, such as the Dasht-e Lut in eastern Iran. Also, the full data show crystallisation at lower temperatures (maxima of 30-40°C) in part of the sequence. What is noteworthy is that these data are the first quantitative indicators of weather before the last 2.5 Ma. Since evaporites extend back into the Precambrian, the method will undoubtedly extend accuracy and precision to paleoclimate  where only proxies and a modicum of guesswork were previously available.

Tiny shrinking horses

English: This reproduction of a painting of an...
Reconstruction of Sifrhippus. Image via Wikipedia

The earliest known ancestors of modern horses occur in Palaeogene mammal-rich terrestrial sediments of the northwestern US, particularly those of the Wind and Bighorn Basins. The first with clear horse-like features was Sifrhippus (formely Eohippus, or Hyracotherium), but famously it had four hoofed toes and was about the size of a household cat. Subsequent development to a single load-bearing toe has long formed one of the classic cases for evolution. Sifrhippus lived at the end of the Palaeocene. From the large numbers of well-preserved skeletons, this was a herding animal. The large numbers of fossils have also made it a candidate for testing a hypothesis that individuals of a mammal and bird species become smaller as climate warms: Bergmann’s Rule. The background to this view is that in modern warm-blooded or endothermic animal species individuals tend to be smaller the closer they are to the Equator.

The end of the Palaeocene was marked by a now well-documented rise in global surface temperature that left a marked sign of increased 13C in sediments spanning the Palaeocene-Eocene boundary, which is widely believed to have resulted from massive exhalations of methane from the seafloor. Bergmann’s Rule arose because there appears to be a general decrease in size of most mammal fossils through the P-E Thermal Maximum.  Sifrhippus lived through the event and indeed did undergo 30% decrease in size at the start of the carbon-isotope shift marking the PETM. Moreover, after the isotopic excursion its fossils indicate a 70% increase in size (Secord, R. and 8 others 2012. Evolution of the earliest horses driven by climate change in the Paleocene-Eocene Thermal Maximum. Science, v. 335, p. 959-962).

The study was of Sifrhippus and other mammals over a period representing several thousand generations. It broke new ground in two ways: it used the size of the horses’ teeth to estimate body mass, and teeth of a variety of mammals afforded systematic measurements of both carbon and oxygen isotopes. The carbon isotopic analyses pin-pointed the span of the PETM locally, while oxygen isotopes charted local changes in average temperature. The results show remarkable coherence with Bergmann’s Rule, but reveal other interesting aspects of the PETM in North America. Oxygen-isotope in the teeth of different mammal species give some idea of their diet and habitat. Sifrhippus shows the highest enrichment of 18O in its teeth, which suggests that it ate leaves from which water evaporation selectively removed the lighter 16O, i.e. in open, dry areas. Another ubiquitous fossil, Coryphodon, consistently has lower 18O than other mammals, signifying that it was water-loviong and ate aquatic plants, i.e. not subject to evaporation. Matching O-isotopes for the two species across the PETM shows a greater shift in 18O for Sifrhippus than for Coryphodon, which suggests that hidden in the O-isotope record of temperature is information about rainfall variations during the PETM. To further support Bergmann’s Rule, changes in the size of Sifrhippus, do not correlate with the aridity index. So it seem that heat alone was responsible for dwarfing – the other possibility considered by the researchers was that decreased availability or quality of diet could have been responsible.

Coryphodon
Reconstruction of Coryphodon. Image via Wikipedia

Dust: heating or cooling?

In the left image, thin martian clouds are vis...
Mars: with and without dust storms in 2001. Image via Wikipedia

Once every 13 years on average dust blots out most of the surface of Mars turning it into an orange ball. The last such planet-encircling dust storm occurred in 2001, but lesser storms spring up on a seasonal basis. Yet Martian seasons have very different weather from terrestrial ones because of the greater eccentricity of Mars’s orbit, as well as the fact that its ‘weather’ doesn’t involve water. When Mars is closest to the Sun solar heating is 20% greater than the average, for both hemispheres. The approach to that perihelion marks the start of the dust season which last a half the Martian year. Unsurprisingly, the sedimentary process that dominates Mars nowadays is the whipping up and deposition of sand and dust, though in the distant past catastrophic floods – probably when subsurface ice melted – sculpted a volcanic landscape pockmarked with impact craters up to several thousand kilometres across. Waterlain sediments on early Mars filled, at least in part, many of the earlier craters and probably blanketed the bulk of its northern hemisphere that is the lowest part of the planet and now devoid of large craters. Erosion and sedimentation since that eventful first billion years has largely been aeolian. Some areas having spectacular dunes of many shapes and sizes, whereas more rugged surfaces show streamlined linear ridges, or yardangs (http://earth-pages.co.uk/2011/05/08/winds-of-change/), formed by sand blasting. Most of the dust on Mars is raised by high winds in the thin atmosphere sweeping the great plains and basins, and, by virtue of Stokes’s law, the grains are very much smaller than on Earth.

The dustiest times on Earth, which might have blotted out sizeable areas from alien astronomers, in the last million years have been glacial maxima, roughly every 100 ka with the latest 20 ka ago. Layering in the Antarctic ice core records such dust-dominated frigid periods very precisely. Less intricate records formed away from the maximum extent of ice sheets as layers of fine sediment known as loess, whose thickness variations match other proxy records of palaeoclimate nicely. Loess, either in place or redeposited in alluvium by rivers, forms the most fertile soil known – when the climate is warm and moist. The vast cereal production of lowland China and the prairies of North America coincides with loess: it may seem strange but a large proportion of 7 billion living humans survive partly because of dust storms during glacial periods of the past.

Being derived from rock-forming minerals dust carries with it a diverse range of chemical elements, including a critical nutrient common on land but in short supply in ocean water far offshore: iron in the form of oxide and hydroxide coatings on dust particles – the dust coating your car after rain often has a yellow or pinkish hue because of its iron content. Even when the well-known ‘fertilizer’ elements potassium, nitrogen and phosphorus are abundant in surface ocean water, they can not encourage algal phytoplankton to multiply without iron. Today the most remote parts of the oceans have little living in their surface layers because of this iron deficiency. Yet oceanographers and climatologists are pretty sure that this wasn’t always the case. They are confident simply because reducing the amount of atmospheric carbon dioxide and its greenhouse effect to levels that would encourage climate cooling and glacial epochs needed more carbon to be buried on the ocean floors than happens nowadays, and lifeless ocean centres would not help in that.

Dust plume off the Sahara desert over the nort...
Saharan dust carried over the Atlantic Ocean by a tropical cyclone. Image via Wikipedia

At present, the greatest source of atmospheric dust is the Sahara Desert (bartholoet, J. 2012. Swept from Africa to the Sahara. Scientific American, v. 306 (February 2012), p. 34-39). Largely derived from palaeolakes dating from a Holocene pluvial episode, Saharan dust accounts for more than half the two billion metric tonnes of particulate atmospheric aerosols dispersed over the Earth each year. Located in the SE trade-wind belt, the Sahara vents dust clouds across the Atlantic Ocean, most to fall there and contribute dissolved material to the mid-ocean near-surface biome but an estimated 40 million t reaches the Amazon basin, contributing to fertilising the otherwise highly leached tropical rain-forest soils. While over the ocean the high albedo of dust adds a cooling effect to the otherwise absorbent sea surface. Over land the fine particles help nucleate water droplets in clouds and hence encourages rainfall. The climatic functions of clouds and dusts are probably the least known factors in the climatic system, a mere 5% uncertainty in their climatic forcing may mean the difference between unremitting global warming ahead or sufficient cooling by reflection of solar radiation to compensate for the cumulative effects of industrial CO2 emissions.

Recording amounts of dust from marine sediments quantitatively is very difficult and impossible in terrestrial sediments, but superb records tied accurately to time at annual precision exist in ice sheets. Low dust levels in Greenland and Antarctic ice tally well with the so-called ‘Medieval Climate Anomaly’ (a warm period) whereas through the 13th to 19th centuries (the ‘Little Ice Age’) more dust than average circulated in the atmosphere. Crucially, for climate change in the industrial era, there has been a massive spike in dust reaching near-polar latitudes since the close of the 18th century during the period associated with signs of global warming: a counterintuitive relationship, but one that is difficult to interpret. The additional dust may well be a result of massive changes in land use across the planet following industrialised agricultural practices and growing population. There are several  questions: does the additional dust also reflect global warming with which it is correlated, i.e. evaporation of the huge former lakes in the Sahara (e.g. Lake Chad); is the dust preventing additional greenhouse warming that would have taken place had the atmosphere been clearer; is it even the ‘wrong kind of dust’, which may well reflect short-wave solar radiation away but also absorbs the longer wavelength thermal radiation emitted by the Earth’s surface, i.e. an aerosol form of greenhouse warming. Needless to say, neither clouds nor dust can be factored into climate prediction models with much confidence.

Dust tied to climate

This TOMS image shows a record-setting Asian d...
Dust moving in April 2001 from arid areas in Central Asia and North Africa to the oceans. From NASA's Nimbus-7 satellite. Image via Wikipedia

At present the central areas of the oceans are wet deserts; too depleted in nutrients to support the photosynthesising base of a significant foot chain. Oddly, even when commonly known nutrients are brought to the ocean surface far from land by deep-sourced upwellings the effect on near-surface biomass is far from that expected. The key factor that is missing is dissolved divalent iron that acts as a minor nutrient for phytoplankton: even in deep ocean waters any such ferrous iron is quickly oxidised and precipitated as trivalent ferric compounds. One of the suggested means of geoengineering away any future climatic warming is to seed the far-off oceans reaches with soluble iron in the hope of triggering massive planktonic blooms, dead organisms sinking to be buried along with the their carbon content in the ocean-floor oozes. Retrospectively, it has been suggested that the slight mismatch between changes in atmospheric CO2 concentration and climate changes may be linked to fluctuating availability of iron dissolved from dust in ocean-surface waters, but so far that hypothesis has not been robustly tested. It is well known, however, that global cooling is accompanied by drying of continental climates and thereby an increase in the delivery of dust, even to polar ice caps where cores have shown dustiness to fluctuate with temperature.

Recently an ocean-floor sediment core from around 42° S has revealed a high-resolution record of the deposition of dust and iron at that location over the last 4 Ma (Martinez-Garcia, A. et al. 2011. Southern Ocean dust-climate coupling over the past 4 million years. Nature, v. 476, p. 312-315). In it one proxy for dust is the amount of organic compounds known as n-alkanes that are a major component of the waxes shed from plant leaves. Others are iron, titanium and thorium concentrations in the ooze. Dust proxies tally with land-ice volumes shown by the fluctuating d18O measured in bottom-dwelling foraminifera found as fossils in the core to form a convincing link between dust and climate over the Southern Ocean. Those proxies also match nicely the record of dust delivered to Antarctica that emerged from the 0.8 Ma Dome C ice core that was extracted and analysed by the EPICA consortium. The record shows boosts in iron and dust deposition at 2.7 Ma, when ice first took hold of northern high latitudes, and at 1.25 Ma when larger ice sheets began to develop and climate shifts switched to 100 ka cyclicity. Although the match between marine and glacial dust accumulation in the latter part of this mid-Pleistocene Transition is an important step forward in palaeoclimatology, it is a surprise that the new ocean-floor data is not plotted with the record of atmospheric CO2 in Antarctic ice bubbles: if there was a clear relationship that would have iced the cake.

Snowball Earth melting hypothesis weakened

"SNOWBALL EARTH" - 640 million years ago
Artist's impression of the Neoproterozoic Earth during a Snowball episode. Image by guano via Flickr

The combination of glaciogenic sediments with palaeomagnetic evidence for their formation at low-latitudes, together with dates that show glacial events were coeval in just two or three Neoproterozoic episodes are the linchpins for the Snowball Earth hypothesis.  There is little doubt that the latest Precambrian Era did witness such extraordinary climatic events. Evidence is also accumulating that, in some way, they were instrumental in that stage of biological evolution from which metazoan eukaryotes emerged: the spectacular Ediacaran fossil assemblages follow on the heels of the last such event (see Bigging-up the Ediacaran in Earth Pages for March 2011). One of the difficulties with the ‘hard’ Snowball Earth hypothesis is how the middle-aged planet was able to emerge from a condition of pole-to-pole ice cover; hugely increased reflectivity of that surface should have driven mean global temperature down and down. Clearly the Earth did warm up on each occasion, and the leading model for how that was possible is massive release of greenhouse gases from sea-floor sediments or deep-ocean waters to increase the heat-retaining powers of the atmosphere; sufficiently voluminous release from volcanic action seems less likely as there is little evidence of upsurges in magmatism coinciding with the events. Almost all glaciogenic units from the Neoproterozoic have an overlying cap of carbonate rocks, indicating that hydrogen carbonate (formerly bicarbonate) ions together with those of calcium and magnesium suddenly exceeded their solubilities in the oceans.

White flocculent mats in and around the extrem...
Modern sea-floor hydrothermal vent. Image via Wikipedia

To seek out a possible source for sufficient carbon release in gaseous form geochemists have turned to C-isotopes in the cap carbonates. Early studies revealed large deficits in the heavier stable isotope of carbon (13C) that seemed to suggest that the releases were from large reservoirs of carbon formed by burial of dead organisms: photosynthesis and other kinds of autotrophy at the base of the trophic pyramid selectively take up lighter 12C in forming organic tissues compared with inorganic chemical processes). As in the case of the sharp warming event at the Palaeocene-Eocene boundary around 55.8 Ma ago (See The gas-hydrate ‘gun’ in June 2003 Earth Pages), these negative d13C spikes have been interpreted as due to destabilisation of gas hydrates in sea-floor sediments to release organically formed methane gas. This powerful greenhouse gas would have quickly oxidised to CO2 thus acidifying the oceans by jacking up hydrogen carbonate ion concentrations.  Detailed carbon-, oxygen- and strontium-isotope work in conjunction with petrographic textures in a Chinese cap carbonate (Bristow, T.F. et al. 2011. A hydrothermal origin for isotopically anomalous cap dolostone cements from south China. Nature, v. 274, p. 68-71) suggests an alternative mechanism to produce the isotopically light carbon signature at the end of Snowball events. The greatest 13C depletion occurs in carbonate veins that cut through the cap rock and formed at temperatures up to 378°C and even the early-formed fine grained carbonate sediment records anomalously high temperatures. So, it seems as if the cap-rock was thoroughly permeated by hydrothermal fluids, more than 1.6 Ma after it formed on the sea floor. This triggered oxidation of methane within the sediments themselves, with little if any need for an atmospheric origin through massive methane release from destabilised gas hydrates elsewhere.

The post-glacial North Atlantic

Microfossils from marine sediments - planktoni...
Neogloboquadrina pachyderma. Image via Wikipedia

One of the main controls over Earth’s climate is the way that water in the North Atlantic convects. At present it is behaving like a liquid conveyor belt that links the tropics and well to the north of the Arctic Circle. Warm salty water that reaches boreal latitudes cools and also becomes saltier as sea ice freezes out fresh water. It therefore gets denser and sinks to the ocean floor in the Denmark Strait between Iceland and Greenland, and between Iceland and the Faeroe Isles. This downwelling drags surface water polewards from the tropics to replenish the system, thereby creating the Gulf Stream and North Atlantic Drift that warms coastal north-western Europe as far as the northern tip of Scandinavia. It was not always this way; evidence has accumulated to indicate that the North Atlantic ‘conveyor’ shut down periodically during the run-up to the last glacial period and in the climatic hiccup of the Younger Dryas (12.6-11.5 ka). The best supported hypothesis as to why it may do that is through massive influx of freshwater to lower the density of surface water in the northernmost North Atlantic. The progressive summer retreat of sea-ice in the Arctic Ocean and the likelihood of ice-free summers there in the near future raises fears that such a shut-down may occur once again, because of freshening of surface water by ice meltwater, with devastating climatic results for Europe at least. The circulation also transports carbon dioxide dissolved in cold descending surface water to abyssal depths helping buffer its atmospheric concentration: a shut-down would allow greenhouse gas emitted by society to build up in the air.

One means of investigating the mechanisms that underlie ‘on’ and ‘off’ switching in ocean convection is to use sea-floor sediment data from the18 ka long period since the last glacial maximum (Thornalley. D.J.R. et al. 2011. The deglacial evolution of North Atlantic convection. Science, v. 331, p. 202-205). The British-US consortium used oxygen isotope data from the planktonic (near-surface) foraminifera Neogloboquadrina pachyderma preserved in sea-floor sediment cores from south of Iceland, close to where surface water descends today, to assess sea-surface temperature variations. Because of the continual exchange of CO2 between surface water and the atmosphere, the ocean surface contains the same radioactive 14C content in carbon as does the atmosphere, at whose top the isotope is produced. When water descends this connection is cut and the proportion of 14C in it decays so that it is theoretically possible to work out the time at which deep water began to descend – its ‘ventilation age’. In practice this is done by measuring the ‘age’ of  carbon preserved in planktonic and benthonic (deep- and bottom-water) foram shells, the planktonic age being the actual age used to assess the age difference between deep and surface waters. In the case of a complete shut-down of the convection the ventilation age should be high and constant; exactly the case during the last glacial maximum (19-22 ka) and most of Heinrich Stadial 1 (16.5-19 ka). When the ‘conveyor’ is functioning the ventilation age should be low, in fact from about 16-11.5 ka the ventilation age fluctuates to show 3 major and 2 lesser low to high episodes during the Bølling-Allerød and Younger Dryas, suggesting that indeed there was repeated turning-on and turning-off of the conveyor, probably triggered by pulses of fresh water into the northern North Atlantic from glacial melting. The resolution of these data is of the order of 350 years, so there may be finer detail of great interest as regards future climate.

See also: Sarnthein, M. Northern meltwater pulses, CO2, and changes in Atlantic convection. Science, v. 331, p. 156-158.

A chilly Late Cambrian

Application of the Uniformitarian Principle by geologists from Minnesota, USA (Runkel, A.C. et al. 2010. Tropical shoreline ice in the late Cambrian: implications for Earth’s climate between the Cambrian Explosion and the Great Ordovician Biodiversification Event. GSA Today v.20 (November 2010), p. 4-10) may have shown that around the end of the Cambrian period (500 to 488 Ma) global climate was sufficiently cold for sea ice to have formed in the tropics of the time. The evidence comes from curious metre-scale clasts of cemented sands in Late Cambrian beach deposits of the northern USA, some of which show imbrication as if the bodies were shoved together. Others seem to have been extended into boudin-like plates without any sign of tectonic activity, so that isolated clasts occur in offshore deposits. Yet more have been bent to drape over irregularities in the surface beneath them. Somehow individual sand beds must have become cemented quickly so that water action could fracture them in a brittle fashion and then they became softer to experience ductile deformation and even boring by worm-like animals. Almost exact replicas of such structures form on the shores of the American Great Lakes in winter when water in shoreline sands freezes to cement the grains. Breaking waves and melting explain the peculiar structures in these intraclasts. Examples of ice-cemented sediments abound in glaciogenic deposits, but the Late Cambrian world is widely considered to have experienced greenhouse conditions.

Land distribution during late Cambrian.
Image via Wikipedia

Apparently not as the North American crust was definitely close to the Equator at that time. The intraclasts occur only in one stratigraphic Formation of the Minnesotan Cambrian, because it preserves littoral facies. There are no other reports from elsewhere, but that may well be because few geologists were able to combine the experience of modern frigid shore conditions with that of Cambrian stratigraphy as those from Minnesota surely do.

The Middle to Late Cambrian was a period of faunal hiccups, diversification after the Cambrian Explosion failing to get underway because of repeated minor extinctions spread across the known occurrences of rocks of that age (see Linking oxygen levels to great animal radiations, this issue) . The Minnesotan evidence could indicate that the global climate was extremely unstable at that time in the manner of Neoproterozoic ‘Snowball Earth’ conditions, but not so severe. The widespread occurrence of microbial carbonate facies of this age range has long been used as evidence of a warm Earth, but such carbonated form today over a wide range of latitudes: witness the huge coccolithophore blooms so common at high latitudes nowadays. Shoreline sandy sediments of Cambrian age are not uncommon, occurring throughout the English Midlands and in NW Scotland, for instance. So it might be interesting to re-examine easily-reached occurrences such as these to see if similar structures turn-up.

Record of rising Holocene sea-level in the tropics

Areas beyond the zones of isostatic depression by ice-loading and recovery during glacial-interglacial cycles passively undergo sea-level fall and inundation. They best record the progress of Holocene ice-sheet melting and sea-level rise since 11.5 ka, especially if they are tectonically stable. The island state of Singapore, 1.5 º north of the Equator, is a near-ideal place for study (Bird, M.I. et al. 2010. Punctuated eustatic sea-level rise in the early mid-Holocene. Geology, v. 38, p. 803-806). The Australian and British geoscientists analysed a core through sediments in a mangrove swamp now just below sea level. The top 14 m penetrated a uniform though laminated sequence of marine muds, calibrated to time by radiocarbon dating of mollusc shells, mainly focused on the period from 9 to 6 ka period that the global oxygen-isotope record of ice volume suggests to have been the main period of final melting after the Younger Dryas.

Sedimentation was very rapid (~1 cm y-1) from  8.5 to 7.8 ka, probably as sea level rose too rapidly for the coast to be protected by mangrove growth.  Then for 400 years it slackened off to ~0.1 cm y-1 to rise again to 0.5 cm y-1 by 6.5 ka. The last date is the time of the mid-Holocene sea level highstand, after which sedimentation rate soon declined to 0.05 cm y-1, when mangroves became established at the site. Stable isotopes of carbon in the core (δ13C) show how the relative input of marine and terrestrial (mainly mangroves) organisms shifted over the period and are a proxy for the distance to the coastline and hence sea level. From 8.5 to 6.5 ka this was erratic from a starting point about 10 m lower than nowadays, showing rapid rises and falls that culminated in a sea level in Singapore about 3 m above present during the mid-Holocene sea level highstand that slowly declined to that of the present.

The team’s findings tally with evidence for the melting record of the North American ice sheet. An interesting aspect is that they also cover the period when rice cultivation in swampy areas of SE Asia got underway (~7.7 ka). Very rapid sedimentation would have encouraged development of the substrate for the highly fertile delta plains that now support the largest regional population densities on Earth. In turn they culminated in a series of early south and east Asian civilisations based on class societies.

Antipodean glaciers confirm complementary southern Younger Dryas warming

Studies of air-temperature proxies in cores from the Antarctic ice cap show a roughly mirrored climate record to that found in the Greenland ice. While the Northern Hemisphere underwent a sudden climate collapse into almost full-glacial conditions around 12.9 ka and an equally dramatic warming around 11.7 ka, Antarctica steadily warmed over the same period to reach full interglacial conditions by 11.5. That this climatic inversion reached relatively low southern latitudes is confirmed by a record of the changing size of glaciers on mountains in New Zealand’s South Island (Kaplan, M.R. and 9 others 2010. Glacier retreat in New Zealand during the Younger Dryas stadial. Nature, v. 467, p. 194-197). The US-New Zealand-Norwegian-French partnership used detailed geomorphological mapping, and cosmogenic isotope studies of exposed rock fragments to show that after about 13 ka glaciers retreated by more than a kilometre in the succeeding 1500 years in contrast to the dramatic glacial advances in northern areas such as the Scottish Highlands.

Antipodean glaciers confirm complementary southern warming during the Younger Dryas

Studies of air-temperature proxies in cores from the Antarctic ice cap show a roughly mirrored climate record to that found in the Greenland ice. While the Northern Hemisphere underwent a sudden climate collapse into almost full-glacial conditions around 12.9 ka and an equally dramatic warming around 11.7 ka, Antarctica steadily warmed over the same period to reach full interglacial conditions by 11.5. That this climatic inversion reached relatively low southern latitudes is confirmed by a record of the changing size of glaciers on mountains in New Zealand’s South Island (Kaplan, M.R. and 9 others 2010. Glacier retreat in New Zealand during the Younger Dryas stadial. Nature, v. 467, p. 194-197). The US-New Zealand-Norwegian-French partnerships used detailed geomorphological mapping, and cosmogenic isotope studies of exposed rock fragments to show that after about 13 ka glaciers retreated by more than a kilometre in the succeeding 1500 years in contrast to the dramatic glacial advances in northern areas such as the Scottish Highlands.

Record of rising sea-level in the tropics

Areas beyond the zones of isostatic depression by ice-loading and recovery during glacial-interglacial cycles passively undergo sea-level fall and inundation. They best record the progress of Holocene ice-sheet melting and sea-level rise since 11.5 ka, especially if they are tectonically stable. The island state of Singapore, 1.5 º north of the Equator, is a near-ideal place for study (Bird, M.I. et al. 2010. Punctuated eustatic sea-level rise in the early mid-Holocene. Geology, v. 38, p. 803-806). The Australian and British geoscientists analysed a core through sediments in a mangrove swamp now just below sea level. The top 14 m penetrated a uniform though laminated sequence of marine muds, calibrated to time by radiocarbon dating of mollusc shells, mainly focused on the period from 9 to 6ka period that the global oxygen-isotope record of ice volume suggests to have been the main period of final melting after the Younger Dryas.

Sedimentation was very rapid (~1 cm y-1) from  8.5 to 7.8 ka, probably as sea level rose too rapidly for the coast to be protected by mangrove growth.  Then for 400 years it slackened off to ~0.1 cm y-1 to rise again to 0.5 cm y-1 by 6.5 ka. The last date is the time of the mid-Holocene sea level highstand, after which sedimentation rate soon declined to 0.05 cm y-1, when mangroves became established at the site. Stable isotopes of carbon in the core (δ13C) show how the relative input of marine and terrestrial (mainly mangroves) organisms shifted over the period and are a proxy for the distance to the coastline and hence sea level. From 8.5 to 6.5 ka this was erratic from a starting point about 10 m lower than nowadays, showing rapid rises and falls that culminated in a sea level in Singapore about 3 m above present during the mid-Holocene sea level highstand that slowly declined to that of the present.

The team’s findings tally with evidence for the melting record of the North American ice sheet. An interesting aspect is that they also cover the period when rice cultivation in swampy areas of SE Asia got underway (~7.7 ka). Very rapid sedimentation would have encouraged development of the substrate for the highly fertile delta plains that now support the largest regional population densities on Earth. In turn they culminated in a series of early south and east Asian civilisations based on class societies.

Why a glacial period ends

The publicity and debate that sprang up in the 9 months after release of e-mails stolen (17 November 2009) from the British University of East Anglia’s Climatic Research Unit, and several debacles regarding pronouncements by the Intergovernmental Panel on Climate Change have in fact cleared the air on several purely scientific matters. , Contrary to what had become the broad public conception, thanks to massive and continuous propaganda about global warming that barely mentions anything else, greenhouse gas emissions are widely revealed to be not the ‘only game in town’ when it comes to past changes in climate. That is very much the lesson learned by decades of study of the greatest climate change that fully modern humans have experienced: the last glacial termination when the deepest frigidity about 20 ka ago gave way to very rapid warming. A review of that enormous world event carries important lessons about what really controls climate on our world and how complex that is (Denton, G.H. et al. 2010. The last glacial termination. Science, v. 328, p. 1652-1656).

Since the 1970s proxy data from deep-sea sediments that reveal the variation in the volume of glacial ice on land have showed how climate changes over the last 2.5 Ma are broadly correlated with the periods of astronomical effects on the amount of solar energy received by Earth or insolation, particularly that at high northern latitudes. This might suggest that glacial terminations occur when insolation reaches maxima. In fact over the last 800 ka terminations have also occurred at times of low insolation. The Milankovich signal is ubiquitous but it is not the primary driving factor for the end of glacial episodes. Nor do they tally exactly with increased CO2 in the atmosphere, as recorded in air bubble trapped in polar ice. In fact there is a lag between the record for greenhouse gases and those for warming and cooling. The clearest correlation is between terminations and the maximum volume of land ice in each glacial epoch, towards which Denton et al. direct most attention. Since Antarctic ice has barely changed volume since the Pliocene, pulsation in land-ice volume must stem mostly from Northern Hemisphere glaciation and deglaciation. That repeatedly occurred around the North Atlantic where the main sites for ocean-water downwelling occur. At their thickest the North American and European ice sheets also had their greatest isostatic effects, bowing down the crust, and increasing ice flow towards the ocean. Time after time in each glacial build-up such a configuration became unstable so that marginal ice collapsed to produce the iceberg ‘armadas’ known as Heinrich events. Freshening of the North Atlantic by iceberg melting shut down the downwelling, thereby thermally isolating high northern latitudes to give Dansgaard-Oeschger events comprising paired coolings, or stadials, followed by suddenly warming interstadials once deep circulation restarted.

What is also emerging is that, to maintain heat balance, as each stadial developed in the North Atlantic more heat was shifted to the Southern Hemisphere. Increased downwelling of cold saline water of the Southern Ocean drove this warming to higher southern latitudes. The net observed effect is a southern reversal of sea-surface and polar air temperatures compared with those of the Northern Hemisphere, especially clear in the late stages of the last termination, including the Younger Dryas. Each warming of the south encouraged the southern oceans to emit stored CO2 to the atmosphere, until finally sufficient to maintain global warm conditions when the arose during terminations.

Flatulence and the Younger Dryas
There is a widespread belief that the enlargement of domesticated ruminant herds, mainly cattle, goats and sheep, may have had some effect on recent climate: their enteric fermentation of grass cellulose generates methane, a powerful greenhouse gas. Livestock produce an estimated 80 million metric tons of methane annually, accounting for about 28% of anthropogenic methane emissions. Livestock aren’t the only methane emitting ruminants: giraffe; bison; yaks; water buffalo; deer; camels (including llamas and alpacas); and antelope. Elephants are not so efficient, but they do break wind a great deal. An adult elephant emits about half a ton of methane annually; enough to run a car 20 miles per day; on the school run for instance.

Livestock have become the dominant herbivores on the planet, but far more wild ruminants roamed the Earth during the last glacial epoch because of the much greater expanses of grasslands during cooler, more arid conditions. This was especially the case in North America, a much diminished impression being given by the vast herds of bison that were almost exterminated in the 19th century and those of caribou that still migrate across Alaska and northern Canada. The estimated ruminant population of late-Pleistocene prairies was so large that it too has been implicated in climate change during the last glacial termination (Smith, F.A. et al. 2010. Methane emissions from extinct megafauna. Nature Geoscience, v. 3, p. 374-375), with estimated annual emissions around 10 million tons. With atmospheric methane concentrations having reached around 650 parts per billion by volume (ppbv) by 15 ka – a third of those today – the farting animals of the prairies may have made a significant contribution to post-glacial global warming. Sometime around 13 ka immigrant humans from Asia entered the scene, armed with efficient hunting weapons. By 11.5 ka, the vast herds had more or less vanished through extinction, and the 10 megaton methane emission went with them. Felisa Smith and her colleagues from the University of New Mexico, Los Alamos National National Laboratory and the Smithsonian Institution, USA, note that over the same period atmospheric methane content fell from 650 to <500 ppbv. They speculate that part of this decline may have resulted from the extinction of the North American ‘megafauna’ and contributed to the Younger Dryas cooling between 12.8 to 11.5 ka. If that were the case, it would have been the earliest instance of a human effect on the Earth and, opine the authors, ought to be used to mark the start of what some geoscientists propose as a new geological Period: the ‘Anthropocene’. This parochial view surely ranks alongside that of a shower of nano-diamonds from an extraterrestrial explosion as the cause of the Younger Dryas, to the posthumous annoyance of William Seach of Occam.

Doubt cast on erosion and weathering theory of climate change
A seminal paper in the late 1980’s by Maureen Raymo, Flip Froelich and Bill Ruddiman proposed that the uplift of mountain ranges, their erosion and associated chemical weathering helped gradually shift global climate. Their main reasoning was that rotting of feldspars by carbonic acid formed when CO2 dissolves in rainwater locked the greenhouse gas in soil carbonates and supplied bicarbonate ions to sea water, where they would recombine with calcium and magnesium ions also released by weathering to form limestones. This process would draw down greenhouse gas levels in the atmosphere faster during episodes of major mountain building. Such carbonate burial has since been assumed to have helped the Earth’s climate cool during the Cenozoic era, after the Alps, Andes and especially the Himalaya began to form. There have been many publications about the processes involved and the geochemical signature of varying erosion, such as changes in the strontium isotope composition of limestones as a proxy for that of sea water. But the real test for whether or not there have been pulses in erosion controlled by orogeny would involve measuring changes over time in sediment deposition in all the world’s sedimentary basins. In a recent paper (Willenbring, J.K. & von Blanckenburg, F. 2010. Long-term stability of global erosion rates and weathering during late-Cenozoic cooling. Nature, v. 465, p. 211-214) published estimates of continent derived sedimentation plotted against atmospheric CO2 derived from various proxies show two features. First, there hasn’t been a truly significant decrease in CO2 since the end of the Oligocene (23 Ma). Secondly, although sedimentation over every 5 Ma rose from about 6 x 10¹⁵ to 1016 t between the end of the Oligocene and the start of the Pliocene. Repeated glaciation over the last 5 Ma helped increase global sedimentation to 3 x 10¹⁶ t, but even that tripling seems not to have had much effect on atmospheric CO2.

Willenbring and von Blanckenburg have attempted to improve the very uncertain evolution of the sedimentary record based on basin stratigraphy – despite seismic sections in many basins, costly and still rare 3-D cross sections are the only means of working out actual masses of sediment deposited through time. The authors re-examined the record of beryllium isotopes in sediments and manganese crusts from the deep-ocean floor, as a proxy for rates of weathering of continental debris. The principle behind this is the continuous production of radioactive 10Be in the atmosphere by cosmic rays, and its entry into the oceans. There it mixes with stable 9Be released to solution by weathering of rocks. Allowing for the decay of 10Be and assuming constant rates at which it is produced, the 10Be/9Be ratio in ocean water and sediments in contact with it is a proxy for global weathering. A decrease in the ratio implies an increase in continental weathering, while decreases signify periods of slowing rock breakdown. Over the last 10 Ma, the ratio has stayed more or less constant in the Pacific and Atlantic Oceans. The obvious conclusion is that the last 10 Ma showed no pulse in weathering and that period did not follow the Raymo-Froelich-Ruddiman model. There are several explanations for the ‘flat-lining’ Be isotopes (Goddéris, Y. 2010. Mountains without erosion. Nature, v. 465, p. 169-171), but a rethink of the significance of any link between orogeny and climate is clearly on the cards.

On the same topic, the start of Northern Hemisphere glaciations and its 30-40 Ma lead-in, Bill Ruddiman of the University of Virginia reviews a broader range of evidence (Ruddiman, W.F. 2010. A paleoclimatic enigma. Science, v. 328, p. 838-839) but not that presented by Willenbring and von Blanckenburg. He concludes that little has changed by way of explanation since the late 1990s, and decreased CO2¬ was the primary forcing factor. Yet his own plot of atmospheric CO2 estimated from marine-sediment alkenones (organic compounds produced by some phytoplankton) shows little fluctuation in the mean concentration since 20 Ma, which is around that for the Pliocene-Pleistocene Great Ice Age.

‘Hard’ Snowball Earth softens

The original hypothesis of Neoproterozoic global glacial conditions, proposed by Joe Kirschvink (California Institute of Technology) and Paul Hoffman (emeritus at Harvard) in the 1990s was that conditions became so severe that the Earth was encased in glacial- and sea ice from pole to pole. As EPN has charted since 2000, that ‘hard’ Snowball variant has become increasingly less favoured by most geoscientists (Kerr, R.A. 2010. Snowball Earth has melted back to a profound wintry mix. Science, v. 327, p. 1186). However, evidence supporting low latitude glaciations continues to emerge (, F.A. and 9 others 2010. Calibrating the Cryogenian. . Science, v. 327, p. 1241-1243). In the latest, diamictites of the so-called ‘Sturtian’ glaciation in north-western Canada are interbedded with volcanic rocks that give a very precise age of 716.5 Ma. That age happens to coincide with outpouring of the regionally massive Franklin flood basalts whose palaeomagnetism gives equatorial latitudes, the first recorded for the Sturtian glaciation: the later Marinoan glaciation (~635 Ma) provides most low-latitude evidence for Snowball conditions. The paper by Francis Macdonald and co-workers also gives detailed carbon isotope data for a continuous sedimentary record from >811 to 583 Ma.

A potential spanner in the works for the entire Snowball Earth hypothesis is the discovery of a strange anomaly concerning palaeomagnetic pole positions during latest Neoproterozoic times  (Abrajevitch, A. & van der Voo, R. 2010. Incompatible Ediacaran paleomagnetic directions suggest an equatorial geomagnetic dipole hypothesis. Earth and Planetary Science Letters, v. 293, p. 164-170). Paleomagnetism from glaciogenic rocks is the lynchpin for the notion of Snowball Earth, some occurrences recording tropical latitudes. Alexandra Abrajevitch (Kochi University, Japan) and Rob van der Voo (University of Michigan) report palaeomagnetic results for igneous rocks between 600 and 550 Ma in what are now North America and Scandinavia. The data show original inclinations of the magnetic field that are both steep and shallow, indicating high and low latitudes respectively. Plotting inclination against radiometric age for what were separate continental masses in the Ediacaran Period reveals repeated rapid changes from high to low palaeolatitudes that simply cannot be accounted for by continental drift: plate tectonic rates would have to have been unaccountably fast (~45 cm yr-1). To account for the abrupt shifts the authors turn not to true polar wander – due to changes in the geometry of the geomagnetic dipole – but to rapid flips in the orientation of the dipole between a coaxial and an equatorial alignment, perhaps due to dramatic changes of circulation within the liquid outer core. Familiar geomagnetic reversals normally shift the magnetic poles between roughly the geographic pole positions. Yet there are data showing that for brief periods the reversing poles do pass through equatorial latitudes but at very low magnetic field strength. In the cases from the Ediacaran the geomagnetic poles dwelt at tropical latitudes for long periods and maintained a strong field. Were such strange behaviour demonstrated earlier in the Neoproterozoic, during the Cryogenian period of supposed Snowball events, that would undermine the whole basis for the hypothesis. It seems inevitable that geophysicists will scurry to check the earlier palaeomagnetic data, analysing more igneous rocks on all continents at the narrowest possible time intervals.