Former Senior Lecturer at British Open University, research in remote sensing of arid lands, groundwater exploration, Precambrian tectonics and geochemistry
Creationist car in Athens, Georgia (credit:Amy Watts via Wikipedia)
Creationism is a topic about which I would not normally comment for much the same reason that once prompted pub landlords to have a sign behind the bar reading ‘No politics, no religion’. Yet geology has played an historically central role in the debate about Genesis vs Science. An excellent summary of how this emerged and was fundamentally resolved in favour of scientific endeavour, even if the ‘Genesisists’ have not been entirely rooted out, appeared in the Geological Society of America’s GSA Today in November 2012 (Montgomery, D.R. 2012. The evolution of creationism. GSA Today, v. 22, p. 4-9).
Starting with Steno’s break with a literal acceptance of Genesis in 1669, the dominant view grew among clerics as well as scientists – ‘back in the day’ often one and the same – that the Earth was far older and its history one of changing natural processes. That outlook prevailed to strengthen through the late-18th and 19th centuries. Of course there was a tendency among ‘people of the Book’ somehow to blend their religious and scientific views, along the line that ‘scientific revelations that contradicted biblical interpretations provided natural guidance for better interpreting scripture’. But by the end of the 19th century there were very few literal creationists though a great many Christians who endorsed attempts to reconcile biblical text and geology. Yet long after the Reverend William Buckland finally admitted in the mid-19th century that his imagination had ruled his zealous quest for evidence of a Noachian Flood and abandoned a literal idea of that and other aspects of Genesis there remained a persistent dribble of creationism.
A wry view of Young-Earth Creationism (Photo credit: seriouscher)
That minor current split in the 20th century into a ‘tanky’ tendency that defended young-Earth creation and a global flood in the last ten thousand years, and a more ‘moderate’ wing of ‘old-Earth’ creationists. ‘Old-Earthers’ happily accept geological evidence of great antiquity, but maintain that God made it for eventual use by humanity; i.e. it had just sat around awaiting Adam and Eve being expelled from Eden. Both wings evolved along equally bizarre paths using a logic that boils down to a blend of perversity and simply ignoring any contrary evidence, such as that unearthed by Buckland long before. For instance when confronted by the fact that the deepest parts of the oceans contain less sediment than has accumulated on the continents, they defy gravity by insisting that ocean basins were eroded out by the Flood and then deposited with all their internal structures intact on higher ground.
Unsurprisingly, most creationists believe that there has been a centuries-long conspiracy by scientists to mislead the rest of humanity. Were it not for the fact that more than 40% of people in the United States believe in young-Earth creation, David Montgomery’s account of what is now a somewhat one-sided yet stupidly lively debate as regards true evidence would be amusing. His concluding sentence, ‘How many creationists today know that modern creationism arose from abandoning faith that the study of nature would reveal God’s grand design for the world?’ is probably one of the best ways of enraging any creationist who tries to enlighten you: he/she will certainly not just go away, but in the foam they generate you should be able to make good your escape.
Despite global recession, worldwide job opportunities for geoscientists are increasing faster than the number of available applicants. In the US the Bureau of Labor Statistics predicts 21% growth in this sector in 2010-2020 (Perkins, S. 2011. Geosciences: Earth works. Nature, v. 473, p. 243–244). That figure does not include jobs freed-up by retirement: the demographics of employed geoscientists in the petroleum and mining industries are skewed markedly to the over-40s, peaking at age 50.
The American Geological Institute’s Geoscience Workforce Program has reported that the regions that produce most geoscience graduates, the US, Europe, Russia and China, are not meeting their domestic needs let alone global requirements. The demand stems from the traditional petroleum and mineral industries that are booming, together with the renewable energy sector and growing concern about environmental hazards and impacts attending global warming.
An editorial (Rare Earth scientists) in the December 2012 issue of Nature Geoscience is headlined, ‘Not enough young people enter the geosciences. A passion for the subject should be sparked early on.’ It then comments that the decline in young people studying the geosciences at school stems from Earth science not being taken seriously, under-education of their teachers and budgetary sacrifice of geoscience to preserve the more ‘traditional’ science subjects. The leading article concludes, ‘On an increasingly vulnerable planet, governments need to teach the young people of their country an understanding of the Earth’s basic make-up and dynamics, along with inspiring a fascination for its age and beauty. How else can we expect humanity to survive the Anthropocene?’
Creative work on the Open University campus (Photo credit: ianonline)
For over 40 years the Open University has been a key UK educator in geoscience. Since 1971 a total of about 170 thousand, mainly British students have studied at home through the OU for a science-based degree. Discovering tectonics, Earth structure, geology and palaeontology through studying the Science Foundation Course must have been a thrilling experience because since 1972, when the OU began to offer a level-2 course in Geology, around 30 thousand of its science ‘beginners’ decided to find out more; an average enrolment of 760 per year. The OU’s Department of Earth Sciences added more level-2 courses so that by 2000, students could also study economic geology (The Earth’s Physical Resources – 18 500 students from 1974 to 2009, averaging 544 per year), planetary science (The Earth: Structure, Composition and Evolution- 14 100 students from 1981 to 2005, averaging 590 per year) and Earth-system science (Earth and Life –7121 students from 1997 to 2006, averaging 712 per year).
After 1981 Open University students could, and many did, aim for a geoscience-oriented degree that also took in three, more advanced, level-3 studies. These were Oceanography (12 121 students from 1989 to 2012, averaging 505 per year), stratigraphy (The Geological Record of Environmental Change – 7968 students from 1976 to 2012, averaging 295 per year) and Earth’s internal processes (Understanding the Continents – 6994 students from 1976 to 2012, averaging 259 per year).
In this way the Open University became one of the world’s largest single providers of geoscience education, if not the largest: in the whole of the United States fewer than 3000 first degrees majoring in geoscience are awarded annually. Yet from its inception the OU’s Department of Earth Sciences had never claimed to be training professional geologists: had it been, its graduates would have significantly affected the world’s employment opportunities in the discipline. In fact that claim could never have been made, for one simple reason: distance learning for part-time students would always struggle to provide the volume of hands-on practical training that is the quintessence of this pre-eminently field- and lab-based discipline. Nevertheless the OU’s range of residential schools where practical activities were intensively provided for went a good way towards filling this gap.
Open University students at the now defunct Geology summer school, inspecting a fault. (Photo credit: Wikipedia)
So, to those unfamiliar with the realities of the OU milieu it will seem odd that in 2012 the world’s largest provider of distance learning axed all residential courses right across the science spectrum, including those in practical geoscience. But to those directly involved this move was the logical final step in a series of changes since 2001. Before that, for those courses that included a residential component attendance had been compulsory, except in special circumstances. Yet after 2001 university authorities deemed that the residential schools continue only as optional components for degree study and should carry an additional registration fee. Not surprisingly, in the case of the core level-2 Geology course attendance at the re-branded residential school declined to 30% after 2001.
Two other important developments attended this change in the Earth Science degree programme. After 2001 pass rates fell abruptly. For example, in the Science Foundation Course the rate fell from an annual average of 69 to 54%, and in level-2 Geology from 65 to 55%. Because residential schools played a vital role in boosting confidence and reinforcing home studies, equally as important as transferring practical skills, this dramatic fall in performance was only too predictable.
The other post-2001 development was an across-the-board fall in new registrants for Earth Science level-2 courses, especially in those that had previously not been served by residential studies: The Earth: Structure, Composition and Evolution from a pre-2001 average of 680 per year to 470 thereafter; Earth and Life from 866 to 558; The Earth’s Physical Resources from 795 to 456. The majority of those who enrolled for these courses having previously studied the core Geology course such dramatic declines are easily explained. Those who had opted out of the residential course missed its undoubted boost to confidence and enthusiasm, and reinforcement in basic geoscientific principles. More likely to underperform in the Geology course, they would not have felt equipped to deal with other level-2 courses, and ‘voted with their feet’.
Since its launch, TheEarth’s Physical Resources course had been acclaimed by geoscience teachers internationally for having made economic geology fascinating rather than a chore. In 2005-7 it had been completely refurbished and rising registrations bucked the downward trend. Yet in 2009, it was axed with little discussion. Declining enrolment for The Earth and Earth and Life prompted management to withdraw both and combine parts of their content in a single course Our Dynamic Planet: Earth and Life. Launched in 2007, by 2012 it attracted a mere 217 applicants. In 2013 it too will be withdrawn from the curriculum.
In late 2010 the OU’s Department of Earth Sciences held a celebration of its 40-year existence; yet only a year later in 2011 the department that had brought plate tectonics, advanced palaeontology, unravelling past climates, physical resources; planetary science and much besides to the widest student audience ever achieved ceased to be. It was merged into a restructured entity called the Department of Environment, Earth and Ecosystems. There seems to have been a failure of nerve and leadership that may have important consequences not only for the future of geoscience as a discipline and among the wider public but for the very knowledge necessary for our national and human survival. The future availability of remaining geoscience courses is uncertain, with all being expected to start for the last time within the next year or two. Perhaps some major transformation to meet increased needs for general public awareness of the way our planet works is being planned: let’s hope so and that any new offerings have as much impact as the earlier courses did before the start of the 21st century. It will be a hard task, as the Open University tripled its fees for students entering the OU system from 2012 onwards.
NOTE: (added 11 February 2013) The Open University has been offered the right of reply to this item.
Scientific American is renowned for its eminently readable reviews of both emerging and perennial topics. Its February 2013 issue takes on one that is guaranteed to run and run; the evolutionary course that produced us (Harman, K. 2013. Shattered ancestry. Scientific American, v. 308 (February 2013), p. 36-43). Since its launch Earth Pages has covered much of the new science in the field but did not anticipate the depth of the stir towards which it has led.
For a decade it has become increasingly clear that anatomically modern humans are unique in one respect: they are the first species in perhaps 4 million years to be the sole extant member of the cladistic tribe Hominini. As recently as 30 ka Homo sapiens shared the planet with Neanderthals, Denisovans, H. erectus and H. floresiensis. At the time the genus Homo emerged around 2.0-2.5 Ma ago there were at least four other fossil groups that shared the major characteristic of upright gait, all australopithecines in ‘robust’ and ‘gracile’ guises.
As time goes by there will likely be more fossil discoveries that show important anatomical signs of other novel evolutionary divergence, which therefore warrant new species. Pliocene-Pleistocene time is becoming crowded, and the more diversity in its fossil record the less likely it is that some clear evolutionary pathways can be devised to explain just what was going on. Katherine Harmon of Scientific American’s editorial team touches on the thorny issues of upright walking and gait, tree climbing, precise use of the fingers and thumb, and brain size that are raised by 22 species; 2 living and 20 extinct.
Genetics clearly indicates that our nearest living relatives belong to two species in the genus Pan(chimpanzees and bonobos). It has been generally assumed that the common ancestor of this extant kinship some 8 Ma back was chimp-like, and that evolutionary divergence from its habits and anatomy produced the growing ‘bramble patch’ of hominin evolution. That assumption is based on the principle of parsimony, i.e. the simplest view of the evidence – what there is now and fragments from the past eight million years. The trouble is there is a dearth of fossils that can be said to be en route to chimps in some way.
In fact today’s chimps and bonobos are more or less restricted to clambering in tropical forest habitats, for which they are well-adapted. Maybe they are the survivors of evolutionary vagaries just as complex as those leading to us. For one thing, almost embarrassingly, their brain size is substantially larger than those of quite a few fossil hominins; and why not? How they behave socially may possibly have arisen as part of their specialisation too, of which more shortly. Our big difference from them is being supreme generalists, as well as consciousness.
All the fossils classed as hominins show some signs of being able to walk upright, classically the forward position of the foramen magnum at the base of the skull where it joins to the backbone, but in some cases merely the geometry of the hip joint to the pelvis for that is all that has been found. Yet that anatomical likelihood glosses over the vital detail of the actual gait – heel-to-toe like us (Australopithecus afarensis), on the outside edge of the foot akin to chimps (Ardepithecus ramidus) or differently again but possible as efficient as us (Au. sediba). Then there is the matter of arboreal abilities: chimps are masters despite their bulk, but every hominin whose foot bones have been found shows some evidence of grasping with the big toe. Indeed humans are pretty nimble climbers but do not brachiate from branch to branch.
As regards the hands, an interesting point is that while chimpish knuckle walking is not seen in fossils, Ardipithecus probably could walk on all fours with hands flat on the ground but had fingers quite capable of precise manipulation, an ability shown spectacularly well by 2 Ma old Au. sediba. Upright walking may have evolved more than once, and it is even possible that chimps evolved specifically for climbing in forestlands, their highly adapted grasping hands only capable of knuckle walking on the ground.
Oreopithecus bambolii from the Upper Miocene of northern Italy(credit: Wikipedia)
The late-Miocene of Africa – the likely time range for the Pan-Homo common ancestor – is a fossil desert as regards primates. Yet its Italian equivalent has yielded a fascinating and well-preserved creature; Oreopithecus bambolii has skeletal features compatible with an upright posture and bipedal locomotion. Until the African Miocene yields something more appropriate, Oreopithecus is a candidate for a common ancestor, and interesting in another respect. Its dentition does not include prominent canine teeth that in the predominantly vegetarian, though occasionally carnivorous, Pan species serve well in their aggression-based, hierarchical social systems, as they do in the even more spectacular baboons.
Christopher Boehm, primate behaviouralist cum anthropologist, in his recent book Moral Origins (2012 Basic Books, ISBN-13: 978-0465020485) uses the principle of parsimony to reconstruct the social system of the Miocene Pan-Homo common ancestor from those of chimps and surviving human hunter-gatherers. His thesis is that it was centred on the hierarchical dominance of ‘alpha’ males, as is that of chimps. Prolonged social selection in hominin evolution largely tempered such a ‘Big Man’ tendency through a variety of strategies directed by majorities. Social punishments, including capital punishment, evolved to combat free-loading, theft and individual dominance in favour of cooperative egalitarianism. Such measures developed increasingly conscious self-suppression of such traits that eventually manifested themselves as what we now regard as human morals. Boehm considers that this psychological trend in evolution accelerated once Homo sapiens began hunting of large prey animals that added substantially to diet.
There is a major problem for this view: like Oreopithecus every well-preserved hominin species, even the earliest Sahelanthropus tchadensis, do not have prominent canines irrespective of whether they show evidence of at least partial meat-eating or pure vegetarianism. For some species with many fossil members, such as Au. afarensis, there are signs ofsexual dimorphism – larger males than females – but that does not necessarily signify hierarchical social behaviour. With the appearance of H. erectus that difference wanes to the present slight differences between modern male and female humans.
Agressive male humans, note gumshields (credit: John_Scone via Flickr)
If it is valid – and who knows? – for morphology to give clues to social behaviour, then it is equally likely that the beginnings of the hominin evolutionary thicket may well have involved a trend in social behaviour towards cooperative action; 8 million years ago. For generally small, gracile creatures with habits no more threatening to the big predators of the African savannahs that that of the porcupine, there would have been a powerful selection pressure towards a united front. Of course, in the last ten thousand years since the shift to economic strategies based on storable surpluses and their expropriation, hierarchical social systems with violence at their heart emerged among modern humans. Judging by the body shapes and dentition of extant ‘alphas’, as in capital’s boardrooms and among the frontbenchers at Westminster, anthropology clearly is in need of some refinement…
Full-colour image of Mercury from MESSENGER (credit: NASA via Wikipedia)
Astronomers welcomed in 2013 by suggesting from Kepler spacecraft data that the Milky Way galaxy alone probably hosts at least a hundred billion extrasolar planets and that a potentially habitable world the size of Earth probably lies within 20 light years of ours (go.nature.com/pxgbbt). OK, so there are at least 10-15 planets out there for every person likely to be alive by the mid-21 century when the technology becomes available to judge whether or not any of them hold a shred of interest for a population facing worsening living conditions right here.
Mercury is closer and currently being peered at in considerable detail by NASA’s MESSENGER mission to the Sun’s closest planet. The venture seems to have justified itself – and probably JAXA/ESA’s forthcoming BepiColumbo to be launched in 2015, arriving in 2022 – by showing that the long suspected ‘cold traps’ at Mercury’s poles have indeed trapped something: ice and abundant organic debris (Neuman, G.A . and 10 others 2013. Bright and dark polar deposits on Mercury: evidence for surface volatiles. Science, v. 339, p. 296-300).
The planet is exceeding rough, having been hit by objects of all sizes yet possessing insufficient internal energy to repave itself. Its axis of rotation is at a right angles to Mercury’s orbital plane, much like that of the Moon, so its polar regions are perpetually short of solar radiation. Deeply shadows places have been measured by infrared radiometry to be as cold as 25 degrees above absolute zero. Any volatile materials that might have landed in them or condensed there from earlier atmospheres might seem likely to stay there indefinitely. Not quite so, for the most likely compound, water ice, can sublimate away (shift directly from the solid to vapour state). Nevertheless, remote sensing shows the north pole region to be somewhat mottled dark and light on shadowed poleward-facing surfaces. The properties of backscattered radar beams and detection of emitted neutrons are consistent with the bright areas being water ice (Lawrence, D.J. and 12 others 2013. Evidence for water ice near Mercury’s north pole from MESSENGER neutron spectrometer measurements. Science, v. 339, p. 292-296). First estimates give a total ice volume of around 10 to 1000 km3 compared with almost 3 million km3 in the Greenland ice cap.
It’s the dark stuff that sets Mercury apart from, say, the Martian or lunar poles, the idea being that comets or icy asteroids impacting Mercury would have delivered complex organic compounds as well as water ice. This would temporarily give otherwise airless Mercury an atmosphere of volatiles parts of which might condense in the perpetually shaded parts of the polar region. Sublimation of exposed ice would have left a residue rich in those organic compounds that eventually protected deeper ice from fading away with time.
Now, imagine how supremely excited exo-planet hunters would be if they picked up such signals from a truly far-off world.
Porphyry sculpture of two of the four co-emperors of the late Roman Empire – the Tetrarchy (credit: mhobl via Flickr)
For about a century a style of mineral deposit that develops in and around shallow, silicic magma chambers has dominated world supplies of copper, molybdenum and, more rarely, tin. They are also enriched in other valuable elements, including gold and silver, which makes these deposits even more attractive to mine. Hosting them are fine-grained diorites and granodiorites that typically contain large crystals of quartz and feldspar set in the finer material. Technically such rocks are called porphyries; well not so technical because the name derives from many porphyries having a colour much valued by Egyptian and especially Roman sculptors and architects – a reddish purple close to that on the hem of an nobleman’s toga. The dye comes from the ‘purple’ fish – the marine mollusc Murex brandaris – which the ancient Greeks referred to as porphura. In Rome, ‘The Purple’ were the nobs, and today they are the cardinals. The connection is coincidental, the best and most enduring rocks for sculpting and making pyramids are of this kind, but happen to be purple. Of course, there are igneous rocks with the eponymous texture but different colours, but stonemasons in the ancient world never bothered to give them a special name
The porphyritic texture signifies to virtually every geologist a magmatic history in which an igneous magma resided deep in the crust slowly crystallizing large mineral grains. Then, for one reason or another, it was blurted towards the surface. Porphyry copper and molybdenum deposits have a disturbingly phallic shape; a tall, rough cylinder capped by a bell-shaped zone of mineralisation. And they are pretty big, the largest at Bingham Canyon in Utah, USA once having been ~2.5 km tall and 0.5 km wide, with a 2 km, bell-shaped zone of mineralisation affecting the intrusion and its surrounding country rock.
The world’s largest open-pit mine in the porphyry copper deposit at Bingham Canyon Utah (credit: Wikipedia)
Porphyry ores are not much for the rock aficionado to shout about and they are characterized by very low grades of ore, the metal-sulfide ore minerals and any gold being barely visible. They are economic because there is a great deal of rock with copper and molybdenum contents often less than 0.5%, and economic gold values less than a part per million (0.03 troy oz t-1). The bulk and the diversity of metals make mining porphyry deposits profitable. The ore minerals occur in tiny cracks that pervade the deposits forming a ‘stockwork’. That is where this style of mineralisation has a link with fracking shales to release their gas content. Stockworks are produced by very high-pressure steam that explosively fractures every cubic metre of the orebody. Crystallisation of sulfides and barren minerals keeps the fractures open until the system runs out of steam and mineralising fluids. Modelling of the thermodynamics associated with porphyry intrusions now suggests that once pressure and temperature stabilise at the requisite levels the hydraulic fracturing becomes self-sustaining (Weis, P. et al. 2012. Porphyry-copper ore shells form at stable pressure-temperature fronts within dynamic fluid plumes. Science, v. 338, p. 1613-1616). The key is the ‘fracking’ and as ‘shells’ with the right conditions migrate through the upper part of the intrusive system groundwater is drawn in to the freshly permeable rock to dissolve, transport and, where chemical conditions permit, to precipitate metals in the cracks. The modelling suggests a fundamental process that extends from plutonic systems, through volcanic edifices, hydrothermal processes in shallower rocks and active geothermal systems that vent to the surface.
Stockwork in copper-molybdenum porphyry deposit in Mexico (credit: Sundance Minerals)
In many respects the universality of hydraulic fracturing associated with increased heat flow, which itself can affect the crust repeatedly, may be the key to the concept of ‘metallogenic provinces’. These are large areas in which economic mineralisation of many styles but with much the same ‘blend’ of metals seems to have formed again and again during crustal evolution. Such provinces emerged from exploration and mining to present explorationists with the old adage, ‘To find an elephant go to elephant country’. Now there may be a theoretical basis on which new discoveries may be made.
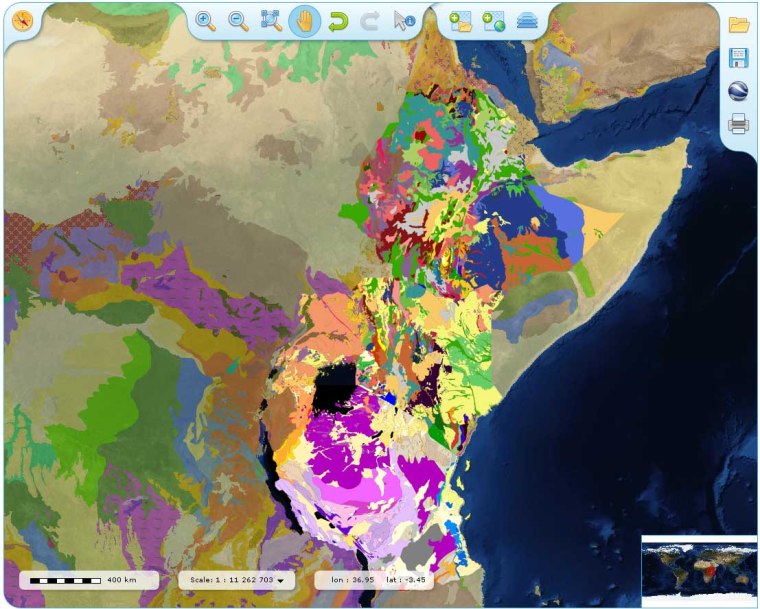
This item about the OneGeology map portal can now be read at Earth-logs in the Remote Sensing archive for 2013
Small-scale extract from the OneGeology portal with 1:2 million maps for Ethiopia, Kenya, Tanzania and Uganda, and at 1:10 million covering surrounding areas (credit:OneGeology portal)
The start of 2013 saw a massive puff from the British government for development of shale gas, Premier David Cameron crying ‘Britain must be at the heart of the shale gas revolution’. Fearful of the rapidly growing shift from Britain’s natural-gas self reliance to dependence on the Gulf, Russia and Norway the Conservative-Liberal Democrat coalition gave the green light for ‘frack drilling’ to restart. This followed a pause following seismicity in the Blackpool area that attended Cuadrilla’s exploratory drilling into the gas-rich Carboniferous Bowland Shale thereabouts. There is also a nice sweetener for the new industry in the form of tax breaks.
Boris Johnson holds a model London red bus (Photo credit: Wikipedia)
London Mayor Boris Johnson, a possible contender for Tory leadership, seems pleased. And perhaps he should be, as the Lib-Con coalition will be tested because the junior partners depend electorally, to some extent, on ‘green’ credentials. The Lib-Dem Energy Minister, Ed Davey, seemingly favours an automatic halt to drilling should there be seismicity greater than 0.5 on the Richter scale; an energy level less than experienced every day in London from its Underground trains. Political commentators have forecast that green issues may exacerbate tensions within the coalition in the second half of its scheduled 5-year term, especially as the electorate seems set to reduce the Liberal Democrat partners to irrelevance in future elections.
Natural gas’s biggest ‘green’ plus is that being a hydrocarbon its burning releases considerably less CO2 than does its coal energy equivalent, the hydrogen content becoming water vapour. Yet the dominant gas is methane, which has a far larger greenhouse effect than the CO2 released by its burning. To avoid that presenting increased atmospheric warming, extracting natural gas needs to avoid leakage. Unfortunately for those bawling lustily about the economic potential of fracking source rocks such as the Bowland Shale, recent aerial surveys over US gas fields will come as a major shock. At the annual meeting of the American Geophysical Union in early December 2012 methane emissions from two large gas fields in the western US were released (Tollefson, J. 2013. Methane leaks erode green credentials of natural gas. Nature, v. 493, p. 12). They amount to 9% of total production, which would more than offset the climatic ‘benefit’ of using natural gas as a coal alternative.
A shift from coal to natural gas-fuelled power generation would slow down climatic warming, if leakage is kept below the modest level of 3.2% of production. So if the latest measurements are an unavoidable norm for gas fields then natural gas burning in fact increases global warming. Even more telling is that, until the shale ‘fracking revolution’, gas was produced by drilling into permeable reservoir rocks capped by a seal rock – usually a shale. The gas would not have leaked except from the well itself. Fracking, by design, increases the permeability of what would otherwise be a seal rock – hydrocarbon-rich shale – over a large area.
Schematic cross-section illustrating types of natural gas deposits (credit: Wikipedia)
Aerial analyses to check emissions over oil and gas fields, let alone over shale-gas operations, are not widespread. However, the technology is not new. Where emissions are strictly enforced in populated areas, as over oil terminals and refineries, overflights to sample the air have been routine for several decades. Little mention is made of such precautionary measures in the promotion of fracking.
Another point is that as well as often being far from habitations, US shale-gas operations are generally into simple stratigraphy and structure. The Lower Carboniferous Bowland Shale now being touted as fuel for Britain’s escape from a descent into economic depression, with its estimated 200 trillion cubic feet of as potential, is intensely faulted and broadly folded, having experienced the Variscan orogeny at the end of the Palaeozoic Era. The complexity and pervasiveness of this brittle deformation is amply shown by geological maps of former coalfields that incorporate subsurface information from mine workings. The Bowland Shale lies below the Upper Carboniferous Coal Measures, many of the likely targets for fracking have never been subject to intensive underground mining simply because the Coal Measures were eroded away tens of million years ago. Consequently the degree to which many fracking targets may be riven by surface-breaking faults and fracture zones is not and possibly never will be known in the detail needed to assess widespread methane leakage.
Sometime in early 2013, the British Geological Survey is set to release estimates of the Bowland Shale gas reserves, in which its detailed mapping archives will have played the major role. That report will bear detailed scrutiny as regards the degree to which it also assesses potential leakage.
A measure of the esteem in which a peer-reviewed paper is held is supposedly the number of times to which it is referred in other papers. Of course, the older a paper is the more chance that such citations will have built up; but the annual rate of citation is likely to fizzle out over time. Papers that create a frisson of initial excitement and command enduring citation are few and far between: they probably launched a new line of inquiry.
It is instructive to try to nail Alfred Wegener’s influence in tectonics using the Web of Science, which ought to have been pretty high. Superficially, he had none and is remembered through that arm of Thomson Reuters for six papers: four on atmospheric physics – his speciality; one on lunar craters and a sixth on the patterns of cracking seen on rotten wood. These give him a mere 20 citations. Wegener’s posthumous problem was that Die Entstehung der Kontinente first appeared in the fourth issue of Geologische Rundshau in 1912, and seemingly the Web of Science doesn’t have that journal in its archives of a century ago. Later, extended editions appeared in book format which were not peer reviewed (most geoscientists would not touch his ideas with a barge pole until long after his death in 1930), and are therefore outside the academic pale. The key to a plausible mechanism for continental drift – symmetrical magnetic striping above ocean basins – was first described by Fred Vine and Drummond Matthews in an issue of Nature in 1963. In 50 years their work, ranking with discovering the structure of DNA, has accumulated 709 citations; i.e. 38.5 citations per year on average, which is not much for fuelling a revolution.
Alfred Wegener, the unsung hero of continental drift(credit: Wikipedia)
Of course, citation is not the same as the frequency at which a paper is read. It is no secret that a not inconsiderable number of papers that appear in published reference lists haven’t been read by the authors who cite them. They are there by proxy, and you will probably find them in the bibliography of later papers that those same authors have cited. There is perhaps a certain kudos in such proxy citations, for it may be that the cited paper has achieved the equivalent of canonical status in the field.
Citation frequency is something of a lottery: language of publication; discipline (since 1953 Crick and Watson achieved three times Vine and Matthews’s average citations); date of publication (E. Komatsu of the University of Texas at Austin has already had 1939 citations for his February 2011 paper ‘Seven-Year Wilkinson Microwave Anisotropy Probe Observations: Cosmological Interpretations’ published in a supplement to the Astrophysical Journal; nine times the rate of Crick and Watson, but the paper is about the origin of everything)
Interestingly, the December 2012 issue of Geology presents stats on the most cited papers that it has published since 2000 (Cowie, P.A. 2012. Highly cited Geology papers (2000-2010) – What were they and who wrote them? Geology, v. 40, p. 1147-1148). Geology is among the highest ranking journals in the geoscience field, and had an impact factor of 4.8 over the last 5 years. A journal’s impact factor is the number of times all articles published in a 2-year period were cited in all indexed journals in the year following them, divided by the total number of articles published in the two years by the assessed journal. So, papers published in Geology between2007 and 2011 were cited on average 4.8 times in the year following publication. This journal is a useful source of citation statistics as it covers the full range of geoscience and all papers are limited to 4 printed pages, thereby forcing authors to be concise and clear in their writing and illustration. Consequently it is popular, which, incidentally, may explain its high impact factor.
Of the 33 papers cited most between 2000 and 2010, 14 are on topics relating to Tibet and China. There are 3 on oceanography; 3 on paleontology and extinctions; 6 on palaeoclimatology; 10 on tectonics and 10 on magmatism (3 of which were about rare adakites formed by partial melting of subducted oceanic crust). I haven’t read all of the papers, and the stats on topics may tell us very little, but I would bet that papers about geology in high-population emerging countries – China, India and Brazil – are met gleefully by rapidly growing communities of eager young geoscientists. It may even be worth a flutter on adakites as the ‘next big thing’ in petrogenesis. Mind you, it looks like I am not likely to be the best punter for hot papers, as out of the 33 ‘top-3’ papers since 2000, only 6 made it into Earth Pages, and of those only one between 2004-2010.
The digest goes on to show that year-by-year as many as 10 % of papers in Geology are not cited at all, up to 70% are cited between 1 and 5 times per year, while less than 10% get 10 or more citations in a year. Oddly, the author suggests that a dip in citations of Geology papers in recent years may reflect the launch of Nature Geoscience in 2008. Yet glossy as that new addition to the Nature stable might be, it has become something of a desert for papers on geology. Then there is evidence for both ‘vintage’ and ‘just-about-drinkable’ years in Geology citations: the ‘top ten’ papers in 2001, 2005, 2006, 2008 and 2010 ranged from 10-15 citations for the tenth to 20-25 for the ‘hottest’ paper, while in 2000, 2002, 2003, 2004, 2007 and 2009 the most cited papers stood well above the rest at 32 to 55 citations per year. But that may just reflect the uneven pace at which well-received and provocative work emerges.
So, it begins to seem, from Geology at least, that for most geoscience authors publishing isn’t going to raise much hope as far as jobs or promotions are concerned. Yet if results are not published funding agencies may become fractious about your next grant application, and of course, university science departments puff themselves with annual publication rates (though rarely citation records, which as far as geosciences goes could be a wise move). But it is a matter of academic duty to publish for the record; even if a paper fills just one tiny niche the cumulative effect of publically available knowledge does eventually result in breaks through – one never knows… It could be a salutary lesson should publishers release data on hits for on-line PDFs of papers, as that would give some indication of how many readers individual papers have, but as for a ‘like this’ button or a means of star rating I think we have to venture into the deeper recesses of academic conservatism one small step at a time.
Charting the variation in gravitational potential across a planet provides a measure of the distribution of mass beneath its surface. That depends on both the planet’s actual shape and on internal variations in rock density. The Earth’s gravity has been mapped with varying degrees of precision, depending on sample spacing, by surface measurements using gravimeters. Doing gravity surveys from space cannot be so direct, however. One ingenious approach for the gravitational field over the oceans is to measure the mean height of the ocean surface using radar beams from a satellite. Since this is affected by variations in the gravitational field, partly due to bathymetry and partly because of varying density beneath the ocean floor, removing the calculable bathymetric effect leaves a gravitational signal from the underling lithosphere and deeper mantle. The first satellite to illuminate the Earth with radar microwaves, Seasat, gradually built up such a gravitational map of the deep Earth over a period of 105 days in 1978, which was followed up by other satellites such as the ERS series and Topex-Poseidon.
The GRAIL satellites in lunar orbit (credit: Wikipedia)
It is not so easy to map gravity precisely above a solid planetary surface, but through the GRACE experiment this can be done by measuring very precisely the distance between a pair of satellites that follow the same orbit. As the gravitational field changes so too does the separation between the tandem of satellites; an increase in gravity pulls the satellites closer together and vive versa. GRACE has provided some fascinating data, such as estimates of the withdrawal of groundwater from large sedimentary basins and shrinkage of ice caps. However, GRACE is limited in its resolution of gravitational anomalies by the fact that Earth has an atmosphere above which such tandems must be parked in orbit to avoid burning up. The higher the orbit, the more degraded is the resolution. This effect is much less for Mars and non-existent for the Moon.
Gravity field of the moon as measured by NASA’s GRAIL mission. The far side of the moon is at the centre, whereas the nearside (as viewed from Earth) is at either side. (credit: NASA/ARC/MIT)
A sister experiment to GRACE has been orbiting the Moon since September 2011: the Gravity Recovery and Interior Laboratory (GRAIL). First the tandem orbited at 55 km, then 22 and for a brief period 11 km, before running out of thruster fuel on 17 December 2012 and crashing into the lunar surface. Results from the highest orbit resolve lunar gravity to 13 km cells, recently reported on-line in three papers (Zuber, M.T. and 16 others 2012. Gravity field of the Moon from the Gravity Recovery and Interior Laboratory (GRAIL) Mission. Science, doi 10.1126/science.1231507; Wieczorek, M.A. and 15 others 2012. The crust of the Moon as seen by GRAIL. Science, doi 10.1126/science.1231530; Andrews-Hanna, J.C. and 18 others 2012. Ancient igneous intrusions and early expansion of the Moon revealed by GRAIL gravity gradiometry. Science, doi 10.1126/science.1231753). From crater gravitational signatures due to variations in surface topography it seems that the early bombardment of the lunar surface far exceeded previous assumptions. Impact effects dominate the GRAIL data at this resolution, but 2% of the information relates to structures hidden at depth.
500 km linear anomaly in the Moon’s far-side gravitational field. (credit: NASA/JPL-Caltech/CSM)
There are linear gravity anomalies extending over hundreds of kilometres, which may be huge igneous intrusions in the form of dykes; perhaps reflections of early influences of early extensional tectonics in the Moons lithosphere. Estimates point to this having been due to an up to 5 km increase in the lunar radius, probably as a result of thermal changes. The dominant feature of the lunar surface is not the near-side flat basaltic maria, visually prominent as they are, but the far more rugged lunar highlands which stand far higher because of the lower density of their constituent feldspar-rich anorthosites. GRAIL permitted a bulk estimate of the density of highland crust that turned out to be substantially lower, at 2550 kg m-3 – compared with 2600-2700 for granite and 2800-3000 for basalt – than originally estimated from samples returned by the Apollo mission. This forces a reassessment of the thickness of highland crust from 50-60 km to between 34 and 43 km, with a near-surface layer that has a porosity of around 12%, probably resulting from its awful battering. A thinner highland crust than previously assumed presents a bulk geochemical picture that need not be more enriched in ‘refractory’ elements, such as aluminium and calcium, than is the Earth.
Such unanticipated results from the low-resolution mode of the GRAIL experiment have its science team almost salivating at prospects from the sharper ‘pictures’ that will arise from the lower altitude orbits.
Edicara sandstones in the Flinders Ranges of South Australia (credit: Wikipedia).
The first macroscopic life forms were the enigmatic bag-like and quilted fossils in sedimentary rocks dating back to 635 Ma in Australia, eastern Canada and NW Europe. They are grouped as the Ediacaran Fauna named after the Ediacara Hills in South Australia where they are most common and diverse. Generally they are not body fossils but impressions of soft-bodied organisms, often in sandstones rather than muds. Some are believed to be animals that absorbed nutrients through their skin, whereas others are subjects of speculation. One thing seems clear; these first metazoans arose because of some kind of trigger provided by the global glacial conditions that preceded their appearance. It has always been assumed that, whatever they were, Ediacaran organisms lived on the sea floor, probably in shallow water. New sedimentological evidence found in the type locality by Gregory Retallack of the University of Oregon seems set to force a complete rethink about these hugely important life forms (Retallack, G.J 2012. Ediacaran life on land. Nature (online), doi:10.1038/nature11777). So momentous are his conclusions that they form the subject of a Nature editorial in the 13 December 2012 issue.
Retallack, a specialist on ancient soils of the Precambrian, examined reddish facies of the Ediacara Member of the Rawnsley Quartzite of South Australia, whose previous interpretation have a somewhat odd background. Originally regarded as non-marine, before their fossils were discovered, when traces of jellyfish-like organisms turned up this view was reversed to marine, the red coloration being ascribed to deep Cretaceous weathering. A range of features, such as clasts of red facies in grey Ediacaran rocks, the presence of feldspar in the red facies – unlikely to have survived deep weathering – bedding surfaces with textures very like those formed by subaerial biofilms, and desiccation cracks, suggest to Retallack that the red facies represents palaeosols in the sedimentary sequence. Moreover, some features indicate a land surface prone to freezing from time to time. The key observation is that this facies contains Ediacaran trace fossils representing many of the forms previously regarded as marine animals of some kind, including Spriggina, Dickinsonia and Charnia on which most palaeontologists would bet good money that they were animals, albeit enigmatic ones.
Specimen of Edicaran Dickinsonia (credit: Wikipedia)
If Retallack’s sedimentological observations are confirmed then organisms found in the palaeosols cannot have been animals but perhaps akin to lichens or colonial microbes, and survived freezing conditions. As they occur in other facies more likely to be subaqueous, then they were ‘at home’ in a variety of ecosystems. As the Nature editorial reminds us, from the near-certainty that early macroscopic life was marine there is a chance that views will have to revert to a terrestrial emergence first suggested in the 1950s by Jane Grey. Uncomfortable times lie ahead for the palaeontological world.


