Divining the possible climatic impacts of slowing North Atlantic current patterns

Meltwater channels and lake on the surface of the Greenland ice sheet

In August 2024 Earth-Logs reported on the fragile nature of thermohaline circulation of ocean water. The post focussed on the Atlantic Meridional Overturning Circulation (AMOC), whose fickle nature seems to have resulted in a succession of climatic blips during the last glacial-interglacial cycle since 100 ka ago. They took the form of warming-cooling cycles known as Dansgaard-Oeschger events, when the poleward movement of warm surface water in the North Atlantic Ocean was disrupted. An operating AMOC normally drags northwards warm water from lower latitudes, which is more saline as a result of evaporation from the ocean surface there. Though it gradually cools in its journey it remains warmer and less dense than the surrounding surface water through which it passes: it effectively ‘floats’. But as the north-bound, more saline stream steadily loses energy its density increases. Eventually the density equals and then exceeds that of high-latitude surface water, at around 60° to 70°N, and sinks. Under these conditions the AMOC is self-sustaining and serves to warm the surrounding land masses by influencing climate. This is especially the case for the branch of the AMOC known as the Gulf Stream that today swings eastwards to ameliorate the climate of NW Europe and Scandinavia as far as Norway’s North Cape and into the eastern Arctic Ocean.

The suspected driving forces for the Dansgaard-Oeschger events are sudden massive increases in the supply of freshwater into the Atlantic at high northern latitudes, which dilute surface waters and lower their density. So it becomes more difficult for surface water to become denser on being cooled so that it can sink to the ocean floor. The AMOC may weaken and shut down as a result and so too its warming effect at high latitudes. It also has a major effect on atmospheric circulation and moisture content: a truly complicated climatic phenomenon. Indeed, like the Pacific El Niño-Southern Oscillation (ENSO), major changes in AMOC may have global climatic implications.  QIyun Ma of the Alfred Wegner Institute in Bremerhaven, Germany and colleagues from Germany, China and Romania have modelled how the various possible locations of fresh water input may affect AMOC (Ma, Q. et al. 2024. Revisiting climate impacts of an AMOC slowdown: dependence on freshwater locations in the North Atlantic. Science Advances, v. 10, article eadr3243; DOI: 10.1126/sciadv.adr3243). They refer to such sudden inputs as ‘hosing’!

Location of the 4 regions in the northern North Atlantic used by Ma et al. in their modelling of AMOC: A Labrador Sea; B Irminger Basin; C NE Atlantic; D Nordic Seas. Colour chart refers to current temperature. Solid line – surface currents, dashed line – deep currents

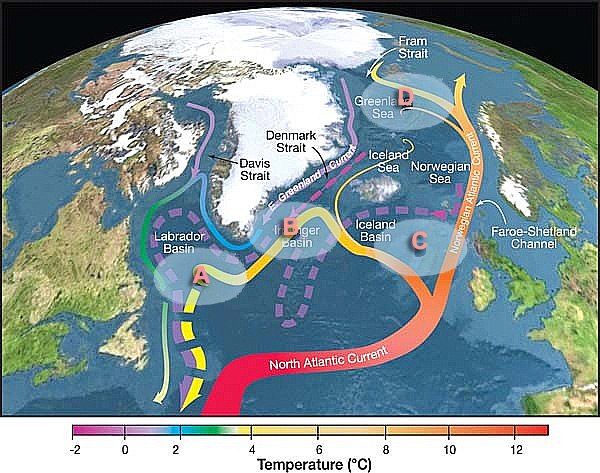
First, the likely consequences under current climatic conditions of such ‘hosings’ and AMOC collapses are: a rapid expansion of the Arctic Ocean sea ice; delayed onset of summer ice-free conditions; southward shift of the Intertropical Convergence Zone (ITCZ) –  a roughly equatorial band of low pressure where the NE and SE trade winds converge, and the rough location of the sometimes windless Doldrums. There have been several attempts to model the general climatic effects of an AMOC slowdown. Ma et al. take matters a step further by using the Alfred Wegener Institute Climate Model (AWI-CM3) to address what may happen following ‘hosing’ in four regions of the North Atlantic: the Labrador Sea (between Labrador and West Greenland); the Irminger Basin (SE of East Greenland, SW of Iceland); the Nordic Seas (north of Iceland; and the Greenland-Iceland-Norwegian seas) and the NE Atlantic (between Iceland, Britain and western Norway).

Prolonged freshwater flow into the Irminger Basin has the most pronounced effect on AMOC weakening, largely due to a U-bend in the AMOC where the surface current changes from northward to south-westward flow parallel to the East Greenland Current. The latter carries meltwater from the Greenland ice sheet whose low density keeps it near the surface. In turn, this strengthens NE and SW winds over the Labrador Sea and Nordic Seas respectively, which slow this part of the AMOC. In turn that complex system slows the entire AMOC further south. Since 2010 an average 270 billion tonnes of ice has melted in Greenland each year. This results in an annual 0.74 mm rise in global sea level, so the melted glacial ice is not being replenished. When sea ice forms it does not take up salt and is just as fresh as glacial ice. Annual melting of sea ice therefore temporarily adds fresh water to surface waters of the Arctic Ocean, but the extent of winter sea ice is rapidly shrinking. So, it too adds to freshening and lowering the density of the ocean-surface layer. The whole polar ocean ‘drains’ southwards by surface currents, mainly along the east coast of Greenland potentially to mix with branches of the AMOC. At present they sink with cooled more saline water to move at depth. To melting can be added calving of Greenlandic glaciers to form icebergs that surface currents transport southwards. A single glacier (Zachariae Isstrom) in NE Greenland lost 160 billion tonnes of ice between 1999 and 2022. Satellite monitoring of the Greenland glaciers suggests that a trillion tonnes have been lost through iceberg formation during the first quarter of the 21st century. Accompanying the Dansgaard-Oeschger events of the last 100 ka were iceberg ‘armadas’ (Heinrich events) that deposited gravel in ocean-floor sediments as far south as Portugal.

 The modelling done by Ma et al. also addresses possible wider implications of their ‘hosing’ experiments to the global climate. The authors caution that this aspect is an ‘exploration’ rather than prediction. Globally increased duration of ‘cold extremes’ and dry spells, and the intensity of precipitation may ensue from downturns and potential collapse of AMOC. Europe seems to be most at risk. Ma et al. plea for expanded observational and modelling studies focused on the Irminger Basin because it may play a critical role in understanding the mechanisms and future strength of the AMOC.

 See also: Yirka, R. 2024. Greenland’s meltwater will slow Atlantic circulation, climate model suggests. Phys Org, 21 November 2024

Climate changes and the mass extinction at Permian-Triassic boundary

The greatest mass extinction in Earth’s history at around 252 Ma ago snuffed out 81% of marine animal species, 70% of vertebrates and many invertebrates that lived on land. It is not known how many land plants were removed, but the complete absence of coals from the first 10 Ma of the Early Triassic suggests that luxuriant forests that characterised low-lying humid area in the Permian disappeared. A clear sign of the sudden dearth of plant life is that Early Triassic river sediments were no longer deposited by meandering rivers but by braided channels. Meanders of large river channels typify land surfaces with abundant vegetation whose root systems bind alluvium. Where vegetation cover is sparse, there is little to constrain river flow and alluvial erosion, and wide braided river courses develop (see: End-Permian devastation of land plants; September 2000. You can follow 21st century developments regarding the P-Tr extinction using the Palaeobiology index).

The most likely culprit was the Siberian Trap flood basalts effusion whose lavas emitted huge amounts of CO2 and even more through underground burning of older coal deposits (see: Coal and the end-Permian mass extinction; March 2011) which triggered severe global warming. That, however, is a broad-brush approach to what was undoubtedly a very complex event. Of about 20 volcanism-driven global warming events during the Phanerozoic only a few coincide with mass extinctions. Of those none comes close the devastation of ‘The Great Dying’, which begs the question, ‘Were there other factors at play 252 Ma ago?’ That there must have been is highlighted by the terrestrial extinctions having begun significantly earlier than did those in marine ecosystems, and they preceded direct evidence for climatic warming. Also temperature records – obtained from shifts in oxygen isotopes held in fossils – for that episode are widely spaced in time and tell palaeoclimatologists next to nothing about the details of the variation of air- and sea-surface temperature (SST) variations.

Modelled sea-surface temperatures in the tropics in the early stages of Siberian Trap eruptions with atmospheric CO¬2 at 857 ppm – twice today’s level. (Credit: Sun et al., Fig. 1A)

Earth at the end of the Permian was very different from its current wide dispersal of continents and multiple oceans and seas. Then it was dominated by Pangaea, a single supercontinent that stretched almost from pole to pole, and a surrounding vast ocean known as Panthalassa. Geoscientists from China, Germany, Britain and Austria used this simple palaeogeography and the available Early Triassic greenhouse-gas and  palaeo-temperature data as input to a climate prediction model (HadCM3BL) (Yadong Sun and 7 others 2024. Mega El Niño instigated the end-Permian mass extinction. Science 385, p. 1189–1195; DOI: 10.1126/science.ado2030  – contact yadong.sun@cug.edu.cn for PDF).. The computer model was developed by the Hadley Centre of the UK Met Office to assess possible global outcomes of modern anthropogenic global warming. It assesses heat transport by atmospheric flow and ocean currents and their interactions. The researchers ran it for various levels of atmospheric CO2 concentrations over the estimate 100 ka duration of the P-Tr mass extinction.

The pole-to-pole continental configuration of Pangaea lends itself to equatorial El Niño and El Niña type climatic events that occur today along the Pacific coast of the Americas, known as the El Niño-Southern Oscillation. In the first, warm surface water builds-up in the eastern tropical Pacific Ocean. It then then drifts westwards to allow cold surface water to flow northwards along the Pacific shore of South America to result in El Niña. Today, this climatic ‘teleconnection’ not only affects the Americas but also winds, temperature and precipitation across the whole planet. The simpler topography at the end of the Permian seems likely to have made such global cycles even more dominant.

Sun et al’s simulations used stepwise increases in the atmospheric concentration of CO2 from an estimated  412 parts per million (ppm) before the eruption of the Siberian Traps (similar to those today) to a maximum of 4000 ppm during the late-stage magmatism that set buried coals ablaze. As levels reached 857 ppm SSTs peaked at 2 °C above the mean level during El Niño events and the cycles doubled in length. Further increase in emissions led to greater anomalies that lasted longer, rising to 4°C above the mean at 4000 ppm. The El Niña cooler parts of the cycle steadily became equally anomalous and long lasting. This amplification of the 252 Ma equivalent of the El Niño-Southern Oscillation would have added to the environmental stress of an ever increasing global mean surface temperature.  The severity is clear from an animation of mean surface temperature change during a Triassic ENSO event.

Animation of monthly average surface temperatures across the Earth during an ENSO event at the height of the P-Tr mass extinction. (Credit: Alex Farnsworth, University of Bristol, UK)

The results from the modelling suggest increasing weather chaos across the Triassic Earth, with the interior of Pangaea locked in permanent drought. Its high latitude parts would undergo extreme heating and then cooling from 40°C to -40°C during the El Niño- El Niña cycles. The authors suggest that conditions on the continents became inimical for terrestrial life, which would be unable to survive even if they migrated long distances. That can explain why terrestrial extinctions at the P-Tr boundary preceded those in the global ocean. The marine biota probably succumbed to anoxia (See: Chemical conditions for the end-Permian mass extinction; November 2008)

There is a timely warning here. The El Niño-Southern Oscillation is becoming stronger, although each El Niño is a mere 2 years long at most, compared with up to 8 years at the height of the P-Tr extinction event. But it lay behind the record 2023-2024 summer temperatures in both northern and southern hemispheres, the North American heatwave of June 2024 being 15°C higher than normal. Many areas are now experiencing unprecedentedly severe annual wildfires. There also finds a parallel with conditions on the fringes of Early Triassic Pangaea. During the early part of the warming charcoal is common in the relics of the coastal swamps of tropical Pangaea, suggesting extensive and repeated wildfires. Then charcoal suddenly vanishes from the sedimentary record: all that could burn had burnt to leave the supercontinent deforested.

See also: Voosen, P. 2024. Strong El Niños primed Earth for mass extinction. Science 385, p. 1151; DOI: 10.1126/science.z04mx5b; Buehler, J. 2024. Mega El Niños kicked off the world’s worst mass extinction. ScienceNews, 12 September 2024.

The gross uncertainty of climate tipping points

That the Earth has undergone sudden large changes is demonstrated by all manner of geoscientific records. It seems that many of these catastrophic events occurred whenever steady changes reach thresholds that trigger new behaviours in the interlinked atmosphere, hydrosphere, atmosphere, biosphere and lithosphere that constitute the Earth system. The driving forces for change, both steady and chaotic, may be extra-terrestrial, such as the Milankovich cycles and asteroid impacts, due to Earth processes themselves or a mixture of the two. Our home world is and always has been supremely complicated; the more obviously so as knowledge advances.  Abrupt transitions in components of the Earth system occur when a critical forcing threshold is passed, creating a ‘tipping point’. Examples in the geologically short term are ice-sheet instability, the drying of the Sahara, collapse of tropical rain forest in the Amazon Basin, but perhaps the most important is the poleward transfer of heat in the North Atlantic Ocean. That is technically known as the Atlantic Meridional Overturning Circulation with the ominous acronym AMOC.

Simplified Atlantic Meridional Overturning Circulation (AMOC). Red – warm surface currents; cyan – cold deep-water flow. (Credit: Stefano Crivellari)

As things stand today, warm Atlantic surface water, made more saline and dense by evaporation in the tropics is transferred northwards by the Gulf Stream. Its cooling at high latitudes further increases the density of this water, so at low temperatures it sinks to flow southwards at depth. This thermohaline circulation continually pulls surface water northwards to create the AMOC, thereby making north-western European winters a lot warmer than they would be otherwise. Data from Greenland ice cores show that during the climatic downturn to the last glacial maximum, the cooling trend was repeatedly interrupted by sudden warming-cooling episodes, known as Dansgaard-Oeschger events, one aspect of which was the launching of “armadas” of icebergs to latitudes as far south as Portugal (known as Heinrich events), which left their mark as occasional gravel layers in the otherwise muddy sediments on the deep Atlantic floor (see: Review of thermohaline circulation; February 2002).

These episodes involved temperature changes over the Greenland icecap of as much as 15°C.  They began with warming on this scale within a matter of decades followed by slow cooling to minimal temperatures, before the next turn-over. Various lines of evidence suggest that these events were accompanied by shutdowns of AMOC and hence the Gulf Stream, as shown by variations in the foraminifera species in sea-floor sediments. The culprit was vast amounts of fresh water pouring into the Arctic and northernmost Atlantic Oceans, decreasing the salinity and density of the surface ocean water. In these cases that may have been connected to repeated collapse of circumpolar ice sheets to launch Heinrich’s iceberg armadas. A similar scenario has been proposed for the millennium-long Younger Dryas cold spell that interrupted the onset of interglacial conditions. In that case the freshening of high-latitude surface water was probably a result of floods released when glacial barriers holding back vast lakes on the Canadian Shield burst.

At present the Greenland icecap is melting rapidly. Rising sea level may undermine the ice sheet’s coastal edges causing it to surge seawards and launch an iceberg armada. This may be critical for AMOC and the continuance of the Gulf Stream, as predicted by modelling: counter-intuitive to the fears of global warming, at least for NW Europe. In August 2024 scientists from Germany and the UK published what amounts to a major caution about attempts to model future catastrophes of this kind (Ben-Yami, M. et al 2024, Uncertainties too large to predict tipping times of major Earth system components from historical dataScience Advances, v. 10, article  eadl4841; DOI 10.1126/sciadv.adl4841). They focus on records of the AMOC system, for which an earlier modelling study predicted that a collapse could occur between 2025 and 2095: of more concern than global warming beyond the 1.5° C currently predicted by greenhouse-gas climate models .

Maya Ben-Yami and colleagues point out that the assumptions about mechanisms in Earth-system modelling and possible social actions to mitigate sudden change are simplistic.  Moreover, models used for forecasting rely on historical data sets that are sparse and incomplete and depend on proxies for actual variables, such as sea-surface and air temperatures. The further back in geological time, the more limited the data are. The authors assess in detail data sets and modelling algorithms that bear on AMOC. Rather than a chance of AMOC collapse in the 21st century, as suggested by others, Ben Yami et al. reckon that any such event  lies between 2055 and 8065 CE, which begs the question, “Is such forecasting  worth the effort?”, however appealing it might seem to the academics engaged in climatology. The celebrated British Met Office and other meteorological institutions, use enormous amounts of data, the fastest computers and among the most powerful algorithms on the planet to simulate weather conditions in the very near future. They openly admit a limit on accurate forecasting of no more than 7 day ahead. ‘Weather’ can be regarded as short-term climate change.

It is impossible to stop scientists being curious and playing sophisticated computer games with whatever data they have to hand. Yet, while it is wise to take climate predictions with a pinch of salt because of their gross limitations, the lessons of the geological past do demand attention. AMOC has shut down in the past – the last being during the Younger Dryas – and it will do so again. Greenhouse global warming probably increases the risk of such planetary hiccups, as may other recent anthropogenic changes in the Earth system. The most productive course of action is to reduce and, where possible, reverse those changes. In my honest opinion, our best bet is swiftly to rid ourselves of an economic system that in the couple of centuries since the ‘Industrial Revolution’ has wrought these unnatural distortions.

Did Precambrian BIFs ‘fall’ into the mantle to trigger mantle plumes?

How the Earth has been shaped has depended to a large extent on a very simple variable among rocks: their density. Contrasts in density between vast rock masses are expressed when gravity attempts to maintain a balance of forces. The abrupt difference in elevation of the solid surface at the boundaries of oceans and continents – the Earth’s hypsometry – stems from the contrasted densities of continental and oceanic crust: the one dominated by granitic rocks (~2.8 t m-3) the other by those of basaltic composition (~ 3.0 t m-3). Astronomers have estimated that Earth’s overall density is about 5.5 t m-3 – it is the densest planet in the Solar System. The underlying mantle makes up 68% of Earth’s mass, with a density that increases with depth from 3.3 to 5.4 t m-3 in a stepwise fashion, at a number of discontinuities, because mantle minerals undergo changes induced by pressure. The remaining one third of Earth’s mass resides in the iron-nickel core at densities between 9.5 to 14.5 t m-3. Such density layering is by no means completely stable. Locally increased temperatures in mantle rocks reduce their density sufficiently for masses to rise convectively to be replaced by cooler ones, albeit slowly. By far the most important form of convection affecting the lithosphere involves the resorption of oceanic lithosphere plates at destructive margins, which results in subduction. This is thought to be due to old, cold oceanic basalts undergoing metamorphism as pressure increases during subduction. They are transformed at depth to a mineral assemblage (eclogite) that is denser (3.4 to 3.5 t m-3) than the enveloping upper mantle. That density contrast is sufficient for gravity to pull slabs of oceanic lithosphere downwards. This slab-pull force is transmitted through oceanic lithosphere that remains at the surface to become the dominant driver of modern plate tectonics. As a result, extension of the surface oceanic lithosphere at constructive margins draws mantle upwards to partially melt at reduced pressure, thus adding new basaltic crust at mid-ocean rift systems to maintain a form of mantle convection. Seismic tomography shows that active subducted slabs become ductile about 660 km beneath the surface and below that no earthquakes are detected. Quite possibly, the density of the reconstituted lithospheric slab becomes less than that of the mantle below the 660 km discontinuity. So the subducted slab continues by moving sideways and buckling in response to the ‘push’ from its rigid upper parts above. But it has been suggested that some subducted slabs do finally sink to the core-mantle boundary, but that is somewhat conjectural.

Typical banded iron formation

There are sedimentary rocks whose density at the surface exceeds that of the upper mantle: banded iron formations (BIFs) that contain up to 60% iron oxides (mainly Fe2O3) and have an average density at the surface of around 3.5 t m-3. BIFs formed mainly in the late Archaean and early Proterozoic Eons  (3.2 to 1.0 Ga) and none are known from the last 400 Ma. They formed when soluble iron-2 (Fe2+) – being added to ocean water by submarine hydrothermal activity –was precipitated as Fe3+ in the form of iron oxide (Fe2O3) where oxygen was present in ocean water. With little doubt this happened only in shallow marine basins where cyanobacteria that appeared about 3.5 Ga ago had sufficient sunlight to photosynthesise. Until about 2.4 Ga the atmosphere and thus the bulk of ocean water contained very little oxygen so the oceans were pervaded by soluble iron so that BIFs were able to form wherever such biological activity was going on. Conceivably (but not proven), that BIF-forming biochemical reaction may even have operated far from land in ocean surface water, slowly to deposit Fe2O3 on the deep ocean floor. After 2.4 Ga oxygen began to build in the atmosphere after the Great Oxidation Event had begon. That time was also when the greatest production of BIFs took place. Strangely, the amount of BIF in the geological record fell during the next 600 Ma to rise again to a very high peak at 1.8 Ga. Since there must have been sufficient soluble iron and an increasing amount of available oxygen for BIFs to form throughout that ‘lean’ period the drop in BIF formation is paradoxical. After 1.0 Ga BIFs more or less disappear. By then so much oxygen was present in the atmosphere and from top to bottom in ocean water that soluble iron was mostly precipitated at its hydrothermal source on the ocean floor. Incidentally, modern ocean surface water far from land contains so little dissolved iron that little microbiological activity goes on there: iron is an essential nutrient so the surface waters of remote oceans are effectively ‘wet deserts’.

Plots of probability of LIPs and BIFs forming at the Earth’s surface during Precambrian times, based on actual occurrences (Credit: Keller, et al., modified Fig 1A)

Spurred by the fact that if a sea-floor slab dominated by BIFs was subducted it wouldn’t need eclogite formation to sink into the mantle, Duncan Keller of Rice University in Texas and other US and Canadian colleagues have published a ‘thought experiment’ using time-series data on LIPs and BIFs compiled by other geoscientists (Keller, D.S. et al. 2023. Links between large igneous province volcanism and subducted iron formations. Nature Geoscience, v. 16, article; DOI: 10.1038/s41561-023-01188-1.). Their approach involves comparing the occurrences of 54 BIFs through time with signs of activity in the mantle during the Palaeo- and Mesoproterozoic Eras, as marked by large igneous provinces (LIPs) during that time span. To do this they calculated the degree of correlation in time between BIFs and LIPs. The authors chose a minimum area for LIPs of 400 thousand km2 – giving a total of 66 well-dated examples. Because the bulk of Precambrian flood-basalt provinces, such as occurred during the Phanerozoic, have been eroded away, most of their examples are huge, well-dated dyke swarms that almost certainly fed such plateau basalts. Rather than a direct time-correlation, what emerged was a match-up that covered 74% of the LIPs with BIFs that had formed about 241 Ma earlier. They also found a less precise correlation between LIPs associated with 241 Ma older BIFs and protracted periods of stable geomagnetic field, known as ‘superchrons’. These are thought by geophysicists to be influenced by heat flow through the core-mantle boundary (CMB).

The high bulk density of BIFs at the surface would be likely to remain about 15 % greater than that of peridotite as pressure increased with depth in the mantle. Such slabs could therefore penetrate the 660 mantle discontinuity. Their subduction would probably result in their eventually ‘piling up’ in the vicinity of the CMB. The high iron content of BIFs may also have changed the way that the core loses heat, thereby triggering mantle plumes. Certainly, there is a complex zone of ultra-low seismic velocities (ULVZ) that signifies hot, ductile material extending above the CMB. Because BIFs’ high iron-content makes them thermally highly conductive compared with basalts and other sediments, they may be responsible. Clearly, Keller et al’s hypothesis is likely to be controversial and they hope that other geoscientists will test it with new or re-analysed geophysical data. But the possibility of BIFs falling to the base of the mantle spectacularly extends the influence of surface biological processes to the entire planet. And, indeed, it may have shaped the later part of its tectonic history having changed the composition of the deep mantle. The interconnectedness of the Earth system also demands that the consequences – plumes and large igneous provinces – would have fed back to the Precambrian biosphere. See also: Iron-rich rocks unlock new insights into Earth’s planetary history, Science Daily, 2 June 2023

The Earth System in action: land plants affected composition of continental crust

The essence of the Earth System is that all processes upon, above and beneath the surface interact in a bewildering set of connections. Matter and energy in all their forms are continually being exchanged, deployed and moved through complex cycles: involving rocks and sediments; water in its various forms; gases in the atmosphere; magmas; moving tectonic plates and much else besides. The central and massively dominant role of plate tectonics connects surface processes with those of our planet’s interior: the lithosphere, mantle and, arguably, the core. Interactions between the Earth System’s components impose changes in the dynamics and chemical processes through which it operates. Living processes have been a part of this for at least 3.5 billion years ago, in part through their role in the carbon cycle and thus the Earth’s climatic evolution. During the Silurian Period life became a pervasive component of the continental surface, first in the form of plants, to be followed by animals during the Devonian Period. Those novel changes have remained in place since about 430 Ma ago, plants being the dominant base of continental ecosystems and food chains.

Schematic diagram showing changes in river systems and their alluvium before and after the development of land plants. (Credit: Based on Spencer et al. 2022, Fig 4)

Land plants exude a variety of chemicals from their roots that break down rock to yield nutrient elements. So they play a dominant role in the formation of soil and are an important means of rock weathering and the production of clay minerals from igneous and metamorphic minerals. Plant root systems bind near-surface sediments thus increasing their resistance to erosion by wind and water, and to mass movement under gravity. This binding and plant canopies efficiently reduce dust transport, slow water flow on slopes and decrease the sediment load of flowing water. Plants and their roots also stabilise channels systems. There is much evidence that before the Devonian most rivers comprised continually migrating braided channels in which mainly coarse sands and gravels were rapidly deposited while silts and muds in suspension were shifted to the sea. Thereafter flow became dominated by larger and fewer channels meandering across wide tracts on which fine sediment could accumulate as alluvium on flood plains when channels broke their banks. Land plants more efficiently extract CO2 from the atmosphere through photosynthesis and the new regime of floodplains could store dead plant debris in the muds and also in thick peat deposits. As a result, greenhouse warming had dwindled by the Carboniferous, encouraging global cooling and glaciation. 

Judging the wider influence of the ‘greening of the land’ on other parts of the Earth system, particularly those that depend on internal  magmatic processes, relies on detecting geochemical changes in minerals formed as direct outcomes of plate tectonics. Christopher Spencer of Queen’s University in Kingston, Canada and co-workers at the Universities of Southampton, Cambridge and Aberdeen in the UK, and the China University of Geosciences in Wuhan set out to find and assess such a geochemical signal (Spencer, C., Davies, N., Gernon, T. et al. 2022. Composition of continental crust altered by the emergence of land plants. Nature Geoscience, v. 15 online publication; DOI: 10.1038/s41561-022-00995-2). Achieving that required analyses of a common mineral formed when magmas crystallise: one that can be precisely dated, contains diverse trace elements and whose chemistry remains little changed by later geological events. Readers of Earth-logs might have guessed that would be zircon (ZrSiO). Being chemically unreactive and hard, small zircon grains resist weathering and the abrasion of transport to become common minor minerals in sediments. Thousands of detrital zircon grains teased out from sediments have been dated and analysed in the last few decades. They span almost the entirety of geological history. Spencer et al. compiled a database of over 5,000 zircon analyses from igneous rocks formed at subduction zones over the last 720 Ma, from 183 publications by a variety of laboratories.

The approach considered two measures: the varying percentages of mudrocks in continental sedimentary sequences since 600 Ma ago; aspects of the hafnium- (Hf) and oxygen-isotope proportions measured in the zircons using mass spectrometry and their changes over the same time. Before ~430 Ma the proportion of mudrocks in continental sedimentary sequences is consistently much lower than it is in post post-Silurian, suggesting a link with the rise of continental plant cover (see second paragraph). The deviation of the 176Hf/177Hf ratio in an igneous mineral from that of chondritic meteorites (the mineral’s εHf value) is a guide to the source of the magma, negative values indicating a crustal source, whereas positive values suggest a mantle origin. The relative proportions of two oxygen isotopes 18O and 16O  in zircons, expressed as δ18O, indicates the proportion of products of weathering, such as clay minerals, involved in magma production – 18O selectively moves from groundwater to clay minerals when they form, increasing their δ18O.

While the two geochemical parameters express very different geological processes, the authors noticed that before ~430 Ma the two showed low correlation between their values in zircons. Yet, surprisingly, the parameters showed a considerable and consistent increase in their correlation in younger zircons, directly paralleling the ‘step change’ in the proportions of mudstones after the Silurian. Complex as their arguments are, based on several statistical tests, Spencer et al. conclude that the geologically sudden change in zircon geochemistry ultimately stems from land plants’ stabilisation of river systems. As a result more clay minerals formed by protracted weathering, increasing the δ18O in soils when they were eroded and transported. When the resulting marine mudrocks were subducted they transferred their oxygen-isotope proportions to magmas when they were partially melted.

That bolsters the case for dramatic geological consequences of the ‘greening of the land’. But did its effect on arc magmatism fundamentally change the bulk composition of post-Silurian additions to the continental crust? To be convinced of that I would like to see if other geochemical parameters in subduction-related magmas changed after 430 Ma. Many other elements and isotopes in broadly granitic rocks have been monitored since the emergence of high-precision rock-analysing technologies around 50 years ago. There has been no mention, to my knowledge, that the late-Silurian involved a magmatic game-changer to match that which occurred in the Archaean, also revealed by hafnium and oxygen isotopes in much more ancient zircons.   

See also: https://www.sci.news/othersciences/geoscience/land-plants-continental-crust-composition-11151.htmlhttps://www.eurekalert.org/news-releases/963296

Stepping Stones eBook

Title

A revised and updated edition of Stepping Stones: The Making of Our Home World by Steve Drury, first published in 1999, has been released as a free eBook on the book’s web site https://earthstep.wordpress.com/. The revision incorporates the hundreds of commentaries on geoscientific advances written since 2000 by Steve for earth-pages. It is a personal view of the evolution of the Earth System and the emergence of humanity from it. First published by Oxford University Press, Stepping Stones was widely acclaimed by  fellow Earth scientists and general readers.

Subduction and the water cycle

Note: Earth-Pages will be closing as of early July, but will continue in another form at Earth-logs

For many geoscientists and lay people the water cycle is considered to be part of the Earth’s surface system. That is, the cycle of evapotranspiration, precipitation and infiltration involving atmosphere, oceans, cryosphere, terrestrial hydrology and groundwater. Yet it links to the mantle through subduction of hydrated oceanic lithosphere and volcanism. The rate at which water vapour re-enters the surface part of the water cycle through volcanoes is reasonably well understood, but the same cannot be said about ‘recharge’ of the mantle through subduction.

Water cycle http://ga.water.usgs.gov/edu/water...
The water cycle as visualised by the US Geological Survey (credit: Wikipedia)

Subducted oceanic crust is old, cold and wet: fundamentals of plate theory. The slab-pull that largely drives plate tectonics results from phase transitions in oceanic crust that are part and parcel of low-temperature – high-pressure metamorphism. They involve the growth of the anhydrous minerals garnet and high-pressure pyroxene that constitute eclogite, the dense form taken by basalt that causes the density of subducted lithosphere to exceed that of mantle peridotite and so to sink. This transformation drives water out of subducted lithosphere into the mantle wedge overlying a subduction zone, where it encourages partial melting to produce volatile-rich andesitic basalt magma – the primary magma of island- and continental-arc igneous activity. Thus, most water that does reenter the mantle probably resides in the ultramafic lithospheric mantle in the form of hydrated olivine, i.e. the mineral serpentine, and that is hard to judge.

Water probably gets into the mantle lithosphere when the lithosphere bends to begin its descent. That is believed to involve faults – cold lithosphere is brittle – down which water can diffuse to hydrate ultramafic rocks. So the amount of water probably depends on the number of such bend-related faults. A way of assessing the degree of such faulting and thus the proportion of serpentinite is analysis of seismic records from subduction zones. This has been done from earthquake records from the West Pacific subduction zone descending beneath northern Japan (Garth, T. & Rietbrock, A. 2014. Order of magnitude increase in subducted H2O due to hydrated normal faults within the Wadati-Bennioff zone. Geology, on-line publication doi:10.1130/G34730.1). The results suggest that between 17 to 31% of the subducted mantle there has been serpentinised.

In a million years each kilometre along the length of this subduction zone would therefore transfer between 170 to 318 billion tonnes of water into the mantle; an estimate more than ten times previous estimates. The authors observe that at such a rate a subduction zone equivalent to the existing, 3400 km long Kuril and Izu-Bonin arcs that affect Japan would have transferred sufficient water to fill the present world oceans 3.5 times over the history of the Earth. Had the entire rate of modern subduction along a length of 55 thousand kilometres been maintained over 4.5 billion years, the world’s oceans would have been recycled through the mantle once every 80 million years. To put that in perspective, since the Cretaceous Chalk of southern England began to be deposited, the entire mass of ocean water has been renewed. Moreover, subduction has probably slowed considerably through time, so the transfer of water would have been at a greater pace in the more distant past.

Enhanced by Zemanta