Stonehenge: the geologists’ last word?

A sunset at Stonehenge

The great megalithic structure is the centrepiece of a vast ritual landscape on a 780 km2 plateau known as Salisbury Plain, underpinned by Cretaceous limestone: the largest remaining area of calcareous grassland in northwest Europe. The earliest sign that the Plain was used for ritual purposes dates to ten thousand years ago (8,000 BCE), when Mesolithic hunter gatherers erected large wooden posts to define by an E-W line the Sun’s rise and setting at the equinoxes. The area seems to have been continuously populated until 4,000 BCE when the first Neolithic farmers settled the Plain and began building burial mounds (barrows) to celebrate notable individuals and families.

The Stonehenge monument began as a circular cemetery around 3,100 BCE. Its development to the astonishing structure that remains largely intact today occupied the Neolithic populace and succeeding Bronze Age immigrants for the next 1,600 years. This involved setting up and then repeatedly shuffling around several kinds of boulders or megaliths. The first, around 2,600 BCE, were 2 to 3 tonne blocks mainly of igneous rock (the ‘bluestones’), now known to have originated from outcrops of Ordovician volcanics in Pembrokeshire about 230 km to the west. Next to arrive was a 6 tonne grey-green sandstone slab, now lying flat (hence its being named the ‘Altar’ Stone) beneath a fallen, far bigger megalith,. Once thought to be of Welsh provenance – in the Brecon Beacons 150 km to the west – the Altar Stone is now beyond a shadow of doubt to have come from Devonian strata in northern Scotland, possibly Orkney. The final erection of 30 truly enormous ‘sarsens’ to create Stonehenge’s signature circle and inner ‘horseshoe’ of vertical slabs capped by lintels took place between 2,600 to2 400 BCE. Weighing up to 50 tonnes, the sarsens are locally derived from remnants of Lower Eocene (~55 Ma) sands cemented by chemically precipitated silica (SiO2) that once covered much of southern England.

After 1,600 BCE, serious fiddling with the various stones, the bluestones in particular, ceased. The monument may have remained in some form of use during the Iron Age: it could hardly have been ignored. The first record of antiquarian interest is from the late 17th century and continued sporadically until systematic excavation of archaeological features on the Plain got underway during the 19th century and continues to the present.

Much recent literature has concentrated on what Stonehenge was for and how it was built, leading to a rich eclecticism and a little experimentation. But given the size of its stones and the obviously exotic nature of some of them, there have been disputes between those who consider them to have been brought by natural means and those who suggest collective human endeavour. The latter would have involved vast amounts of labour, shifting the bluestones over 250 km, entire community muscle power to drag the locally occurring sarsens about 25 km from their probable source, and a journey of at least 700 km to get the Altar Stone in place. Since none of the stones could conceivably have been moved by river flow, the only natural alternative for their transport is by glacial action.

Such an ice-transport theory rests on at least one of the several known advances of Pleistocene ice sheets having reached as far south as Salisbury Plain and deposited upon it glacial till that contains material from NE Scotland and South Wales. The most obvious indicators of glacial transport are large erratic boulders strewn far from their source down a previous ice stream that their distribution helps to reconstruct. In Northern Britain a great many megaliths that people erected long ago are glacial erratics of one kind or another. Of course, glacial tills contain grains of all sizes ripped and ground from the course of glacial flow. No so obvious, but equally capable of revealing transportation paths. After ice sheets melt, the till that they dump is eroded so that exotic rock and mineral grains enter drainage systems, some to remain in stream sediments. Two geologists based at Curtin University in Perth, Western Australia collected river sands from four active drainage systems on Salisbury Plain to test the glacial-transport hypothesis for the Stonehenge megaliths (Clarke, A.J.I. & Kirkland, C.L. 2026. Detrital zircon–apatite fingerprinting challenges glacial transport of Stonehenge’s megaliths. Communications Earth & Environment, v. 7, article 54; DOI: 10.1038/s43247-025-03105-3).

Using standard mineral-separation techniques – removal of low-density minerals (mainly quartz and feldspar) and those that are magnetic – Anthony Clarke and Christopher Kirkland mounted and polished samples of the remaining high-density grains embedded in resin. Using automated X-ray spectroscopy they identified grains of two minerals, zircon and apatite, that can be dated using uranium and lead isotopes. Zircons are virtually absent from the underlying Chalk although phosphorus-rich horizons in that rock sometimes contain apatite, a complex calcium phosphate. Both minerals are commonly found in igneous and metamorphic rocks and, being chemically resistant and hard, are often present in sediments derived by erosion of such parent rocks. The authors analysed U-Pb isotopes using laser ablation plasma mass spectrometry of suitable grains of each mineral. The U-Pb data from 250 apatite grains revealed a dominant age peak at 60 Ma, roughly the base of the once overlying Palaeogene sediments. Far fewer grains hint at older ages (175, 215, 300 and 625 Ma) in the Mesozoic, Palaeozoic and Neoproterozoic. The 550 analysed zircons span an age range from the Silurian to Palaeoproterozoic (432 to 1870 Ma), with a few outliers as young as 285 Ma and as old as 3396 Ma.

These data seem to suggest that they can support virtually any glacial transport hypothesis, including that of the Altar Stone, let alone the Stonehenge bluestones. However, that would be to misunderstand the complexity of sediment transport in relation to their original provenance. Erosion from a bedrock source leads to transport and deposition in sedimentary rock. Later uplift and erosion of that secondary host rock is followed by later sediment transport to another rock repository and so on and so forth through the entire geological history of Britain, across  its jumble of many tectonic terranes and the effects of numerous orogenic episodes! The Salisbury Plain chalk lands were covered by Palaeogene sedimentary rocks of the London Basin. And, lo and behold, one of those younger sediments, the Thanet Formation sandstones, tell much the same U-Pb story as do the modern river sediments of Salisbury! Those Palaeocene sands elsewhere directly overlie the Chalk and, in some localities on Salisbury Plain, still do today in the form of the chemically cemented sarsens. About 50 Ma ago (early Eocene) the Palaeocene rocks and those beneath were broadly buckled by the outermost ripples of the Alpine orogeny. Once eroded from above the Plain they would certainly have delivered that signature to the mercy of subsequent back and forth river transport. And indeed the sarsens, hard to miss in that landscape, perhaps still do so. Yet no one has thought to examine their content of heavy-mineral grains.

It does seem to me that the authors, perhaps inadvertently, walked into a sedimentological minefield in a vain attempt to put the lid on the fractious debate about human- versus glacial-transport of the Stonehenge megaliths. It is not their data that fling down a ‘challenge’ to the latter hypothesis (see their Conclusions), but the widely accepted absence of even the tiniest nugget of bluestone or Devonian sandstone on the vast and heavily excavated ritual landscape of Salisbury Plain, or indeed in the gravels of the streams that currently drain the Plain. But this where the plot thickens. A recent paper by one of the proponents of the glacial hypothesis (John, B.S. 2024. A bluestone boulder at Stonehenge: implications for the glacial transport theory. E&G Quaternary Science Journal v. 73, p. 117-134;DOI: 10.5194/egqsj-73-117-2024) describes a small piece of bluestone (22 × 15 × 10 cm) that was found during excavations at Stonehenge in 1924 and mysteriously ‘rescued’ by a Robert Newall and stored in his attic for almost 50 years, eventually examined by geologists and then returned to the attic. In 1976, two years before his death Newall passed it to the curator of Salisbury Museum ‘for safe keeping’. Brian John claims that its shape and surface texture suggests glacial transport. It also has several percussion scars suggesting that it had been worked, perhaps by someone hoping to make a stone tool. Unsurprisingly, Johns succeeded in provoking a storm of criticism from archaeologists largely of the human-transport wing of the controversy. And then there is the Mumbles Erratic, found at the eponymous Mumbles headland to the west of Swansea Bay. It too looks like a ‘bluestone’, but is it an erratic or from a Neolithic ship wreck carrying bluestones from Pembrokeshire?

Maximum extent of glaciation in SW Britain during the Anglian Stage 478 to 424 ka ago (Credit: Wikipedia Commons)

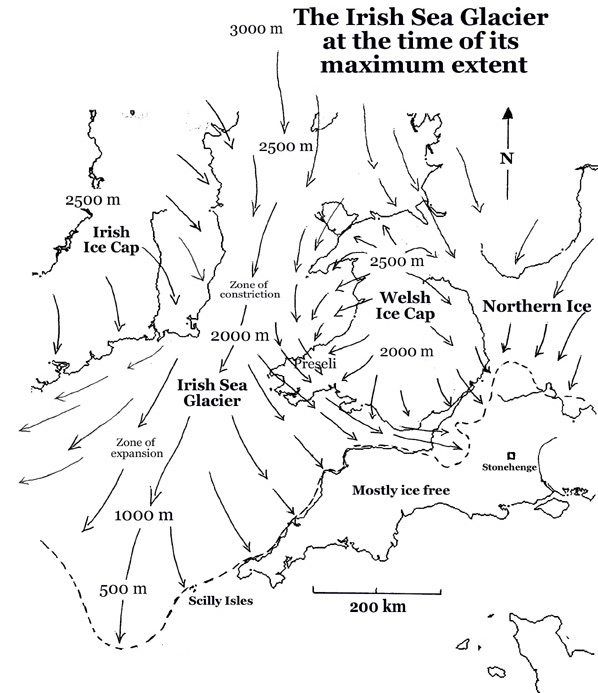
A great deal of work by British glaciologists has established the flow patterns and extent of major ice sheets, but only for four onshore, even though there is offshore evidence for repeated glaciation back as far as 2.5 Ma ago. The most extensive of these was the Anglian Stage between 478 and 424 ka ago. The figure above shows that the Irish Sea Glacier did not reach the Stonehenge area, but it did cross Pembrokeshire to reach Somerset on the eastern side of the Bristol Channel. Bluestone erratics may have been much more easily available than blocks hewn at their source in SW Wales, an hypothesis that is currently in vogue. Nope, the quest is not over …

How vulnerable are coastal zones to sea-level rise?

These days only a fool or a scoundrel would deny anthropogenic global warming and its primary outcome of inevitable sea-level rise. Yet no agency, either national or international, has set out to attempt a detailed global assessment of coastal vulnerability. There is no shortage of relevant data to do that – from remote sensing, digital elevation models, simulations of tides and wave height from meteorological data and much else. Thankfully, a team of geomorphologists, climate scientists, sociologists and economists from The Netherlands and France, led by Vindhya Basnayake of the University of Twente, The Netherlands, have taken up the challenge (Basnayake, V. et al. 2026. A global assessment of coastal vulnerability and dominant contributors. Nature Communications, in-press manuscript; DOI: 10.1038/s41467-025-67275-6).

About 10% of the world’s population – a bit less than a billion – live in coastal zones at less than 10 m elevation above mean sea level, and two-fifths that may bear the brunt of future rise. Coastal flooding and erosion threaten landforms, ecosystems and built infrastructure. Both physical effects of sea-level rise potentially may disrupt population centres, livelihoods and marine and coastal industries. More frequent and severe storms driven by global warming are also expected to increase the frequency and intensity of coastal hazards over time. Basnayake  et al. have developed a Coastal Vulnerability Index (CVI) to express the hazard presented by future flooding and erosion to all coastal areas. The CVI is based on geomorphology, geology, coastal slope, coastal relief, wave height, and relative sea level change. It also integrates the local adaptive capacity and community resilience from socioeconomic and geopolitical data. Importantly CVI values are calculated at 1 km intervals along the global coastline at over 350 thousand locations. The approach used by the team incorporates from previous analyses time series for wave and tide heights and for changing sediment supply. The fine spatial resolution of data allows for identification of critical micro-regions – even within generally less vulnerable countries. Such a nuanced approach shows up the complexity of coastal risk that one-size-fits-all approaches are destined to miss.

Steep coastal slopes are less vulnerable than gentle ones, which allow greater penetration by marine hazards. The more rugged coastal terrain, the less vulnerable the coast is by acting like a large scale breakwater. Mean wave height controls the energy impinging on a coast, and is affected by wave ‘fetch’, so that ocean-facing coasts are more vulnerable than more enclosed locations. Offshore seismicity, as in island arcs, increases vulnerability to tsunamis. Tidal range has a counterintuitive effect, large ranges reducing the time a coast is in direct contact with the sea, whereas low ranges place the sea next to land for much longer. Although global sea level is destined to rise uniformly, some coasts are rising through tectonic or glacio-eustatic uplift, while others are actively subsiding; so relative sea-level change is used to address vulnerability. Other considerations assessed by Basnayake  et al. are subsidence due to coastal groundwater extraction, the presence of protective coastal vegetation such as mangroves, and the influence of deltas and estuaries.

Coastal vulnerability by country: dark blue – very low; green – low; yellow – moderate; orange – high; dark red – very high. (Credit: Basnayake et al. Fig 2a)

The figure above summarises the results of the CVI study on a country-by-country basis. Eurasia is surprisingly the least vulnerable continent in this respect, especially Britain and Norway that are so exposed to the fierce North Atlantic. That is partly due to those countries high adaptive capacity and communal resilience, but mainly to their rugged and deeply indented western coasts; a legacy of glaciation. It’s important to note that coloration on the figure can be misleading. For instance, the higher resolution data pinpoint extremely high vulnerability of stretches of coast dominated by low-lying deltas, such as those of Pakistan, India, Myanmar and SE Asia. Equally surprising is the high vulnerability of North America at similar latitudes; somewhat ironic for the heartland of climate-change denial. High resolution also points to counterintuitive hazards; for instance coastal defences sometimes exacerbate vulnerability by increasing erosion on nearby undefended stretches and by hindering sediment movement. Increased onshore infrastructure boosts runoff and erosion in the coastal realm and displaces natural buffers, such as coastal forest, to storm surges: perhaps partly responsible for the high vulnerability of coasts around the hurricane belt of the Gulf of Mexico and Caribbean. Of the nineteen countries with greatest vulnerability 12 are in West Africa and NE South America and 2 in the Caribbean area. The paper is well worth reading, to get a flavour of the complexity involved and the vast magnitude of the task of ameliorating risk of coastal devastation that lies ahead in the next decades.

See especially: Global Coastal Vulnerability: Key Causes Revealed. Scienmag, 14 January 2026.

The effect of surface processes on tectonics

Active sedimentation in the Indus and Upper Ganges plains (green vegetated) derived from rapid erosion of the Himalaya (credit: Google Earth)

The Proterozoic Eon of the Precambrian is subdivided into the Palaeo-, Meso- and Neoproterozoic Eras that are, respectively, 900, 600 and 450 Ma long. The degree to which geoscientists are sufficiently interested in rocks within such time spans is roughly proportional to the number of publications whose title includes their name. Searching the ISI Web of Knowledge using this parameter yields 2000, 840 and 2700 hits in the last two complete decades, that is 2.2, 1.4 and 6.0 hits per million years, respectively. Clearly there is less interest in the early part of the Proterozoic. Perhaps that is due to there being smaller areas over which they are exposed, or maybe simply because what those rocks show is inherently less interesting than those of the Neoproterozoic. The Neoproterozoic is stuffed with fascinating topics: the appearance of large-bodied life forms; three Snowball Earth episodes; and a great deal of tectonic activity, including the Pan-African orogeny. The time that precedes it isn’t so gripping: it is widely known as the ‘boring billion’ – coined by the late Martin Brazier – from about 1.75 to 0.75 Ga. The Palaeoproterozoic draws attention by encompassing the ‘Great Oxygenation Event’ around 2.4 Ga, the massive deposition of banded iron formations up to 1.8 Ga, its own Snowball Earth, emergence of the eukaryotes and several orogenies. The Mesoproterozoic witnesses one orogeny, the formation of a supercontinent (Rodinia) and even has its own petroleum potential (93 billion barrels in place in Australia’s Beetaloo Basin. So it does have its high points, but not a lot. Although data are more scanty than for the Phanerozoic Eon, during the Mesoproterozoic the Earth’s magnetic field was much steadier than in later times. That suggests that motions in the core were in a ‘steady state’, and possibly in the mantle as well. The latter is borne out by the lower pace of tectonics in the Mesoproterozoic. Continue reading “The effect of surface processes on tectonics”

Fish influence mountain ranges

When asked if he would like water in his whisky W.C Fields famously remarked that he didn’t drink water because fish procreate in it (his actual words were somewhat racier). Migratory salmon do so in their millions with a great deal of energy, specifically in the gravel beds of high-energy streams. Before spawning, females lash the stream bed with their tails to create a pit or redd in the gravel, in which they lay their eggs to be fertilised  by males. Then she fills-in the redd with more gravel excavated from upstream. Salmon spawning grounds are thus easily recognised as pale patches of freshly overturned gravel on a stream bed that also contain lower amounts of fine sediment and are thereby loosened. As well as discouraging bibulous old men from diluting their liquor, it occurred to Alexander Fremier of Washington State University and other American colleagues that here was a noteworthy example of an active part of the biosphere physically intervening in the rock cycle. Not that it comes even close to what humans have become capable of since the Industrial Revolution, but it might be an object lesson in the fragility of what are otherwise the robust processes of erosion. Moreover, since salmon emerged at some time in the past, their actions might help demonstrate that evolutionary events – speciation, adaptive radiations, mass extinctions etc – play a role in transforming geological processes.

Pacific salmon are semelparous or "big ba...
Pacific Sock-eye salmon that die shortly after spawning (credit: Wikipedia)

Fremier and colleagues (Fremier, A.K. et al. 2017. Sex that moves mountains: The influence of spawning fish on river profiles over geologic timescales. Geomorphology online publication; doi.org/10.1016/j.geomorph.2017.09.033) modeled the consequences of salmon spawning habits for the critical stress needed to set grains in motion, theoretically and in a flume tank. Based on a significant reduction of the critical stress, models for the evolution on various river profiles in the vicinity of salmon spawning grounds suggest that river beds may cut deeper at rates up to 30% faster than they would in the absence of salmon. Were salmon to be reduced or extirpated through dam construction or overfishing then sedimentation in channels would increase. In some areas of extensive farming of salmon in offshore pens, escape and colonization of rivers would eventually change sedimentation and erosion patterns. The findings vary from species to species, but salmon may have had a significant effect on generally rugged landscapes following their appearance in local ecosystems.

The terrestrial-marine-terrestrial migratory habits of salmon, including the return of adults to their birth rivers to spawn, are uncommon if not unique. Their forbears must have evolved to this behaviour at some time in the geological past, separately in the case of North Atlantic and North Pacific species. The authors suggest that adaptive radiation of salmon may have been favoured by orogenic events in western North America around 100 Ma ago that created the system of fast flowing rivers that salmon favour. In turn, salmon may have significantly influenced Western Cordillera landscapes of Alaska, Canada and the conterminous Unites States. A nice example of the inseparability of cause and effect on the scale of the Earth System.

Explosive erosion in the Himalaya

As the Yalung-Tsangpo River on the northern flank of the Himalaya approaches  a bend the rotates its flow by almost 180 degrees to become the Brahmaputra it enters one of the world’s largest canyons. Over the 200 km length of the Tsangpo Gorge the river descends two kilometres between peaks that tower 7 km above sea level. Since the area is rising tectonically and as a result of the unloading that attends erosion, for the Tsangpo to have maintained its eastward flow it has been suggested that an average erosion rate of 3 to 5 km per million years was maintained continuously over the last 3 to 5 Ma. However, new information from the sediments downstream of the gorge suggests that much of the gorge’s depth was cut during a series of sudden episodes (Lang, K.A. et al. 2013. Erosion of the Tsangpo Gorge by megafloods, Eastern Himalaya. Geology, v. 41, p. 1003-1006).

English: Map of the Yarlung Tsangpo River wate...
The Yarlung Tsangpo River watershed which drains the north slope of the Himalayas. (credit: Wikipedia)

It has become clear from a series of mountainside terraces that during the Pleistocene glaciers and debris from them often blocked the narrow valleys through which the river flowed along the northern flank of the Himalaya. Each blockage would have impounded enormous lakes upstream of the Tsangpo Gorge, containing up to 800 km3 of water. Failure of the natural dams would have unleashed equally spectacular floods. The researchers from the University of Washington in Seattle examined the valley downstream of the gorge, to find unconsolidated sediments as much as 150 m above the present channel. They have similar grain size distributions to flood deposits laid down some 30 m above the channel by a flood unleashed in 2000 by the failure of a temporary dam caused by a landslide. The difference is that the higher level deposits are densely vegetated and have well-developed soils: they are almost certainly relics of far larger floods in the distant past from the lakes betrayed by the terraces above the Tsangpo Gorge.

By measuring the age of zircons found in the megaflood deposits using the U/Pb methods the team  have been able to show that the sediments were derived mainly from 500 Ma crystalline basement in the Tsangpo Gorge itself rather than from the younger terranes in Tibet. There are four such deposits at separate elevations above the modern river below the gorge. Like the 2000 AD flood deposit, each terrace is capped by landslide debris suggesting that flooding and associated erosion destabilised the steep slopes so characteristic of the region. Because the valleys are so narrow (<200 m at the bottom), each flood would have been extremely deep, flows being of the order of a million cubic metres per second. The huge power would have been capable of moving blocks up to 18 m across with 1 m boulders being carried in suspension. It has been estimated that each of the floods would have been capable of removing material that would otherwise have taken up to 4000 years to erode at present rates of flow.

Grand Canyon now the Grand Old Canyon?

Grand Canyon in Winter
Grand Canyon in Winter (credit: Wikipedia)

Among the best known and certainly the most visited topographic feature on the planet, the Grand Canyon resulted from erosion by the Colorado River keeping pace with uplift of the south-central United States. It is the archetype for what is known as antecedent drainage. Since that uplift is still going on, albeit slowly, the Grand Canyon has been assumed to be a relative young landform. By dating the first appearance of debris from the eastern end of the canyon in sediments at its western limit geomorphologists estimated that incision began around 6 Ma ago. Yet a range of other observations present puzzling contradictions. One means of settling the issue is to somehow to date the uplift radiometrically.

A long-used technique is to determine ‘cooling ages’ of crustal rocks exposed by uplift and erosion, exploiting the way in which rock temperature determines whether or not products of radioactive decay cab be preserved intact. One method uses the tracks of defects produced by electrons or helium nuclei from radioactive decay as they pass through various minerals that incorporate high amounts of elements such as uranium. Above a certain temperature the fission tracks anneal and disappear quickly, while below it they accumulate over time. Quantifying that build-up allows the date of cooling below the threshold temperature to be estimated. Similarly, gases produced by radioactive decay of some radioactive isotopes, such as argon from the decay of 40K or helium from uranium and thorium isotopes, can only stay in their host mineral if it remains cooler than a narrow range of temperatures. As rock rises towards the Earth’s surface, it starts out hot at depth but cools by conduction as it get closer to the surface. For the 1.8 km of uplift of the Grand Canyon and the relatively cool nature of the underlying crust, neither the fission-track nor the  40Ar/39Ar cooling-age methods give meaningful results. However, minerals lose helium at temperatures above about 70°C, so a method based on helium accumulation from uranium and thorium isotope decay is a possible means of assessing uplift timing. But there have been plenty of snags to overcome to make this approach reliable. In the case of the Grand Canyon analytical quality and careful sample collection has given a credible result (Flowers, R.M. & Farley, K.A. 2012. Apatite 4He/3He and (U-Th)He evidence for an ancient Grand Canyon. Science , doi 10.1126/science.1229390)

Flowers and Farley from the University of Colorado at Boulder and the California Institute of Technology, Pasadena, respectively, produced a result that completely overturns previous conceptions. The western end of the Canyon had been incised to within a few hundred metres of modern depths by 70 Ma ago; more than ten times earlier than previously thought. The eastern end has a more complex history that reveals cooling events in the Neogene as well as an end-Cretaceous initiation of uplift and erosion. Their data are consistent with early incision of the Grand Canyon by a Cretaceous river flowing eastward from the Western Cordillera, with a reversal of flow in the late-Tertiary as uplift of the Colorado Plateau began and western mountains subsided. Whether or not this fits with Cretaceous and later geological history of the SW US, is beyond my ken, but you can bet there will be a storm of comment from US geomorphologists once the paper appears in the print issue of Science.