The risk of landslides in Africa

The most widespread risk from natural hazards is, with little doubt, that posed by ground instability; landslides and landslips; mudflows; rock avalanches and a range of other categories in which large volumes of surface material are set in motion. They can be triggered by earthquakes, volcanism or heavy rainfall that changes the physical properties of rock and soil. Not only steep slopes pose a risk, for some affect ground with quite gentle topography, as witness the terrible scenes from Sulawesi triggered by the 28 September 2018 magnitude 7.5 earthquake beneath the Minhasa Peninsula. This set in motion mudflows on gently sloping ground when the seismic waves caused liquefaction of unconsolidated sediments that not only shattered dwellings by the lateral motion, but whole communities sank into the slurry with little trace. The rapid events left a death toll confirmed at 2010 people with about 5000 missing, feared to have been swallowed by the earth. In the last 9 months mass movement has resulted in fatalities in many places, the most publicised being in Uganda, Japan, Philippines, Sulawesi, Ethiopia, Sumatra, South India, Bangladesh, California, Nepal, and the list grows as it does every year.

407458aa.2
Types of mass movement (Credit: US Geological Survey

As well as purely natural causes, human activities, such as deforestation, excavations and dumping of materials, greatly exacerbate risks. The South Wales former coal-mining communities commemorate every year the collapse of a mine spoil heap on a steep hillside on 21 October 1966 that engulfed a primary school at Aberfan, killing 116 small children and 28 adults. Wherever they occur, there seems to be little chance of escape for those in their path. Slowly it has become possible for geoscientists to outline areas that are potentially at risk from catastrophic mass wastage, sometimes from the distribution of scars of previous events on remotely sensed images, but increasingly by multivariate analysis of landscapes in terms of the factors that may contribute to future ground failures. The principal ones are: topographic slope and relief; annual rainfall, especially the likely precipitation in a single day; vegetation cover, particularly by trees; strength of surface rock and soils, including degrees of consolidation, interbedding and water content; geological structure, such as the trajectory of faults, degree of  jointing and the dip of strata. Modelling risk has to grapple with the global scale of the problem, which cannot be addressed in the least developed regions by piecemeal local studies, although those are urgent, of course, in areas with recorded instances of catastrophic ground failure. Regional studies can screen vast areas of probably low risk so that meagre resources can focus on those that appear to be most dangerous to populated places.

afr landslide
Degree of risk from landslides of all types in the northern part of the East African Rift System (Credit: Broeckx et al. 2018; Fig. 6)

Belgian engineering geologists and GIS specialists have assembled a monumental risk assessment of Africa, together with a bibliography of all published work on mass movement across the continent (Broeckx, J. et al. 2018. A data-based landslide susceptibility map of Africa. Earth-Science Reviews, v. 185, p. 102-121; DOI: 10.1016/j.earscirev.2018.05.002). They point out that Google Earth’s 3-D viewing potential at fine spatial resolution provides a free and rapid means of mapping scars of previous earth movements in considerable detail over areas that data analysis suggests to be susceptible. Their paper provides continent-scale maps of the parameters that they used as well as maps showing several versions of their risk analysis. The supplementary data to the paper include downloadable, full-resolution maps of landslide susceptibility.

German global DEM now freely available

407458aa.2
TerraSAR-X and Tandem-X satellites fly close to each other some 500km above the Earth

In  2007 and 2010 two radar-imaging satellites were launched by the German space agency DLR, TerraSAR-X and Tandem-X respectively. After 2010 both orbited in close, side-by-side formation, sometimes as little as 200 m apart. With one acting as a both a transmitter and receiver of microwave pulses, the other as a receiver, this set up allowed the two signals returning from the Earth’s surface to be matched. The slightly different positions of the platforms results in a time difference at which a pulse reflected from a point on the Earth’s surface reaches the two receiving antennas. This difference varies according to the topographic elevation of the point – in effect analogous to the parallax shift captured in conventional stereoscopic images but measured by the interference between the two signals. Although involving far more complex computation, such radar interferometry produces estimates of each point’s elevation and ultimately a 3-dimensional image of the Earth’s surface. After a period of commercial operation, DLR has decided to make part of the data available free of charge. Both systems use microwaves with a wavelength of around 3 cm (9.65 GHz frequency), which allows topographic elevation to be measured to a precision of ±1 m. Using orbits that cross the poles, each at an angle to the Equator, allows swaths from the dual system eventually to cover the whole planet, in the manner of winding a ball of string. Eventually, the data will permit the detection of vertical movements of one kind or another when multiple coverage of the Earth becomes available. However, the expected lifetime of the platforms is limited, so DLR plans to launch two 23.6 cm interferometric radar satellites to assess dynamic processes occurring on the Earth’s surface.

407458aa.2
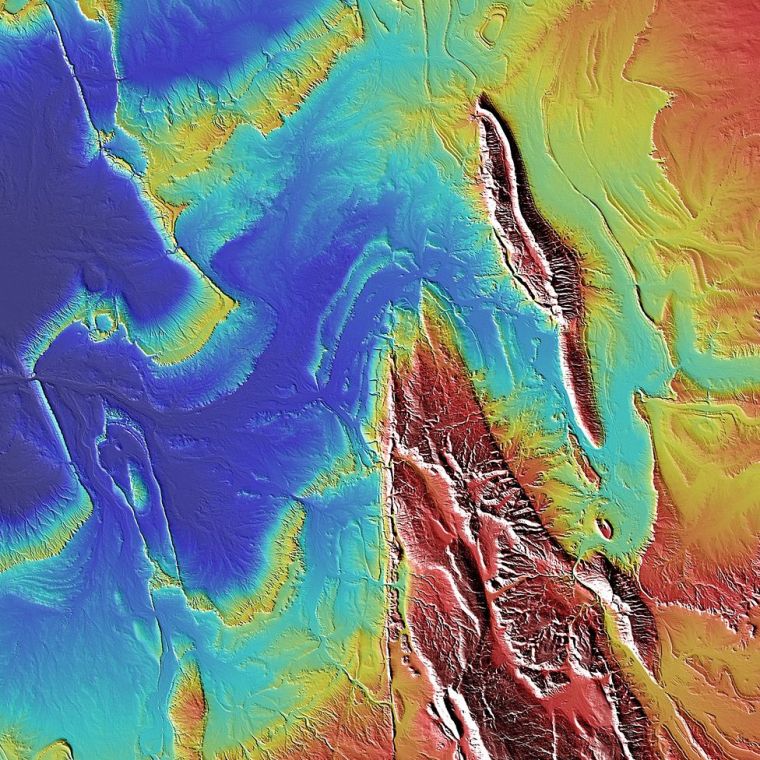
Side illuminated, colour-coded TanDEM-x elevation model of part of the Sahara desert, in the Tamanrasset province of central Algeria

The resolution of radar interferometry in the two dimensions of a map depends on many factors, some of which stem from the complex processing of the raw data. DLR global data is presented at three resolutions (pixel size): 12 m, the finest; 30 m and 90 m. For local acquisition even finer resolution is possible. Only the 90 m version is being released for free use. The first interferometric radar elevation data to be made freely available was from the NASA Shuttle Radar Topography Mission (SRTM) that was accomplished from the US Space Shuttle Endeavour in 2000, using a single instrument that incorporated two antennas separated by a 60 m long mast deployed from the Shuttle. SRTM acquired data only between latitudes 60° N and 60° S, using 23.6 cm L-band radar. As well as omitting high latitudes, the SRTM design limited actual elevation precision to about 4 m compared with the ±1 m from TerraSAR-X/TanDEM-X. SRTM data with a two-dimensional resolution of 30 m are freely available from the US Geological Survey.

Full global elevation data with a 30 m 2-D resolution and elevation precision of ±9 m have also been produced by the optical stereoscopic potential of the US-Japan ASTER imaging system and are freely available to all via the US Geological Survey. Unlike data produced by radar missions, the optical stereoscopic data from ASTER depend on cloud-free, daytime conditions, and accurate derivation of parallax can be prevented by areas of rugged terrain in deep shadow at the 10 am local-time when images are acquired.

Despite the limitation of TerraSAR-X/TanDEM-X elevation data to a 90 m 2-D resolution, and the consequent loss of textural detail in landscapes, they appear to have the edge in terms of completeness and vertical precision. To get elevation data from DLR requires personal registration after reading a lengthy screed of documentation about data acquisition.