Drip tectonics beneath Türkiye

Tectonics and geomorphology of Turkey showing the main fault systems. The Konya basin is enclosed by the grey rectangle at centre. (Credit: Taymaz et al. Geological Society of London, Special Publication 291, p1-16, Fig 1)

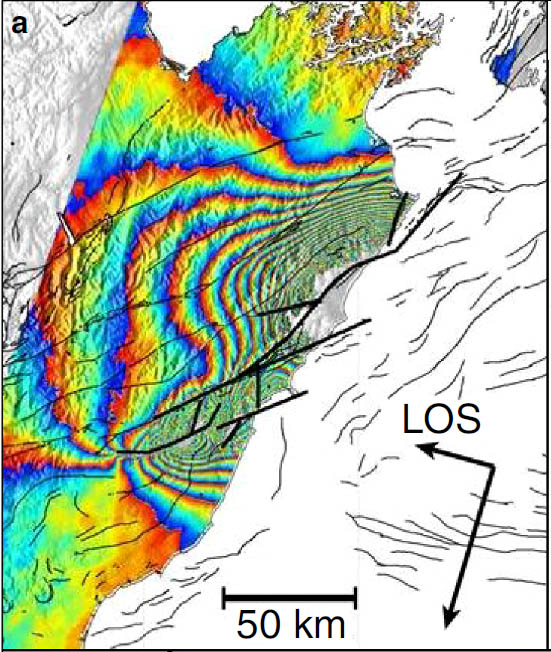
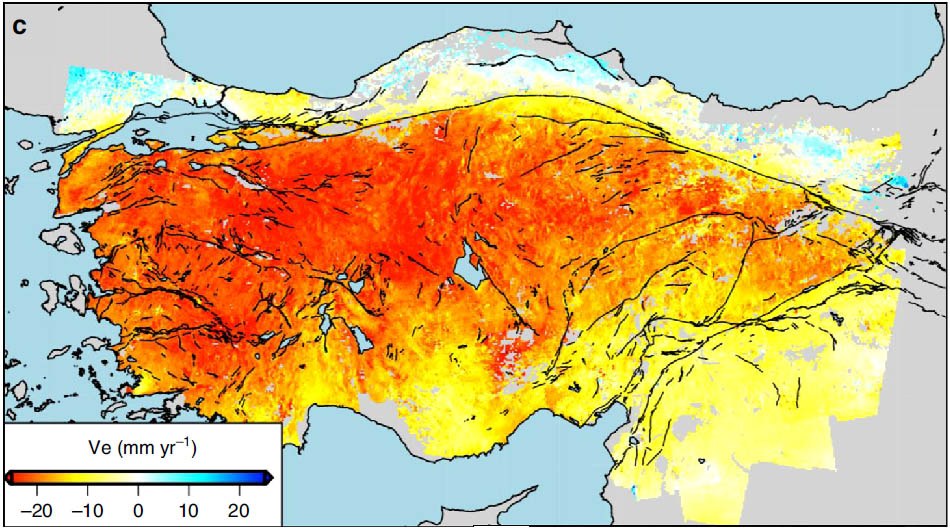
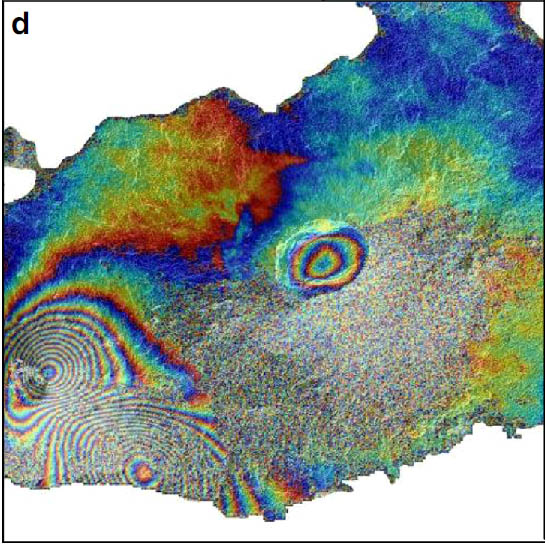
The 1.5-2.0 km high Central Anatolian plateau in Türkiye has been rising since ~11 Ma ago: an uplift of about 1 km in the last 8 Ma. However, part of the southern Plateau shows signs of rapidly subsidence that has created the Konya Basin, marked by young lake sediments. Interferometric radar (InSAR) data from the European Space Agency’s Sentinel-1 satellite, which detects active movement of the Earth’s surface, reveal a crude, doughnut-shaped area of the surface that is subsiding at up to 50 mm per year. This ring of subsidence surrounds a core of active uplift that is about 50 km across (see the first figure). Expressed crudely, active subsidence suggests an excess of mass beneath the affected area, whereas uplift implies a mass deficit; in both cases within the lithosphere. So, when the InSAR data were published in 2020, it became clear that the lithosphere beneath Anatolia is doing something very strange.

Vertical velocities affecting the surface in the Konya Basin derived from InSAR data, velocities colour-coded cyan to blue show subsidence, yellow to red suggesting that the surface is rising. (Credit: Andersen et al., Fig 1c)

Canadian and Turkish geophysicists set out to find a tectonic reason for such aberrant behaviour (Andersen, A.J.  et al. 2024. Multistage lithospheric drips control active basin formation within an uplifting orogenic plateau. Nature Communications, v. 15, Article 7899; DOI: 10.1038/s41467-024-52126-7). They wondered if a process known as ‘drip tectonics’, first mooted as an explanation of anomalous features in some mountain belts in 2004 (see: Mantle dripping off mountain roots, October 2004; and A drop off the old block? May 2008) might be applicable to the Anatolian Plateau. The essence of this process is similar to the slab-pull force at the heart of subduction. Burial and cooling of basaltic material in oceanic lithosphere being driven beneath another tectonic plate converts its igneous mineralogy to the metamorphic rock eclogite, whose density exceeds that of mantle rocks. Gravity then acts to pull the changed material downwards. However, Anatolia shows little sign of subduction. But the mantle beneath shows seismic speed anomalies that hint at anomalously dense material.

Seismic tomography shows that in a large volume 100 to 200 km beneath the central part of the Plateau S-waves travel faster than in the surrounding mantle. The higher speed suggests a body that is denser and more rigid than its surroundings. This could be a sinking, detached block of ‘eclogitised’ lithosphere whose disconnection from the remaining continental lithosphere has been causing the uplift of the Plateau that began in the Late Miocene. A smaller high-speed anomaly lies directly under the Konya Basin, but at a shallower depth (50 to 80 km) just beneath the lithosphere-asthenosphere boundary. The authors suggest that this is another piece of the lower lithosphere that is beginning to sink and become a ‘drip’. Still mechanically attached to the lithosphere the sinking dense block is dragging the surface down.

Andersen et al. instead of relying on computer modelling created a laboratory analogue. This consisted of a tank full of a fluid polymer whose viscosity is a thousand times that of maple syrup that represents the Earth’s deep mantle beneath. They mimicked an overlying  plate by a layer of the same material with additional clay to render it more viscous – the model’s lithospheric mantle – with a ‘crust’ made of a sand of ceramic and silica spherules. A dense seed inserted into the model lithospheric mantle began to sink, dragging that material downwards in a ‘drip’. After that ‘drip’ had reached the bottom of the tank hours later, it became clear that another, smaller drip materialised along the track of the first and also began to sink. Monitoring of the surface of the ‘crust’ revealed that the initial drip did result in a basin. But the further down the drip fell the basin gradually became shallower: there was surface uplift. Once the initial drip had ‘bottomed-out’ the basin began to deepen again as the secondary drip formed and slowly moved downwards. The model seems to match the authors’ interpretation of the geophysics beneath the Anatolian Plateau. One drip created the potential for a lesser one, a bit like in inversion of the well-known slo-mo videos of a drop of milk falling into a glass of milk, when following the drop’s entry a smaller drop rebounds from the milky surface.

Cartoons of drip tectonics beneath the Anatolian Plateau. (a) Lower lithosphere detached from beneath Anatolia in the Late Miocene (10 to 8 Ma) descends into the mantle as it is ‘eclogitised’; (b) a smaller block beneath the Konya Basin beginning to ‘drip’, but still attached to the lithosphere. (Credit: Andersen et al., Fig 4)

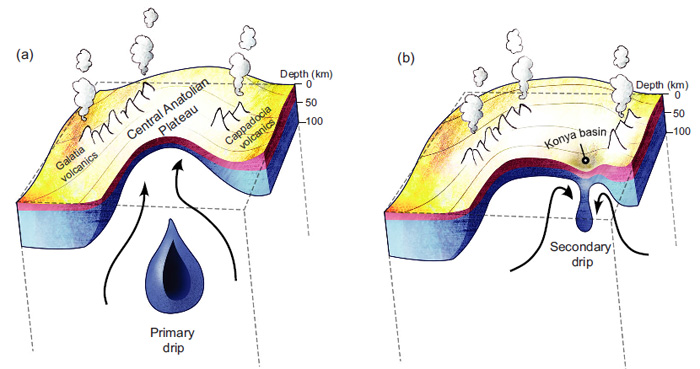
In Anatolia the last 10 Ma has not been just ups and downs of the surface corresponding to drip tectonics. That was accompanied by volcanism, which can be explained by upwelling of mantle material displaced by lithospheric drips. When mantle rises and the pressure drops partial melting can occur, provided the mantle material rises faster than it can lose heat: adiabatic melting.

Monitoring ground motions with satellite radar

By using artificially generated microwaves to illuminate the Earth’s surface it is possible to create images. The technology and the theory behind this radar imaging are formidable. After about 30 years of development using aircraft-mounted transmission and reception antennas, the first high resolution images from space were produced in the late 1970s. Successive experiments improved and expanded the techniques, and for the last decade radar surveillance has been routine from a number of orbiting platforms. Radar has two advantages over optical remote sensing: being an active system it can be done equally effectively day or night; it also penetrates cloud cover, which is almost completely transparent to microwaves with wavelengths between a centimetre and a metre. The images are very different from those produced by visible or infrared radiation, the energy returns from the surface being controlled by topography and the roughness of the surface. One of many complicating factors is that images can only be produced by oblique illumination.  That, together with deployment of widely separated transmission and reception antennas, opens up the possibility of extracting very-high precision (millimetre) measurements of topographic elevation.

In 1992 radar data from two overpasses of the European ERS-1 satellite over California were processed to capture interference due to changes in the ground elevation during the time between the two orbits: the first interferometric radar or InSAR. It revealed the regional ground motions that resulted from the magnitude 7.3 Landers earthquake at 4:57 am local time on June 28, 1992. For the last decade InSAR has become a routine tool to monitor globally both lateral and vertical ground movements, whether rapid, as in earthquakes, or slow in the case of continental plate motions, subsidence or the inflation of volcanoes prior to eruptions. Juliet Biggs and Tim Wright, respectively of the Universities of Bristol and Leeds, UK, have summarised InSAR’s potential (Biggs, J. & Wright, T.J. 2020. How satellite InSAR has grown from opportunistic science to routine monitoring over the last decade. Nature Communications, v. 11, p. 1-4; DOI: 10.1038/s41467-020-17587-6).

Ground motions associated with the 2016 Kaiköuea earthquake on the South Island of New Zealand. Each colour fringe represents 11.4 cm of displacement in the radar line-of-sight (LOS) direction. Known faults are shown as thick black lines (Credit: Hamling et al. 2017. Complex multifault rupture during the 2016 Mw 7.8 Kaikōura earthquake, New Zealand. Science, v. 356, article eaam7194; DOI: 10.1126/science.aam7194)

Since the ERS-1 satellite discovered the ground motions associated with the Landers earthquake, InSAR has covered more than 130 large seismic events. Although the data post-dated the damage, they have demonstrated the particular mechanics of each earthquake, allowing theoretical models to be tested and refined. In the image above it is clear that the motions were not associated with a single fault in New Zealand: the Kaikoura earthquake involved a whole network of them, at least at the surface. Probably, displacement jumped from one to another; a complexity that must be taken into account for future events on such notorious fault systems as those in densely populated parts of California and Turkey.

East to west speed of the Anatolian micro-plate south of the North Anatolian Fault derived from the first five years of the EU’s Sentinel-1 InSAR constellation. Major known faults shown by black lines (Credit: Emre, O. et al. 2018. Active fault database of Turkey. Bulletin of Earthquake Engineering, v. 16, p. 3229-3275; DOI: 10.1007/s10518-016-0041-2)

Since its inception, GPS has proved capable of monitoring tectonic motions over a number of years, but only for widely spaced, individual ground instruments. Using InSAR alongside years’ worth of GPS measurements helps to extend detected motions to much finer resolution, as the image above shows for Asiatic Turkey. An important parameter needed for prediction of earthquakes is the way in which crustal strain builds up in regions with dangerously active fault systems.

InSAR image of the Sierra Negra volcano on Isabela Island in the Galapagos Archipelago, at the time of a magma body intruding its flanks. Each colour fringe represents 2.8 cm of subsidence in the LOS direction (Credit: Anantrasirichai, N. et al. 2019. A deep learning approach to detecting volcano deformation from satellite imagery using synthetic datasets. Remote Sensing of Environment, v. 230, article 111179; DOI: 10.1016/j.rse.2019.04.032)

Volcanism obviously involves the movement of large masses of magma beneath the surface before eruptions. GPS and micro-gravity measurements show that charging of a magma chamber causes volcanoes to inflate so InSAR provides a welcome means of detecting the associated uplift, even if it only a few centimetres, as show by the example above from the Galapagos Islands. A volcano’s flanks may bulge, which could presage a lateral eruption or a pyroclastic flow such as that at Mount St Helens in 1980. Truly vast eruptions are associated with calderas whose ring faults may cause collapse in advance.

The presence of cavities beneath the surface, formed by natural solution of limestones, deliberately as in extraction of brines from salt deposits or after subsurface mining, present subsidence hazards. There have been several series of alarming TV programmes about sinkhole formation that demonstrate sudden collapse. Yet every case will have been preceded by years of gradual sagging. InSAR allows risky areas to be identified well in advance of major problems. Indeed estate agents (realtors) as well as planners, civil engineers and insurers form a ready market for such survey.