As radar stands for radio detection and ranging, so lidar signifies light detection and ranging. In one respect the two are related: they are both active means of remote sensing and illuminate the surface, rather than passively monitoring solar radiation reflected from the surface or thermal radiation emitted by it. The theory and practice of imaging radar that beams microwaves at a surface and analyses the returning radiation are fiendishly complex. For a start microwave beams are directed at an angle towards the surface. Lidar is far simpler being based on an aircraft -mounted laser that sends pulses vertically downwards and records the time taken for them to be reflected from the surface back to the aircraft. The method measures the distance from aircraft to the ground surface and thus its topographic elevation. Lidar transmits about 100 thousand pulses per, so the resulting digital elevation model has remarkably good spatial resolution (down to 25 cm) and can measure surface elevation to the nearest centimetre. The technique is becoming popular: the whole of England and much of the nations of Scotland, Wales and Northern Ireland now have lidar coverage with 1 metre resolution.
The first thing the laser pulses encounter is the vegetation canopy, from which some are reflected back to the instrument. Others penetrate gaps in the canopy, to be reflected by the ground surface, so they take slightly longer to return. If the penetrating pulses are digitally separated from those reflected by vegetation, they directly map the elevation of the solid ground surface or the terrain. These data produce a digital terrain model (DTM) whereas the more quickly returning pulses map the height and structure of the ground cover, if there is any. Both products are useful, the first to map topographic and geological features, the details of which are hidden to conventional remote sensing, the second to assess vegetation. The great advantage of a DTM is that image processing software can simulate illumination and shading of the terrain from different directions and angles to improve interpretation. Aerial photography has but a single direction and angle of solar illumination, depending on the time of day, the season and the area’s latitude. Stereoscopic viewing of overlapping photographic images does yield topographic elevation, and photogrammetric analysis produces a digital elevation model, but its usefulness is often compromised by ground cover in vegetated terrain and by shadows. Also its vertical resolution is rarely better than 1 m. Another factor that limits terrain analysis using aerial photographs and digital images from satellites is the ‘patchwork-quilt’ appearance of farmed land that results from sharp boundaries between fields that contain different crops, bare ploughed soil and grassland. Together with spatial variation of natural vegetation, both ‘camouflage’ physical features of the landscape.
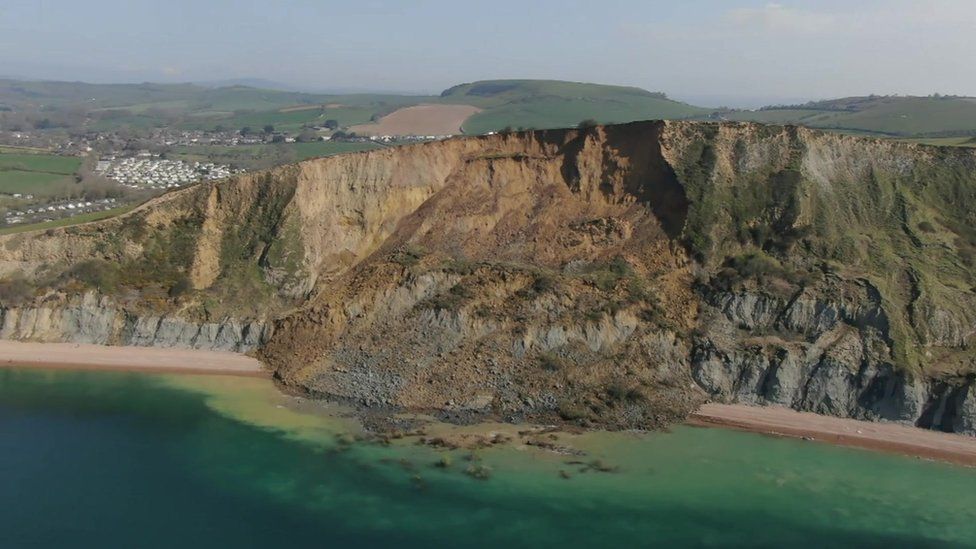
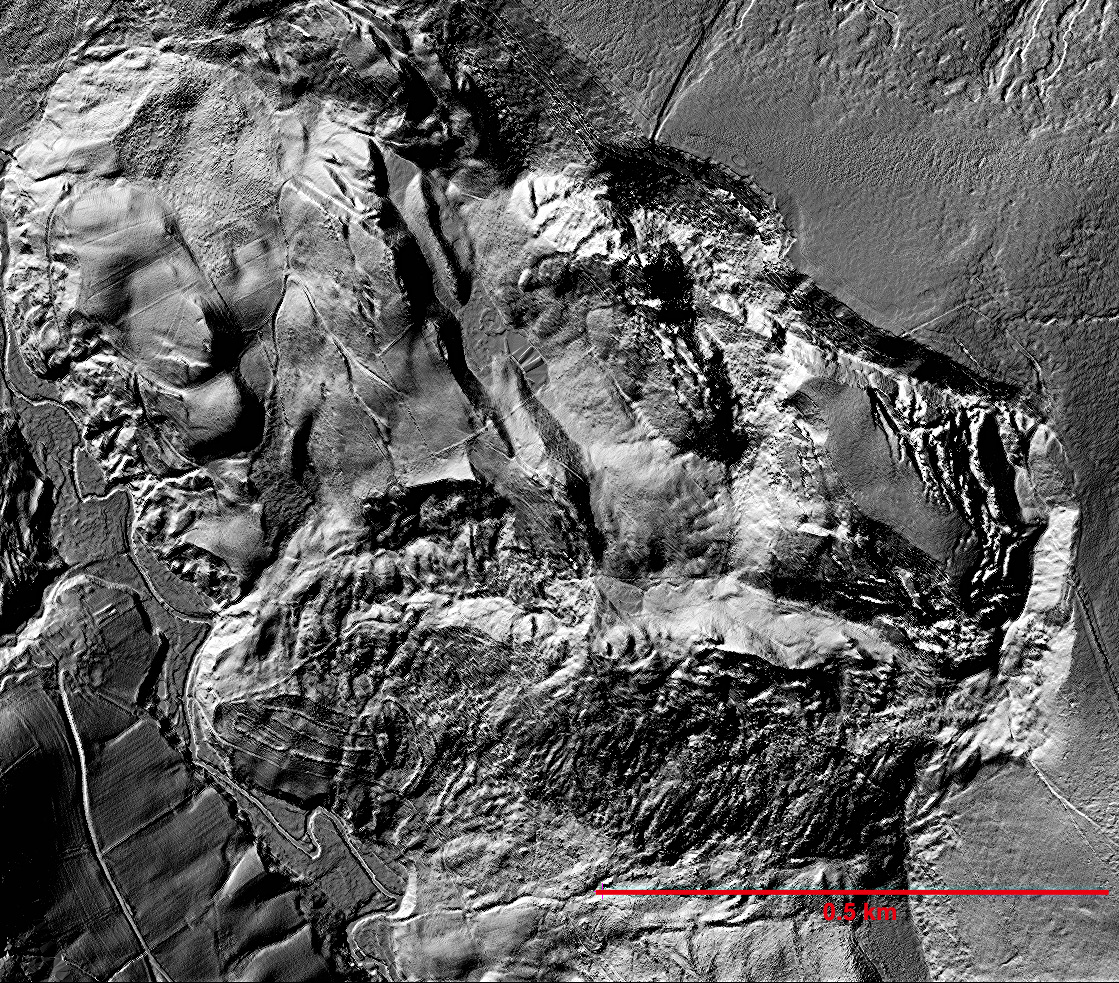
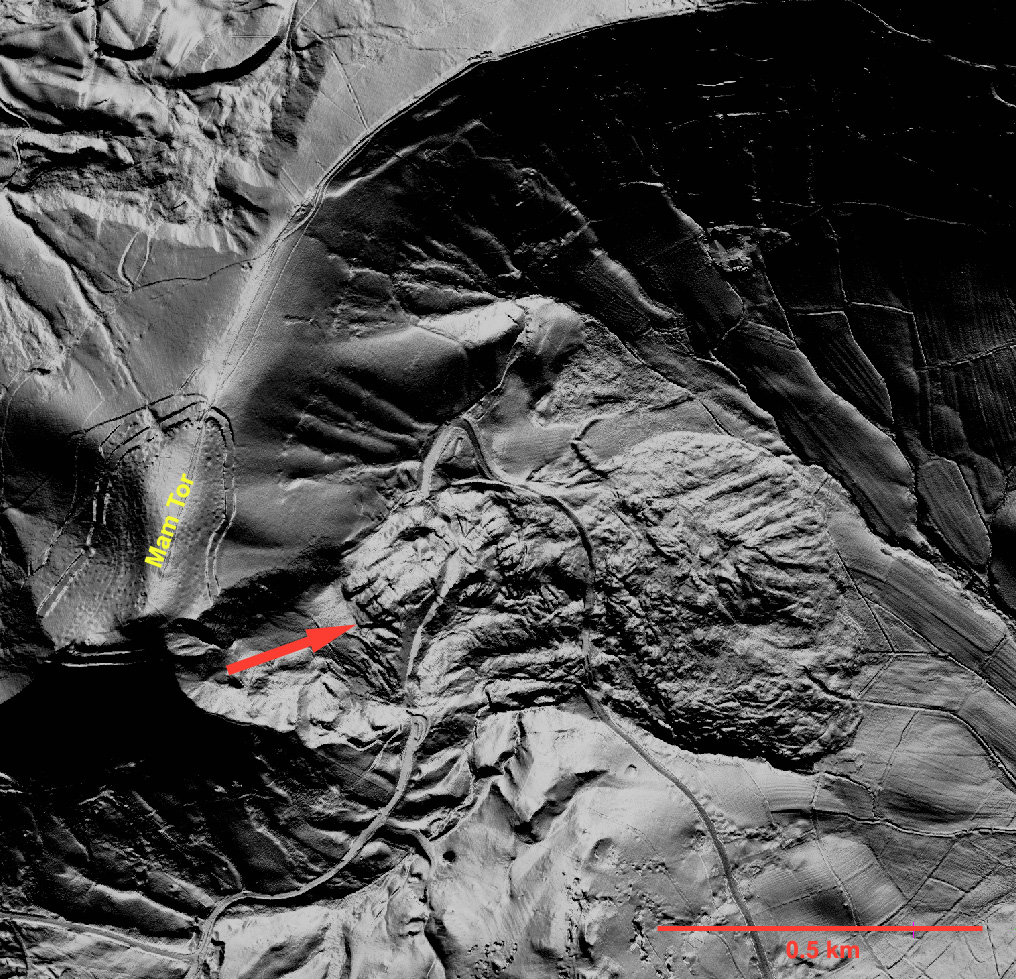
In the field, areas of what is known as ‘mass wasting’, such as landslides, landslips, rockfalls, debris flows and solifluction, show topographic features that are characteristic of the processes involved. They can be mapped by careful geological surveys. But are overlooked, being masked by vegetation cover such as woodland or because slower downslope movement of soil has smoothed out their original landforms. Potentially devastating mass wasting is encouraged by increased moisture content of soils and rocks that lie beneath steep slopes. Moisture provides lubrication that gravitational forces can exploit to result in sudden disruption of slopes and the movement of huge masses of Earth materials. Large areas of upland Britain show evidence of having experienced such mass wasting in the past. Some continue to move, such as that in the Derbyshire Peak District on the slopes of Mam Tor, as do cases on rugged parts of Britain’s coast where underlying rocks are weak and coastal erosion is intense (see image above).
It is thought that many of the mass-wasting features in Britain were initiated at the start of the Holocene. Prior to that, during the Younger Dryas cooling event, near-surface Earth materials were gripped solid by permafrost. Sudden warming at about 11.7 ka ago melted deeply frozen ground to create ideal conditions for mass wasting. In the last eleven thousand years the surface has come to a more or less stable gravitational balance. Yet heavy, sustained rainfall may reactivate some of the structures or trigger new ones. The likelihood of increased annual rainfall as the climate warms will undoubtedly increase the risk of more and larger instances of mass wasting. Indeed such an acceleration is happening now.
The most risky places are those with a history of landslides etc. So detailed mapping of such risk-prone ground is clearly needed. The UK has a large number of sites where mass wasting has been recorded, and below are lidar images of three of the most spectacular. Undoubtedly, there are other areas where no recent movements have been recorded, but which may ‘go off’ under changed climatic conditions. One of the best documented risky areas is in the English West Midlands within the new city of Telford. It follows the flanks of the River Severn as it passes through the Ironbridge Gorge that was cut by subglacial meltwater after the last glacial maximum. This area is also recognised as having been the birthplace of the Industrial Revolution. In 1714 Abraham Darby pioneered the use of coke in iron smelting and mass production of cast iron at Coalbrookdale a few kilometres to the east. The Severn also powered numerous forges and other heavy industries in the 18th and 19th centuries. Industrial activity and townships in the Gorge have been plagued by large-scale mass wasting throughout subsequent history and no doubt long before. An excellent illustrated guide to the area has been produced by the Shropshire Geological Society (Rayner, C. et al. 2007. A Geological Trail through the landslides of Ironbridge Gorge, Proceedings of the Shropshire Geological Society, v. 12, p. 39-52; ISSN 1750-8568)